INTRODUCTION
Historically, bread is one of the most widespread products, being consumed by 80% of the world’s population under different formulations, processing, and shapes. In the 27 EU member states, the bread market is around 32 million tons. Despite of these considerable numbers, the consumption of the common bread is declining in the last years due to changes in eating patterns and the availability of bread enriched with functional ingredients [Mencin et al., 2023; Uriho et al., 2024] and several bread substitutes [Angelino et al., 2020]. The key to bringing this product back into vogue is to improve its quality and/or consumer quality perception to effectively counteract the competition from its substitutes. The suggestion that improving bread quality is key to reviving its popularity aligns with the actual consumption trends, which show a growing preference for quality ingredients and products over quantity. Among the factors influencing quality, the choice of ingredients directly affects product’s texture and flavour.
The key attributes of bread include appearance, flavour, and texture that, in turn, affect acceptability, pleasantness, preference and willingness to consume. The crumb colour mainly depends on the ingredients used while that of crust is influenced by Maillard reactions and caramelisation, although the latter can be partially masked by the colour imparted by bread formulation [Martins et al., 2017]. These reactions are also responsible for the crust flavour compounds originating during baking, while fermentation and enzymatic reaction mostly affect intensity and quality of crumb flavour. In the end, loaf volume, crumb density, and crust and crumb structure determine biting properties and chewiness. All these attributes are very critical for the overall quality evaluation of bread. The enrichment of bread with functional ingredients must be carefully investigated since such compounds can determine undesired changes of textural, mechanical, and sensory properties. Uriho et al. [2024] studied the combined effects of encapsulated vitamin C and ω-3-rich sablefish oil on both the quality of bread and the stability of the bioactive ingredients. The combination of such compounds was able to both increase the retention of encapsulated vitamin C and decrease the lipid oxidation with respect to the non-combined forms while maintaining the textural properties and masking the fishy flavour.
The strategies implemented to enhance bread quality include the use of integrated bread baking improvers, i.e., of ingredients such as oxidants, gluten-reducing agents, enzymes, emulsifiers, hydrocolloids, organic acids, and other food additives, selected based on their activity and synergistic effect within a wide range of compounds, and added to the bread formulation. The advantage of using integrated bread-making improvers is that they act during the entire bread-making process. Their use is widely spread to: standardize the technological quality of wheat flour; compensate for the deficiencies of weak flours and mitigate their negative effects on dough development and properties of the finished products. On the other hand, the effects deriving from the addition of improvers to strong flours have been little investigated. Improvers could negatively change the viscoelastic properties of strong flours with detrimental effects on loaf shape and crumb porosity, as a consequence of an excessive crosslinking that makes the dough too strong [Mohammadi et al., 2015]. The strengthening effects of improvers, such as transglutaminase added to flours with strong gluten, may result in an undesirable bread hardening [Boukid et al., 2018]. According to Boukid et al. [2018], the effects of improvers depend on the interaction between the type and level of improvers and flour strength level. As an example, the specific volume of strong flour based-bread increased with the addition of low concentrations of transglutaminase (0.1 g/100 g) and decreased at higher added levels due to an excessive crosslinking [Mohammadi et al., 2015]. Instead, vital gluten added to astrong flour induces a slight increase in springiness (due to better elasticity of the gluten network) and cohesiveness. The effects of other kinds of improvers have not been investigated.
In view of the above findings, this study aimed at investigating the effect of the addition of bread improvers on the quality of loaves produced with a strong Manitoba flour. Manitoba is a high-protein, high-gluten soft wheat flour originating from the province of Manitoba, Canada, from which it takes its name. It is known for its exceptional strength, water-absorbing capacity, and a strong gluten network, making dough elastic, stable, and suitable for long-leavening time. The choice fell on the following improvers: gluten because, by forming a network that envelops starch, it limits α-amylase access to starch, thus reducing the glycaemic index of the corresponding bread [Zeng et al., 2023]; lecithin, because it not only improves bread quality characteristics but also preserves product freshness [Codinã & Mironeasa, 2016]; xylanase, because it is able to release and transfer free water from pentoses to protein, increasing gluten hydration and, moreover, because the water-soluble arabinoxylans can stabilize gas cells [Mohammadi et al., 2022]; ascorbic acid, because of its documented ability to improve oxidative action in bread-making [Kiyashko & Sideltsev, 2022]; a combination of lecithin and gluten, selected because Mohamed et al. [2006] documented its ability to reduce degradation in maize starch but not in rice starch; and an unusual combination of lecithin with ascorbic acid (previous research used additives containing lecithin and ascorbic acid not alone but together with other improvers [Lambert-Meretei et al., 2010]). The comparisons among improvers were performed by investigating their effects on physiochemical, sensory, and structural parameters but also on the bread antioxidant content. This latter approach is less common, having been implemented by few researchers to date. For example, Hemalatha et al. [2012] investigated changes in nutraceutical and antioxidant properties of chapatis obtained by doughs supplemented with amylases and xylanase, observing an increase of soluble dietary fibre and phenolic compounds when the first enzyme was used. The possibility to homogenously group the bread samples according to the type of improvers added to the formulation was also explored.
MATERIALS AND METHODS
Bread formulation
The ingredients used in bread production included: Manitoba soft wheat flour type 0 free from additives (strength 350±10; tenacity/extensibility ratio equal to 0.6±0.1; COOP, Casalecchio di Reno, Italy), water, extra-virgin olive oil (Pazienza, Foggia, Italy), sodium chloride (Compagnia Europea Sali, Margherita di Savoia, Italy), and dehydrated S. cerevisiae yeast (Cameo, Desenzano del Garda, Italy). The bread improvers used were as follows: gluten (Elgranero, Madrid, Spain), soy lecithin (Céréal, Lainate, Italy), food-grade xylanase (10,000 U/g), Vland Biotech Group, Qingdao, China), and ascorbic acid (Balducci, Faenza, Italy).
A control (without improvers) and six bread types obtained by adding one or two improvers were produced according to the formulations described in Table 1 and appeared as in Figure 1. As can be inferred, the volume of water requested by the various formulations was the same, giving doughs of comparable consistency. The quantity of each improver has been calculated as the percentage of the flour weight of the control bread and used to replace the same amount of flour: gluten, 2%; soy lecithin, 1%; xylanase, 0.01%; ascorbic acid, 0.02%; ascorbic acid plus soy lecithin, 0.02% and 1%, respectively; gluten plus soy lecithin, 2% and 1%, respectively. The percentages represent the average values indicated by the improver suppliers. Three technological replicates were produced in a randomized order for each bread type. Loaves of regular shape were produced as described by Baiano et al. [2023] using a Zero-Glu Pro bread-making machine (Imetec, Azzano S. Paolo, Italy) through the following steps: mixing the powdered ingredients (except salt); adding water and, after 2 min, adding the salt; kneading for 22 min; leavening for 40 min; stirring for 5 s; leavening for 73 min; stirring for 5 s; leavening for 50 min; and baking for 47 min at a temperature of 180°C.
Table 1
Bread formulations (amount of ingredients in g).
[i] B_control, bread without improvers; B_gluten, bread with gluten (replacing 2% of flour, w/w); B_lecithin, bread soy lecithin (1% of flour, w/w); B_xylanase, bread with xylanase (0.01% of flour, w/w); B_ascorbic acid, bread with ascorbic acid (0.02% of flour, w/w); B_asc_lec bread with ascorbic acid and soy lecithin (0.02% and 1% of flour, w/w, respectively); B_glu_lec bread with gluten and soy lecithin (2% and 1% of flour, w/w, respectively).
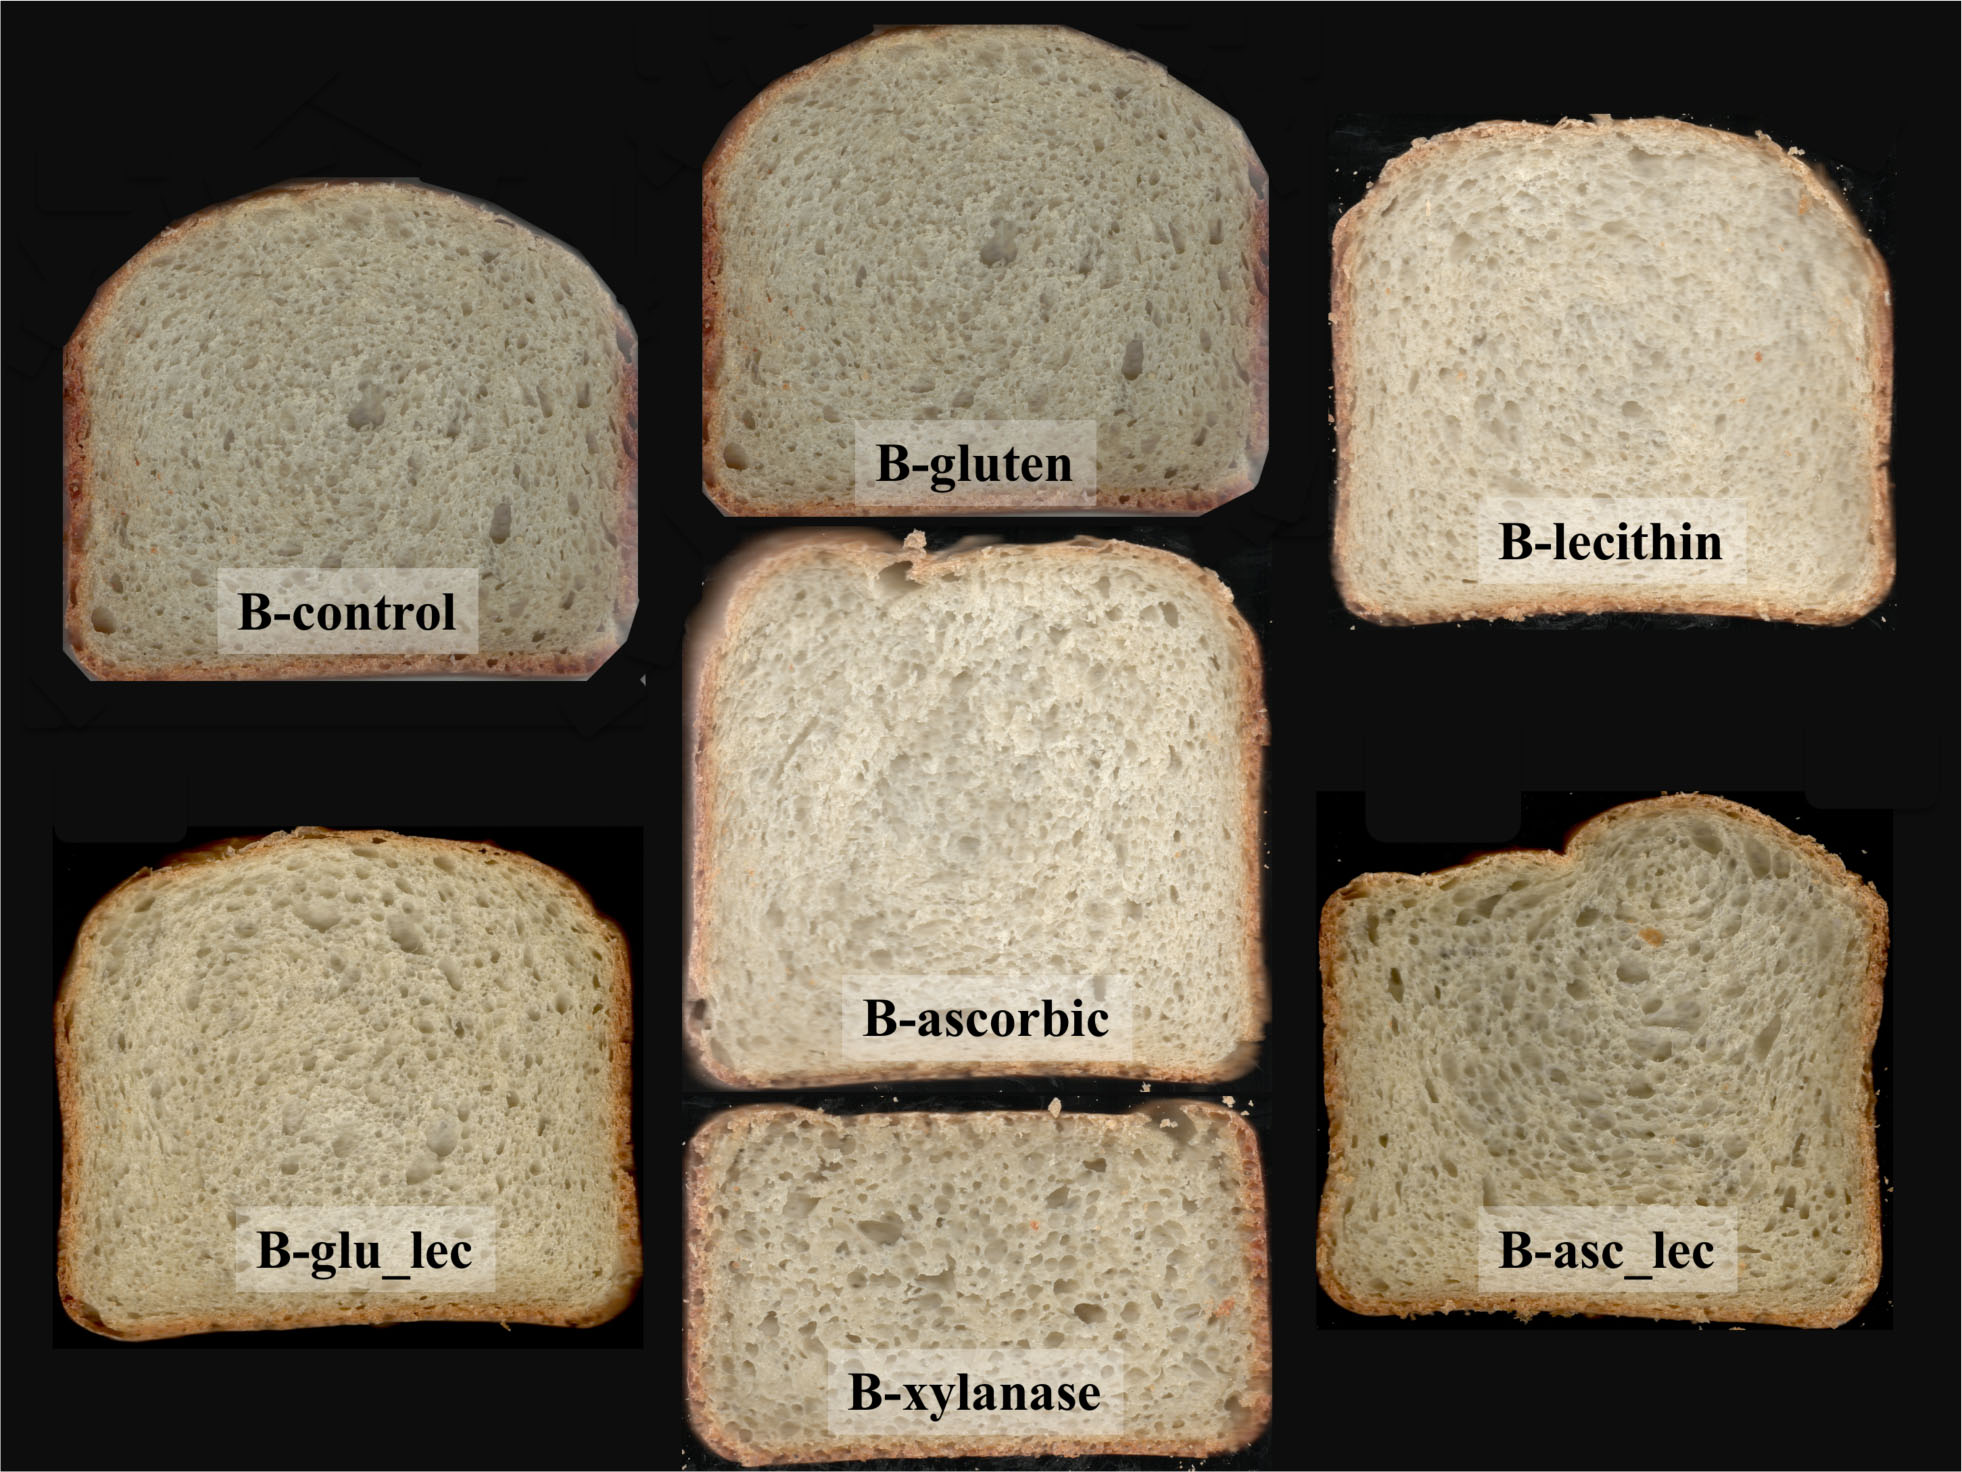
Figure 1
Appearance of bread slices. B_control, bread without improvers; B_gluten, bread with gluten (replacing 2% of flour, w/w); B_lecithin, bread soy lecithin (1% of flour, w/w); B_xylanase, bread with xylanase (0.01% of flour, w/w); B_ascorbic, bread with ascorbic acid (0.02% of flour, w/w); B_asc_lec bread with ascorbic acid and soy lecithin (0.02% and 1% of flour, w/w, respectively); B_glu_lec bread with gluten and soy lecithin (2% and 1% of flour, w/w, respectively).
Analyses of breads
Physical and chemical analyses
To evaluate the bread chromatic characteristics, the loaves were cut using an electric slicer into 1 cm-thick slices, and slice images (resolution 1,200 dpi) were acquired using an Epson scanner (mod. XP-3100, Cinisello Balsamo, Italy) and saved in the tiff format. The free ImageJ software ver. 1.52a (Bethesda, MD, USA) was used to process the acquired images according to Baiano et al. [2023]. The crust and crumb colours were expressed as follows: L* (lightness/brightness), ranging from black to white on a 0–100 scale; a*, with negative and positive values corresponding to green and red colours, respectively; b*, with negative and positive values corresponding to blue and yellow colours, respectively. An image-based colour calibration was performed using a standard colour calibration chart [Sunoj et al., 2018].
Moisture and ash quantification were performed following the AACC International methods 44-15.02 and 08-01.01, respectively, and expressed as g/100 g of bread [AACC, 2012].
The bread phenolic extracts were obtained according to method described by Baiano et al. [2023]. More precisely, for each type of bread, the percentage of crust in relation to the total weight of the loaf was quantified. That percentage ranged from 28 to 43%. Then, the bread samples to be submitted to the phenolic extraction were prepared by mixing the crust and crumb in the correct proportions. One g of each bread sample prepared in that manner was added to 30 mL of a hydroalcoholic solution (58% ethanol, v/v). The obtained suspension was first sonicated (37 kHz, 30°C, 30 min), then centrifuged (2,000×g, 25 min, 20°C), and the supernatant was recovered and filtered through a nylon filter (0.45 μm).
The total phenolic content (TPC) was quantified using the Folin–Ciocalteu reagent [Almeida da Rosa et al., 2017]. Briefly, 150 µL of diluted phenolic extracts or 58% (v/v) ethanol (blank) were mixed with 7,500 µL of distilled water and 750 µL of Folin–Ciocalteau reagent. After 3 min, 2,250 µL of 15% sodium carbonate and 4,350 µL of distilled water were added, and the resulting mixture was incubated for 2 h, at 25°C, in the dark. The absorbance was read at 765 nm. A calibration curve for gallic acid was prepared in parallel. The results were expressed as mg of gallic acid equivalents per 100 g of bread dry matter (dm).
The phenolic profile of the extracts was analysed by high-performance liquid chromatography with diode array detector (HPLC-DAD) system (Agilent 1100 Liquid Chromatograph, Santa Clara, CA, USA) using a 100×4.6 mm, 3 µm particle size, RP-C18 Gemini column (Phenomenex, Aschaffenburg, Germany) and the following separation conditions: column temperature at 30°C; injection volume 100 μL; flow rate 1 mL/min; mobile phase solvent A (1.0% acetic acid in water, v/v) and solvent B (50% methanol, 50% acetonitrile, v/v) applied in a linear gradient from 5% to 30% B in 25 min, from 30% to 40% B in 10 min, from 40% to 48% B in 5 min, from 48% to 70% B in 10 min, from 70% to 100% B in 5 min, 100% B for 5 min, return to the initial conditions in 10 min, and column equilibration for 12 min [Baiano et al., 2023]. Retention times and spectra of extract phenolic compounds were compared to those of pure standards. Quantification (mg/100 g bread dm) was performed by comparing the peak areas of extract phenolic compounds calculated at 280 or 320 nm with those of the standard curves.
The antioxidant capacity of breads was measured through the 2,2-diphenyl-1-picrylhydrazyl (DPPH) assay [Brand-Williams et al., 1995]. The diluted phenolic extracts (0.1 mL) were added to 3.9 mL of a 6×10⁻⁵ M methanol DPPH radical solutions. The absorbance at 515 nm was measured at 0 min, 1 min and every 15 min until the reaction reached a plateau. The results were expressed as mmol of 6-hydroxy-2,5,7,8-tetramethylchroman-2-carboxylic acid (Trolox) equivalents per 100 g of bread dm.
Determination of structural properties
The following structural characteristics were determined starting from the slice images acquired and processed as already described: minimum and maximum slice height (cm); pore density (number of pores/mm2); average pore size (mm2); porosity %, i.e., the surface of the slice occupied by pores; pore circularity, calculated as 4π*area/perimeter2 (it ranges between 1.0 and 0.0, with a value of 1.0 indicating a perfect circle and value near to 0.0 indicating increasingly elongated shapes). The specific volume (mL/g) was determined as the ratio between volume and weight of whole (crust+crumb) loaves. The loaf volume was measured according to rapeseed displacement using AACC method 10-05.01 [AACC, 2010]. The crust % was also evaluated multiplying by 100 the ratio between the weight of the crust withdrawn from a loaf and the total weight of the same bread loaf.
Sensory analysis
A quantitative descriptive analysis (QDA) was carried out according to Baiano et al. [2023] by a trained panel made of 10 judges (5 women and 5 men) between 20 and 65 years of age, with long experience in the sensory evaluation of baked foods. The profile sheet included the following attributes: visual (colour and thickness of crust; colour, pore size, and development of crumb); olfactory (overall, freshly baked bread, wheat, and malty aroma on crust and crumb together; toasty aroma on crust; yeast aroma on crumb); gustatory (sweetness, saltiness, and sourness of crumb), and tactile (hardness and crispiness of crust; resistance to chewing, cohesiveness, graininess, stickiness of crumb). Panellists were also asked to evaluate the overall sensory quality of each bread, i.e., the comprehensive quality of the sample evaluated by considering all the sensory attributes. The intensity of each parameter was evaluated on a 0–9 scale.
Statistical analysis
Each analysis was replicated three times, except for the image analysis, with five acquisitions for each sample. The means and the standard deviations were calculated. Analysis of variance (ANOVA) followed by least square difference (LSD) test was applied at p<0.01 to highlight any statistically significant differences induced by the addition of the improvers on each variable. Principal component analysis (PCA) was used to evaluate if the experimental data allowed the homogeneous grouping of breads according to the improver used. Pearson correlation coefficients at p<0.01 were applied to highlight any significant correlations among pairs of bread sample variables. The statistical analyses were performed using Statistica for Windows ver. 7.0. (Statsoft, Tulsa, OK, USA).
RESULTS AND DISCUSSION
Physiochemical properties
The physiochemical characteristics of the breads produced from formulations including improvers are reported in Table 2 and compared to those of the control bread. The type of improver influenced the colour coordinates of bread, with xylanase that made the colour of crust and crumb darker compared to the colour of the control bread and to the colour imparted by the other additives. This may be a consequence of the hydrolysis of the β-1,4 glycosidic bonds of arabinoxylan and the release of reducing sugars, which increases the extent of Maillard reaction [Wang et al., 2018]. However, it was opposite to what was highlighted in the whole-wheat bread by Ghoshal et al. [2013], who observed a brighter colour compared to that of bread prepared without enzyme despite of the high quantities of enzyme added (from 0.3 to 0.6 g/100 g of flour). The addition of xylanase also increased the intensity of crumb red and yellow hues, probably due to the changes induced in the structural characteristics as described subsequently. The highest values of crust a* and b* detected in lecithin-supplemented bread were due to the thermal transformation of lecithin during baking with production of four pyridinium compounds whose formation mechanism involves a pseudo-Maillard re-arrangement reaction [Fujimoto et al., 2021]. In agreement with Yeşil & Levent [2022], the highest crumb L* values were measured on bread supplemented with lecithin alone or combined with gluten, depending on the ability of lecithin to act as a natural antioxidant. Crust a* values and crumb a* and b* values detected on bread supplemented with ascorbic acid were indicative of its ability to act as a colour stabilizer.
Table 2
Physiochemical characteristics of breads with and without improvers.
[i] Results are shown as men ± standard deviation. In column, different letters indicate significant differences at p<0.01. B_control, bread without improvers; B_gluten, bread with gluten (replacing 2% of flour, w/w); B_lecithin, bread soy lecithin (1% of flour, w/w); B_xylanase, bread with xylanase (0.01% of flour, w/w); B_ascorbic acid, bread with ascorbic acid (0.02% of flour, w/w); B_asc_lec bread with ascorbic acid and soy lecithin (0.02% and 1% of flour, w/w, respectively); B_glu_lec bread with gluten and soy lecithin (2% and 1% of flour, w/w, respectively).
After baking, the breads supplemented with lecithin or ascorbic acid showed the lowest crust moisture values (Table 2), but this common result can be explained by different mechanisms of action of these improvers. In the case of bread supplemented with lecithin, the binding of emulsifiers with starch granules prevented moisture migration from crumb to crust during baking [Tebben et al., 2022]. Regarding the effect of ascorbic acid, its addition was responsible for the decrease in vaporization temperature because of the reduced interaction of the tightly bound water with crust bread components [Kerch et al., 2012]. Instead, when the two improvers were applied together, crust was able to retain the highest moisture percentage, which is in agreement with findings reported by Latif et al. [2005]. Regarding crumb, it is well known that the greater the loss of water during baking, the quicker the bread ages and stales [Kotoki & Deka, 2010]. Bread supplemented with ascorbic acid alone or together with lecithin had the lowest crumb moisture since, during baking, the interaction of lecithin with starch delayed water absorption and granule swelling while the inclusion of ascorbic acid resulted in the already cited reduction in vaporization temperature [Codinã & Mironeasa, 2016; Kerch et al., 2012]. The control bread showed the highest crumb moisture (24.5 g/100 g). Crumb moisture content was not affected by gluten as highlighted by the absence of significant difference (p≥0.01) with respect to the control, which is in agreement with the findings of Curti et al. [2014]. The ash contents ranged from 2.98 g/100 g of xylanase-supplemented bread to 3.13–3.14 g/100 g of breads supplemented with combinations of ascorbic acid with lecithin or gluten, whose greater ash content depended on the contribution of minerals from the last two ingredients.
The effect of the addition of bread improvers on the content of antioxidants is of particular interest as it is a poorly investigated subject. The control bread, together with that supplemented with the mixture of gluten and lecithin showed the lowest TPC (Table 3). The total phenolic content was increased by the treatment with xylanase, due to the hydrolysis of arabinoxylans and the higher release of reducing sugars (able to react with the Folin-Ciocalteu reagents) and bound phenolic compounds, and by the addition of ascorbic acid, able to protect oxidizable molecules such as phenolic and flavour compounds and to reduce the o-quinones generated through the reaction catalysed by polyphenol oxidase [Chen et al., 2019; Landi et al., 2013]. Table 3 also shows the phenolic compounds detected in control and supplemented breads. Gallic acid was the major phenolic compound in all bread samples. As observed by Meral & Köse [2019], its content increased during fermentation and baking. Bread with ascorbic acid showed the highest content of gallic acid and was the only bread type containing 4-hydroxybenzoic acid. Probably, the overall phenolic content of that bread was preserved by ascorbic acid because this compound acts as a synergistic antioxidant, regenerating oxidized phenolic antioxidants [Nahas, 2012]. However, it was the only bread whose p-coumaric acid content was under the detection limit. The lowest gallic acid contents (2.6–2.8 mg/100 g) were detected in breads produced with lecithin alone or in combinations with ascorbic acid or gluten, probably as a consequence of the ability of phenolic compounds to protect lecithin against oxidation [Mazaletskaya et al., 2024; Saleh et al., 2022]. Bread supplemented with the combination of ascorbic acid and lecithin was the only one that contained ferulic and caffeic acids, probably because they were regenerated by ascorbic acid [Alemán et al., 2015; Vijayalakshmi et al., 2014]. At the same time, bread with ascorbic acid and soy lecithin showed a low total phenolic content as a consequence of the lower gallic acid content. Antioxidant capacity ranged from 0.159 mmol Trolox/100 g dm in bread supplemented with ascorbic acid to 0.628 mmol Trolox/100 g dm in the control bread. Antioxidant capacity values were positively correlated with the content of p-coumaric acid (correlation coefficient, r=0.913) and negatively correlated with gallic acid (r=−0.883) content.
Table 3
Total phenolic content (TPC), content of individual phenolic compounds, and antioxidant capacity (AC) of breads with and without improvers.
[i] Results are shown as mean ± standard deviation. In column, different letters indicate significant differences at p<0.01. B_control, bread without improvers; B_gluten, bread with gluten (replacing 2% of flour, w/w); B_lecithin, bread soy lecithin (1% of flour, w/w); B_xylanase, bread with xylanase (0.01% of flour, w/w); B_ascorbic acid, bread with ascorbic acid (0.02% of flour, w/w); B_asc_lec bread with ascorbic acid and soy lecithin (0.02% and 1% of flour, w/w, respectively); B_glu_lec bread with gluten and soy lecithin (2% and 1% of flour, w/w, respectively); dm, dry matter; nd, not detected.
Structural properties
Bread structure was significantly influenced by the type of improver added to the formulation. The first interesting parameter is the incidence of the crust weight on the total weight, whose percentages were in the following increasing order: 29.6%, control bread; 31.4%, bread with ascorbic acid and lecithin; 32.5%, bread with gluten; 33.5%, bread with ascorbic acid; 34.6%, bread with gluten and lecithin; 35.5%, bread with lecithin; 41.4%, bread with xylanase. These data must be read together with those relating to the development of the loaves during leavening, since the incidence of the crust increased as the specific volume (Figure 2) decreased (r=–0.802). The importance of measuring the bread specific volume relies on the evidence that it can be considered a good predictor of bread firmness [Eduardo et al., 2014]. In other words, the greater the specific volume, the softer the crumb. The lowest specific volume detected for xylanase-supplemented bread was opposite to the findings of previous research. Jaekel et al. [2012] stated the absence of significant differences among the white breads supplemented with that enzyme in concentrations between 0 and 12 g/100 kg flour. Ahmad et al. [2014] described a larger specific volume of bread with xylanase. They observed that brans absorbed large amount of water, making it less available for gluten proteins and resulting in a reduced gluten network development. Xylanases are able to hydrolyse soluble and insoluble pentosans, facilitating the release of free water that becomes available for a proper gluten development, thus resulting in a higher loaf volume. However, according to Ahmad et al. [2014], the excessive breakdown of starch may have negative effects, as excessively leavened doughs collapse during baking leading to a decreased loaf volume. Another reason that could explain the unusual behaviour of xylanase-added bread could be a low amount of arabinoxylans in the Manitoba flour so that, although the correct dose of enzyme was used, it resulted in an overdosage. Bread supplemented with ascorbic acid had the highest specific volume, with an increase of almost 6% compared to the control bread. This effect is due to the ability of dehydroascorbic acid formed during mixing to oxidize gluten sulfhydryl groups producing the strong disulphide bonds that further stabilize the dough obtained from Manitoba flour [Koehler, 2003]. The supplementation with gluten or lecithin or their combinations did not increase the specific volume with respect to the control bread, contrary to literature reports [Tebben et al., 2022]. However, the improving effect of the two substances was generally observed in breads obtained from low- or medium-strength flours.
Consistently with the specific volume, breads supplemented with xylanase and ascorbic acid had the lowest and highest loaf height, respectively (Figure 2); the correlation coefficient of the specific volume was equal to 0.971 with the minimum loaf height and equal to 0.988 with the maximum loaf height. These data should be considered together with the loaf shape. As can be inferred from Figure 1, the control bread and those supplemented with gluten, lecithin, and gluten+lecithin had a regular shape with the highest point corresponding to the central part of the loaf. The shape of bread with ascorbic acid was also regular but slightly flatter than the others and, therefore, with a minimal difference between the highest and lowest points. The formulation with xylanase gave breads poorly developed and slightly concave in shape. The bread produced with ascorbic acid and lecithin showed an irregular shape with a partially collapsed portion to highlight the absence of synergistic effects of the two improvers when added to a strong flour contrary to what was reported by El Halal et al. [2018] in the case of using a common soft wheat flour.
Figure 2
Structural characteristics of breads with and without improvers: (A) crumb specific volume, (B) slice height (minimum and maximum), (C) average pore size, (D) pore density, (E) porosity, and (F) pore circularity. Different letters above bars indicate significant differences at p<0.01. B_control, bread without improvers; B_glu, bread with gluten (replacing 2% of flour, w/w); B_lec, bread soy lecithin (1% of flour, w/w); B_xyl, bread with xylanase (0.01% of flour, w/w); B_asc, bread with ascorbic acid (0.02% of flour, w/w); B_asc_lec bread with ascorbic acid and soy lecithin (0.02% and 1% of flour, w/w, respectively); B_glu_lec bread with gluten and soy lecithin (2% and 1% of flour, w/w, respectively).
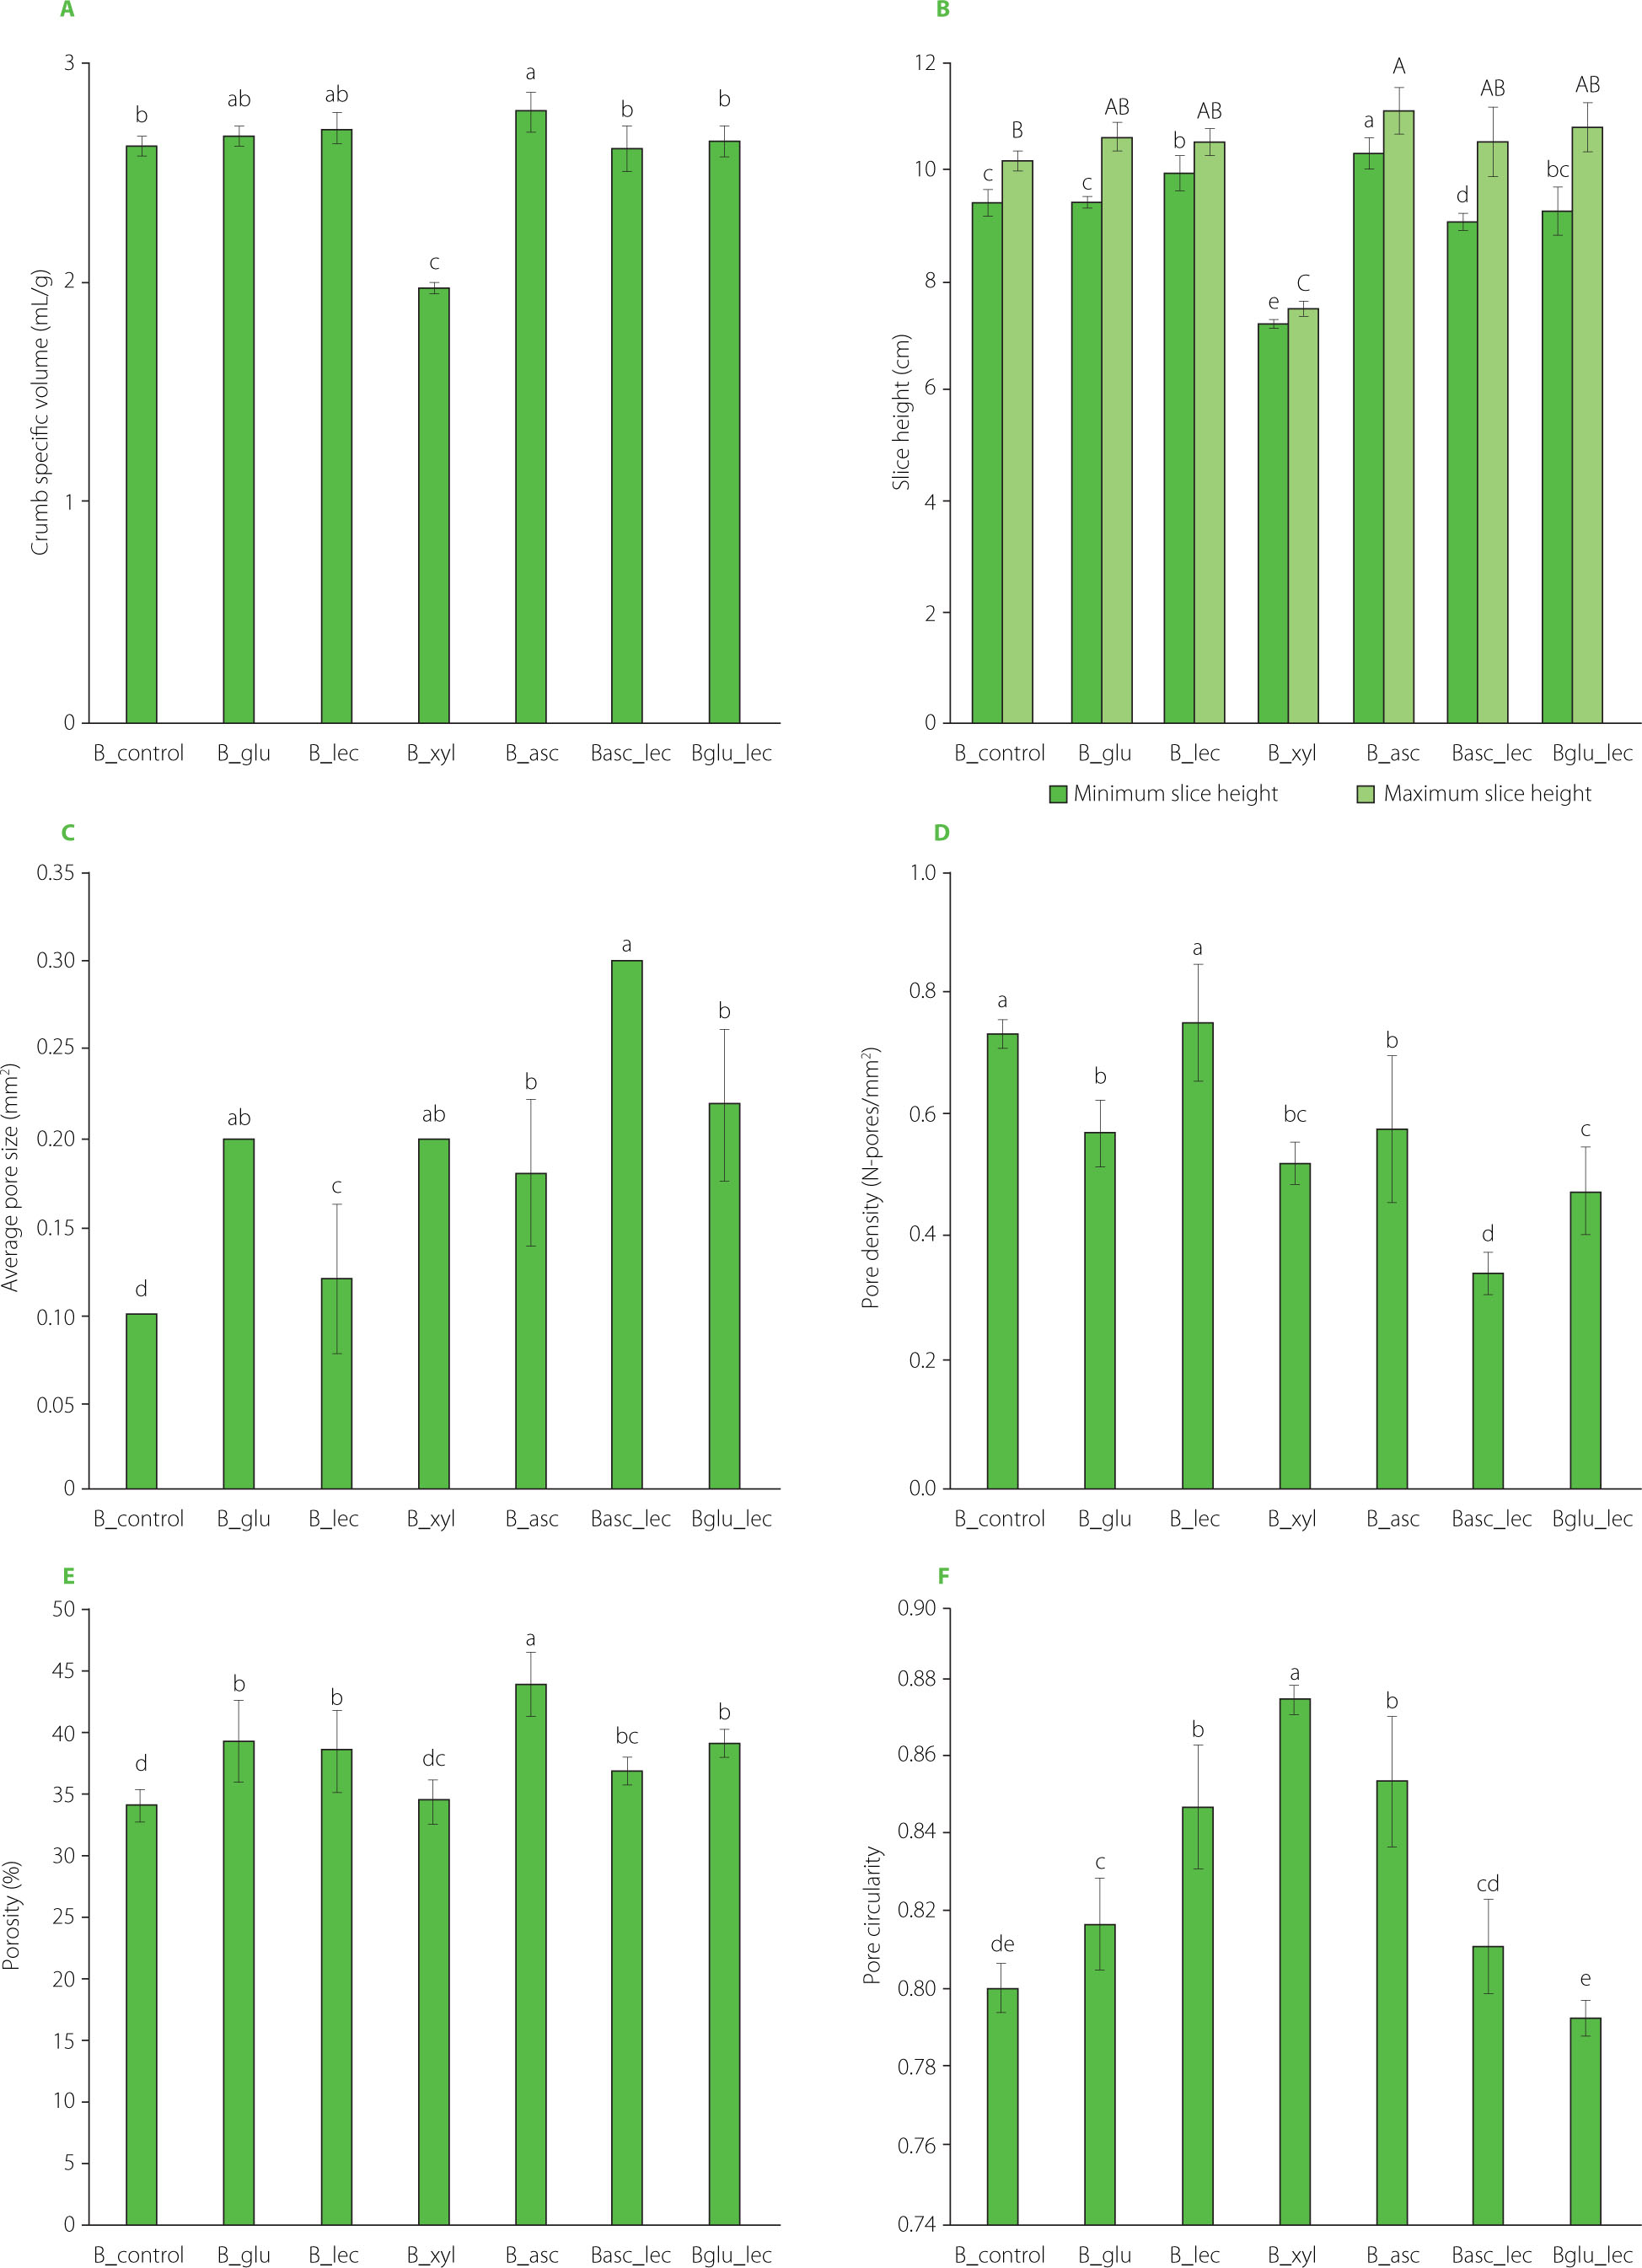
The results concerning pore density and average pore size (Figure 2) must be discussed together since they highlighted a significantly high negative correlation (r=−0.983). Pore size is generally considered as an index of structural damage, with large size related to a weak gluten network or to an extended damage of the gluten skeletal framework of pore walls [Polaki et al., 2010]. Based on this statement, it would be expected to find larger pore sizes in poorly developed loaves. Instead, in our research, the correlation between pore size and specific volume at a r=−0.134 was insignificant (p<0.01). The control bread showed the most compact crumb, having the lowest pore size paired with the highest number of pores per mm2. Compared to the control, lecithin did not improve the bread structure probably because of its addition to a strong flour. When added to a common wheat flour, lecithin determines the formation of a higher number of smaller pores [Garzón et al., 2018]. The bread with ascorbic acid+lecithin showed a lower number of larger pores because ascorbic acid strengthens the gluten network increasing the gas structure-retaining ability, while lecithin increases dough extensibility, thus allowing the expansion of carbon dioxide.
Porosity represents a measure of the incidence of the void space (pores) on the total loaf volume and was, therefore, quite well correlated with the specific volume (r=0.623). Its values ranged from 34.93% for the control bread to 45.09% for the bread supplemented with ascorbic acid (Figure 2).
In general, pore circularity is considered another attribute able to highlight structural damages. It is generally accepted that fresh breads have ellipsoidal pore shapes while the pores of damaged structures appear rounder because of the destruction of the gluten skeletal framework of pore walls [Polaki et al., 2010]. Our research partially confirmed this finding, since the formulations including xylanase gave breads with the roundest pores, but the more elongated pores were observed in bread with gluten+lecithin and in the control bread but not in breads supplemented with ascorbic acid or lecithin, as expected (Figure 2). The value of the correlation coefficient (r=−0.523) objectively quantified this behaviour.
Sensorial properties
Although a high specific volume and a uniform pore distribution are among the priority requirements in a bread loaf due to their close relationship with crumb firmness, the choice of the improver must rely not only on structural features but also on visual, olfactory and gustatory characteristics since they determine the overall sensorial quality and, finally, improvers can enhance some quality parameters but make others worse [Tebben et al., 2022]. The results of the sensorial evaluation are listed in Table 4.
Table 4
Sensorial characteristics of breads with and without improvers.
[i] Results are shown as mean ± standard deviation. In line, different letters indicate significant differences at p<0.01. B_control, bread without improvers; B_gluten, bread with gluten (replacing 2% of flour, w/w); B_lecithin, bread soy lecithin (1% of flour, w/w); B_xylanase, bread with xylanase (0.01% of flour, w/w); B_ascorbic acid, bread with ascorbic acid (0.02% of flour, w/w); B_asc_lec bread with ascorbic acid and soy lecithin (0.02% and 1% of flour, w/w, respectively); B_glu_lec bread with gluten and soy lecithin (2% and 1% of flour, w/w, respectively).
The colour of crust was affected only by the addition of xylanase that made it darker (Table 2). Moreover, the visual colour evaluation (Table 4) was highly and negatively correlated with the instrumental measurement of lightness (r=−0.796). Similarly, only the addition of xylanase affected the sensorial evaluation of crust thickness by increasing it, consistently with the crust % (r=0.609). Except for the breads supplemented with gluten or lecithin, the addition of improvers significantly changed crumb colour with respect to the control, showing the following increasing colour intensity: ascorbic acid < xylanase < ascorbic acid+lecithin < gluten+lecithin. The visual crumb colour was positively correlated with the instrumental b* values (r=0.649).
The human perception of crumb pore size (Table 4) was not correlated with its objective evaluation performed through the image analysis technique, but it was highly correlated with the specific volume (r=−0.953), with the smallest and the largest pores visually detected in bread supplemented with gluten and xylanase, respectively. Crumb development, whose lowest score was attributed to the bread supplemented with xylanase, was negatively correlated with crust % (r=−0.680) and positively correlated with the specific volume (r=0.724).
There are few studies, generally rather dated, focused on the influence of the interactions between flour components and baking improvers on bread flavour, which is known for its remarkable influence on consumer choices. Umelo et al. [2014] evaluated the effects of different improvers/techniques (ascorbic acid, ethylene dough conditioner, egg, azodicarbonamide, and screw thread kneading) on the bread sensory properties and observed that the highest score was assigned to the flavour of bread supplemented with an egg improver as a consequence of the greater extent of Maillard reaction. A study on the effects of five bread improvers (four lipase enzymes and diacetyl tartaric esters of mono-glycerides (DATEM) emulsifier) highlighted the absence of significant differences among the samples for soapy flavour intensities, overall flavour desirability and undesirable aromas [Moayedallaie et al., 2010]. In our study, lecithin was able to maximize the overall flavour intensity when used alone (Table 4), probably because the binding of flavours to emulsifier molecules facilitated the aroma retention, while it minimized the score when combined with gluten [Li et al., 2016]. The highest score for the freshly baked bread flavour was assigned to the control bread and to that supplemented with gluten while the formulation containing xylanase gave a less fragrant bread. Concerning the consumer choice, the freshly baked bread flavour is just one of the most preferred [Oručević Žuljević & Spaho, 2024]. All the improvers were able to increase the wheat flavour but with higher intensity in bread supplemented with xylanase or with ascorbic acid+lecithin. The yeast flavour intensity was greatly enhanced by the combination of ascorbic acid and lecithin. The ability of ascorbic acid to enhance the bread flavour profiles thanks to its oxidation preventing potential. Finally, malty and toasty flavours were weakly perceived in all breads.
With reference to the bread taste, the supplementation with xylanase was able to maximize sweetness and saltiness of bread (Table 4), because of the increased content of the corresponding compounds in a lower volume as highlighted by the negative correlation coefficients between specific volume and sweetness (r=–0.703) or saltiness (r=−0.754). The sourness taste was weakly perceived in all the samples without statistically significant differences (p≥0.01).
Concerning bread texture, the supplementation with lecithin or with ascorbic acid reduced the crust hardness, while the addition of xylanase or ascorbic acid+lecithin or gluten+lecithin increased it with respect to the control bread (Table 4). A close relationship was highlighted between hardness and moisture content (r=0.897), probably due to the formation of a glassy state. Always taking the control bread as reference, the crust crispiness was increased only by the addition of gluten to the formulation. All the other improvers exerted a detrimental effect on this feature, with the bread supplemented with lecithin showing the softest crust. Analogously to the crust hardness, the addition of xylanase or ascorbic acid+lecithin or gluten+lecithin increased the crumb resistance to chewing with respect to the control bread. The resistance to chewing was negatively correlated with pore density (r=−0.730) and positively correlated with pore size (r=0.667), indicating the influence of the crumb alveolation on its chewing behaviour, i.e., showing that the greater pore size could be an indicator of its hardness. All breads showed high scores for cohesiveness (7.0–8.0) but within this narrow range, the lowest and the highest values were attributed to xylanase and ascorbic acid-supplemented breads, which is consistent with findings reported by Sarabhai et al. [2021] and Gujral et al. [2003]. At the same time, the crumb stickiness was low for all samples (0.0–1.5), and the highest values were attributed to xylanase and ascorbic acid-supplemented breads. Moreover, cohesiveness and stickiness increased with the increase of the specific volume (r=0.705 and r=0.724, respectively) and of porosity % (r=0.861 and r=0.806, respectively). None of the samples showed a grainy consistency (scores between 0.0 and 0.5).
Finally, all breads obtained high scores (from 6.0 to 8.00) for the overall sensory quality, with the lowest value assigned to the bread supplemented with xylanase (Table 4). The differences among the other samples were not statistically significant (p≥0.01). The overall sensory score positively correlated with ash content (r=0.630), brightness of crust and crumb (r=0.793 and r=0.845, respectively), loaf development evaluated instrumentally with the specific volume (0.893) and sensorially as crumb development (r=0.677), freshly baked and malty aroma (r=0.891 and r=0.609, respectively). Instead, it was negatively correlated with pore circularity (r=−0.785), crust thickness (r=−0.725), crumb pore size (r=−0.922), wheat aroma (r=−0.692), and crumb saltiness (r=−0.597). The negative correlation between the overall sensory quality and pore circularity was not in agreement with the findings of Naumenko et al. [2017], who stated that round-shaped pores enhance the customer appeal. It should be considered that elongated pores evoke the irregular porous structure of homemade breads and their typicality and authenticity.
Principal component analysis
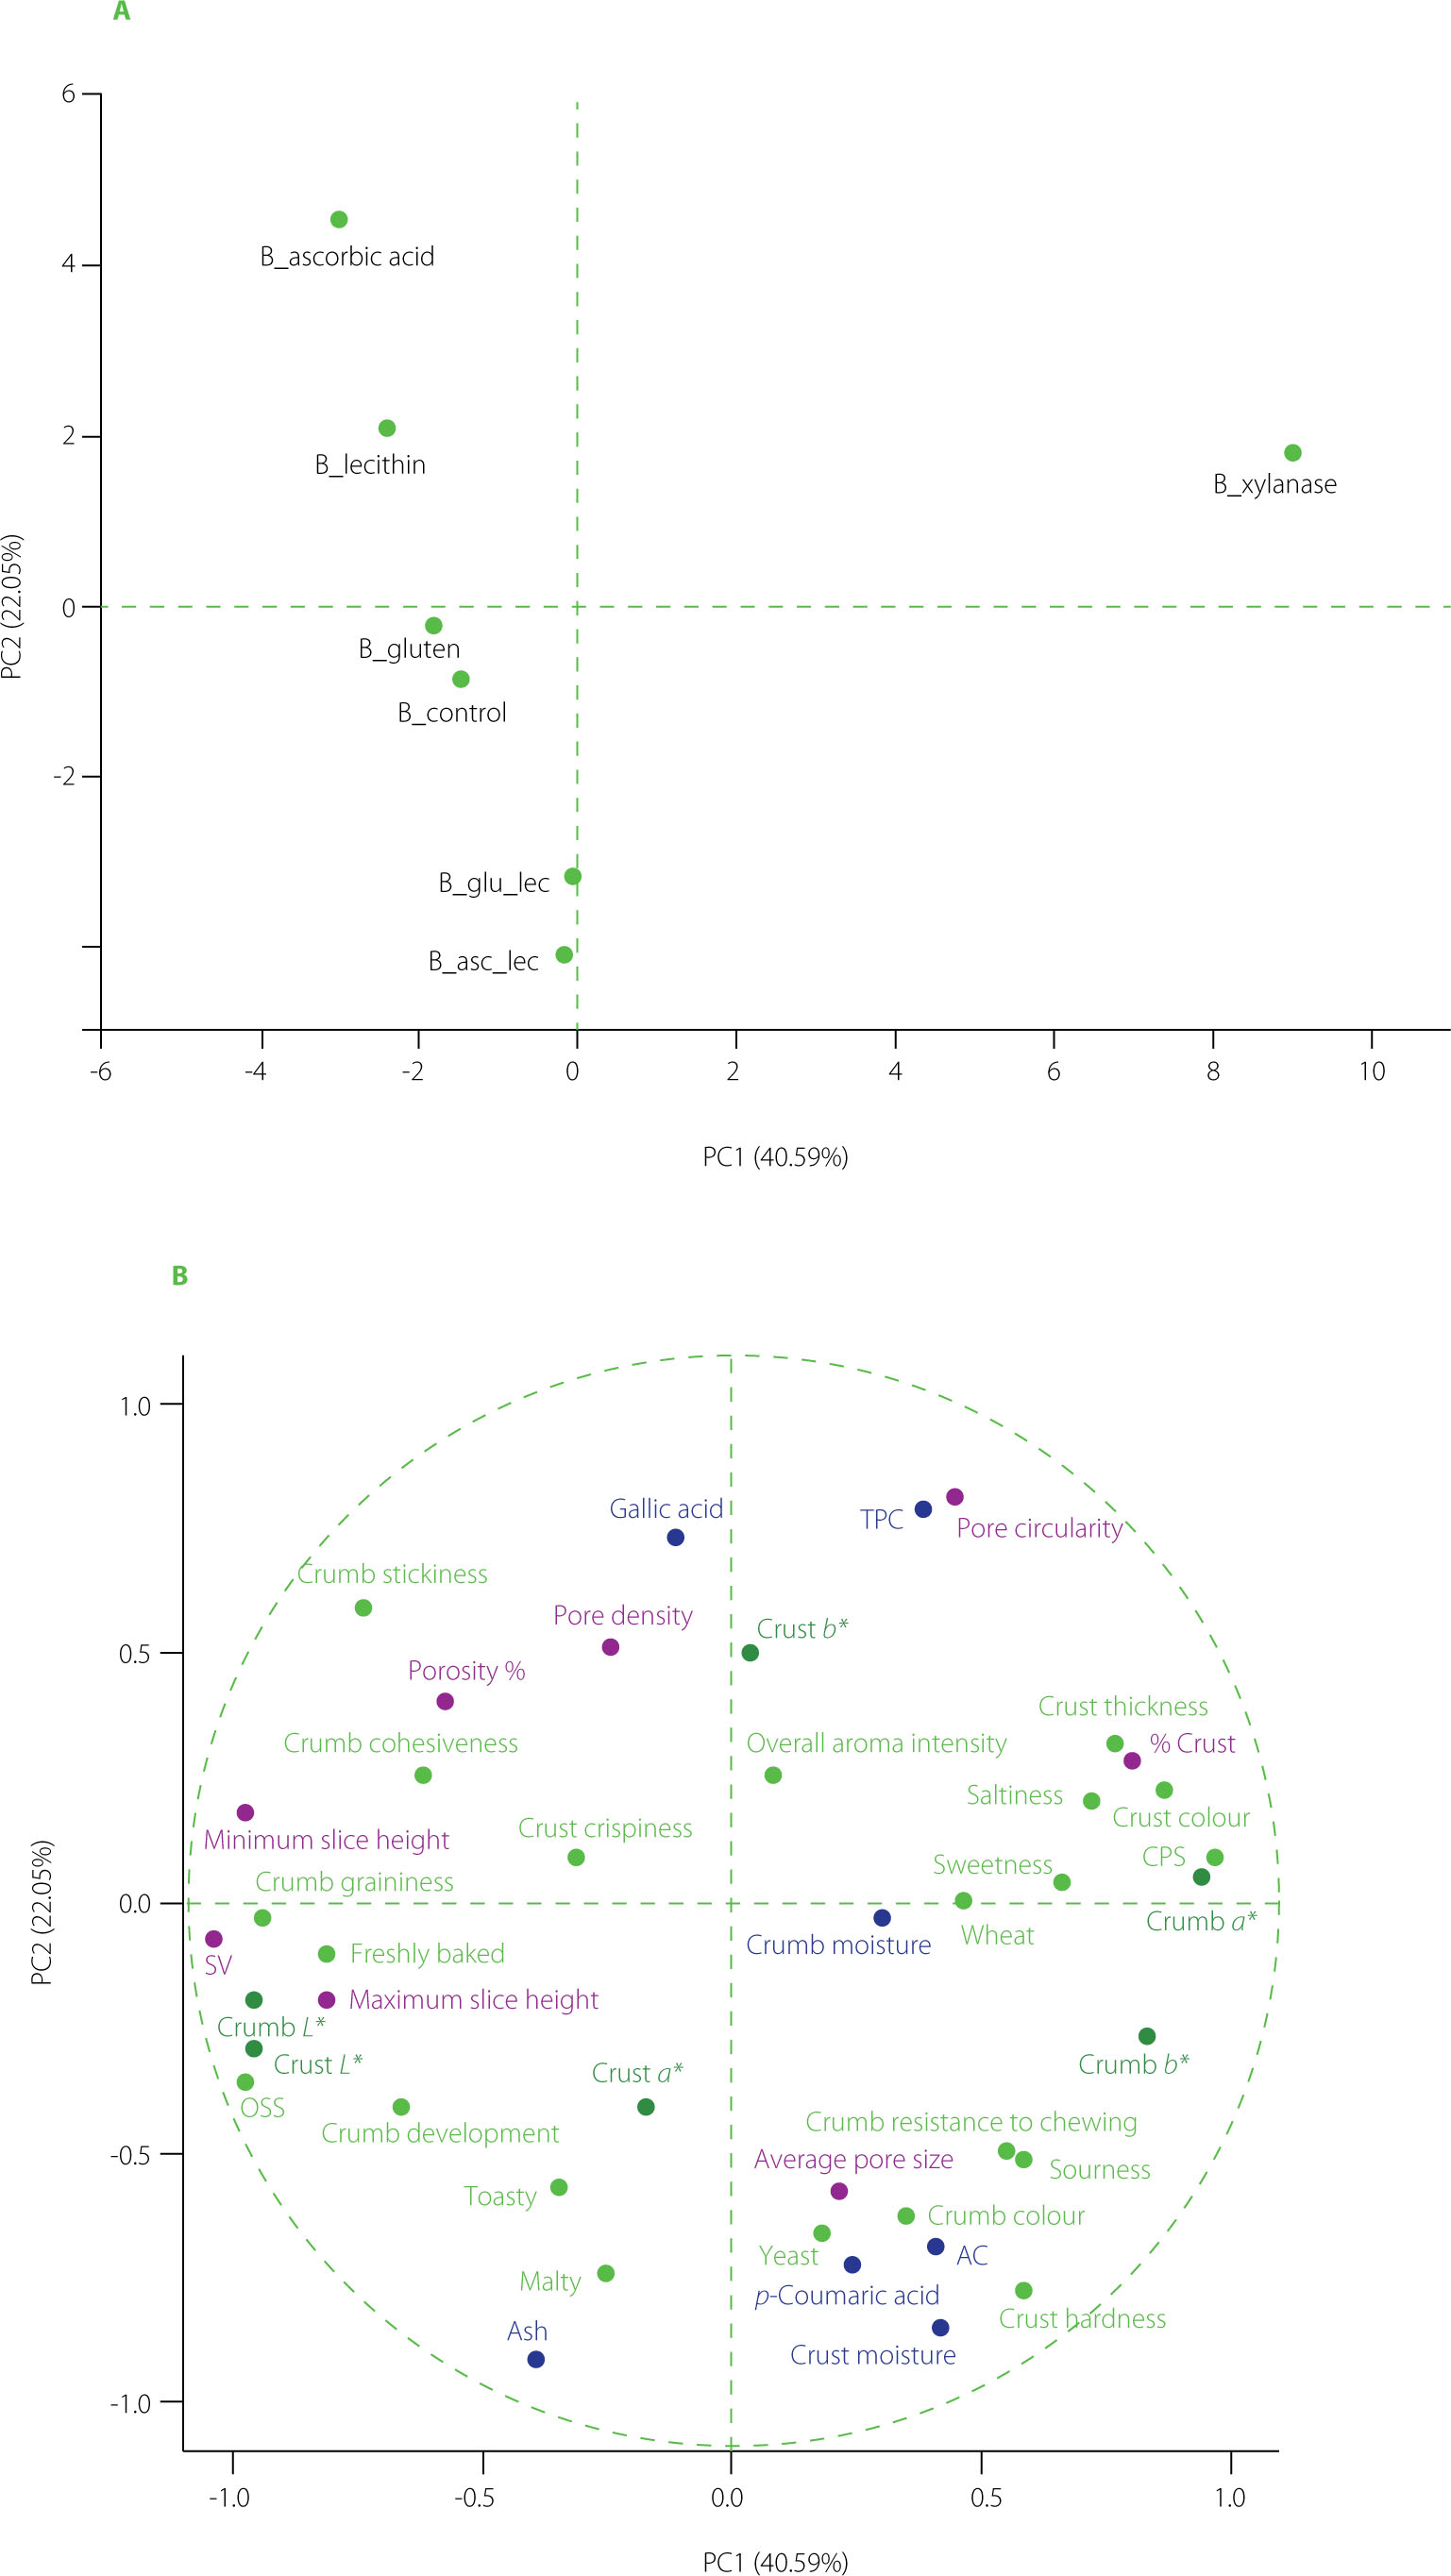
The results of the multivariate analysis (Figure 3A and B) summarize the analytical description of the supplemented breads. The first two principal components (PC) explained 62.64% of the total variance. The bread with xylanase differed from all the others since it is located in the quadrant characterised by positive scores of PC1 (~9) and PC2 (~2). It was characterised by high values of crumb a*, crust thickness, average pore size, saltiness, sweetness, and wheat aroma. The other supplemented breads and the control bread are placed in the part of the factorial plane characterised by values of PC1 between 0 and −3 and values of PC2 depending on the bread type. More in depth, the breads made with combinations of lecithin and gluten, or lecithin and ascorbic acid are close to each other and were characterised by high values of crust a*, crumb development, and toasty aroma. The control bread and the bread supplemented with gluten are close to each other and have intermediate specific volume and high freshly baked aroma. Bread with lecithin, characterised by low crust crispiness, and bread with ascorbic acid, having a high total phenolic content, high crumb stickiness and cohesiveness, are in isolated positions in the plane. The bread supplemented with xylanase clearly stands out from all the others for its already lowest loaf development, intensity of the freshly baked bread flavour, and cohesiveness, and its highest saltiness, crust hardness, and crumb resistance to chewing which, in turn, significantly reduced its overall sensory score.
Figure 3
Principal component analysis (PCA) plots of breads: projection of samples (A) and variables (B). B_control, bread without improvers; B_gluten, bread with gluten (replacing 2% of flour, w/w); B_lecithin, bread s oy lecithin (1% of flour, w/w); B_xylanase, bread with xylanase (0.01% of flour, w/w); B_ascorbic acid, bread with ascorbic acid (0.02% of flour, w/w); B_asc_lec bread with ascorbic acid and soy lecithin (0.02% and 1% of flour, w/w, respectively); B_glu_lec bread with gluten and soy lecithin (2% and 1% of flour, w/w, respectively). Physical data are in dark green, structural data are in purple, sensorial data are in light green, and chemical data are in navy blue font. AC, antioxidant capacity; CPS, crumb pore size; OSS, overall sensory score; SP, specific volume; TPC, total phenolic content.
CONCLUSIONS
Improvers used in our study exerted unexpected effects on the characteristics of bread produced with a strong flour. Ascorbic acid allowed reaching the greatest specific volume, together with the highest scores for cohesiveness and stickiness.The highest overall sensory scores were assigned to the control bread and to that supplemented with gluten, probably as a consequence of their high specific volume and the highest intensity of freshly baked bread flavour. The total phenolic content (higher in the breads whose formulations contained xylanase or ascorbic acid) was not correlated with the antioxidant capacity (higher in the control bread and in that supplemented with ascorbic acid+lecithin). Except for antioxidant capacity, the use of two improvers together (ascorbic acid+lecithin, or gluten+lecithin) almost never exerted synergistic effects on bread quality, since they did not determine an improvement in quality parameters compared to the samples in which they were used alone. The sensory evaluation of texture strongly depended on specific volume and crumb characteristics (number and size of pores, porosity, and pore circularity).
According to the experimental data, the best improvers that can be conveniently added to a strong flour are those that influence the bread structural characteristics (increasing its volume and alveolation) because of their significant correlation with positive sensory aspects.