INTRODUCTION
Cannabis sativa L. var. sativa is one of the oldest cultivated plants in the world, while cannabinoids are one of the most essential bioactive substances of its plants [Kanabus et al., 2021]. The most common cannabinoids include Δ9-tetrahydrocannabinol (Δ9-THC), cannabidiol (CBD), cannabigerol (CBG), and their acid forms [Aizpurua-Olaizola et al., 2014; Pellati et al., 2018], and can be found in both the inflorescences and the leaves [Knezevic et al., 2021], i.e., the parts of the plant where epidermal outgrowths called glandular trichomes are formed, which serve for the bio-synthesis and storage of these compounds [Xie et al., 2023]. In contrast, they are found in trace amounts in the seeds [Kanabus et al., 2021]. The interest in hemp seeds as food to date has been mainly due to their high contents of protein (>20 g/100 g) and essential amino acids, and their unique and ideally balanced fatty acid composition (25–35 g/100 g) [Farinon et al., 2020]. A potential benefit from consuming both the inflorescences and leaves of the C. sativa plant is the delivery of the canna-binoids to the body. When supplied to the body in adequate doses, cannabinoids exhibit many positive actions to support its functioning. The most important effects are analgesic, sedative, anti-anxiety, and anticonvulsant ones [Baker et al., 2003]. One of the more interesting suggestions for the possible use of the dried extracts from this plant is to apply it as an ingredient in herbal teas or to add it to cakes or dairy products [Das et al., 2022; Kanabus et al., 2021]. However, due to very high psychoactive activity of cannabinoids, it was necessary to regulate their content in food, including in particular their most active representative, i.e., total Δ9-THC, the maximum content of which in the dry matter of the plant has been set below 0.3% according the European Union (EU) Commission Regulation No. 2023/915 [Regulation EU 2023/915].
The cannabinoid content depends not only on the part of the plant, but also on its chemotypes, development stage [Aizpurua-Olaizola et al., 2016; Ubeed et al., 2022], growth conditions (temperature, fertilization, humidity) [Park et al., 2022], and post-harvest treatments such as drying [Das et al., 2022]. Bioactive compounds are usually degraded during processing at elevated temperatures. It is known that acidic cannabinoids are decarboxylated by heating (even at ≥30°C) [Meija et al., 2022; Wang et al., 2016] or by the action of enzymes (e.g., CBDA synthase) in the plant to produce CBDA from CBGA [Kanabus et al., 2021]. However, there is little information on changes in the cannabinoid profile under the influence of the drying process. Determining the thermal stability of cannabinoids is important for handling plants and selecting the method of drying or processing of C. sativa plant parts for food production [Meija et al., 2022]. Fresh fiber hemp is usually harvested at a high initial moisture content (MC) (usually 80 g/100 g) and should be dried to a safe MC value (10 g/100 g) to prevent the development of harmful microflora [Kwaśnica et al., 2020]. The most common drying method is drying on hangers or trays. This process takes place at 15–20°C and lasts between 3 and 10 days. The structure of the hemp plant restricts airflow near the inflorescences, which can result in mold growth.
The drying of agricultural products is a complex process that involves heat and mass exchange phenomena, and can cause physical, chemical, and biochemical modifications [Addo et al., 2023; Kwaśnica et al., 2020]. Both traditional drying (with or without light at ambient temperature) and hot air-drying are widely used for various plant materials. The heat and moisture exchange rate during the hot air-drying is significantly better than natural air-drying due to forced air convection [Chen et al., 2021]. Convective drying at 40–60°C usually does not adversely affect the quality of the dried material. Still, the long drying time of this process does not guarantee the high quality of the dried plant material [Esfandi et al., 2024]. Freeze-drying is one of the latest methods used to dry plant material. It involves dehydration by sublimation and surface desorption of the frozen product. Freeze-dried products retain nutrients, bioactivity, and color compared to traditionally-dried products [Addo et al., 2023; Kiani et al., 2018]. By operating at low temperatures, freeze-drying potentially reduces the loss of bioactive compounds, thereby ensuring a higher-quality of the dried products [Challa et al., 2021].
The objective of the present study was to compare the profiles of cannabinoids of C. sativa var. sativa dried using different methods, including freeze-drying; drying at 20°C for 10 days; and convective drying at 50, 60, and 70°C to obtain MC of 10±1 g/100 g.
MATERIALS AND METHODS
Chemicals and reagents
The certified reference materials (CRMs) including cannabidiol (CBD), cannabidiolic acid (CBDA), cannabigerol (CBG), cannabichromene (CBC), cannabinol (CBN), cannabinolic acid (CBNA), cannabidivarinic acid (CBDVA), cannabicyclol (CBL), and cannabicyclic acid (CBLA) were purchased as solutions at the concentration of 1.0 mg/mL in methanol (MeOH) or acetonitrile (ACN) from Restek GmbH (Bad Homburg, Germany). Cannabigerolic acid (CBGA), cannabichromenic acid (CBCA), Δ9-tetrahydrocannabinol (Δ9-THC), Δ8-tetrahydrocannabinol (Δ8-THC), Δ9-tetrahydrocannabinolic acid A (Δ9-THCA-A), Δ9-tetra-hydrocannabivarinic acid (Δ9-THCVA), and cannabidivarin (CBDV) were provided by LGC Standards (Teddington, UK). The solution of Δ9-tetrahydrocannabivarin (Δ9-THCV) in MeOH (1.0 mg/mL) was obtained from Cerilliant Corporation (Round Rock, TX, USA). The CRMs had a certified purity value of >98.00%. Quality control material (QCM) HEMP-1 in ground hemp form (National Research Council Canada) was used for validation. Solvents of purity for liquid chromatography-mass spectrometry (LC-MS) analysis of water, ACN, and MeOH were purchased from Witko (Łódź, Poland), whereas HCOOH and HCO2NH4 (LC-MS grade) were purchased from Sigma Aldrich (St. Louis, MO, USA).
Plant material
The Cannabis sativa L. var. sativa ‘Białobrzeskie’ plants were selected for analysis. This variety has a documented history of human consumption and has been used for years for CBD extraction. Plants were obtained from the Institute of Natural Fibres and Herbaceous Plants in Poznań, located in Pętkowo, Poland (52°12’32’’N 17°15’17’’E). They were harvested at the peak of flowering, specifically between twenty days after the start of flowering and ten days after the end of flowering [Regulation EU 2017/1155]. After harvesting, the plants were divided according to the size of the inflorescences (small (<10 cm), medium (10–20 cm), and large (>20 cm)). Then, the inflorescences (S, M and B groups, respectively) and leaves (L) were collected, and the remaining plant parts (roots and stems) were removed. The samples were then frozen and stored at −60°C.
Drying methods
The drying conditions were chosen based on the usual conditions for this plant material type and the literature [Kwaśnica et al., 2020; Thamkaew et al., 2021]. Each time, the drying process was carried out to achieve MC of approximately 10±1 g/100 g. The drying of the samples was carried out in triplicate, and the sample weight was 50±0.2 g each time. The traditional drying of fresh plant material was carried out on thin blotting paper in a ventilated room without light, with low air humidity (52±2%) [Das et al., 2022]. The ambient temperature in the room was 20±2°C. The moisture content of the samples was checked every 24 h during 10 days. The freeze-drying of frozen samples (−60°C) was performed at 25°C for 24 h in the Alpha 1-4 LSC plus lyo-philizer unit (Martin Christ Gefriertrocknungsanlagen GmbH, Osterode am Harz, Germany). A KBC G-100/250 laboratory dryer (Warsaw, Poland) with natural air circulation was used to carry out convective drying at 50, 60, and 70°C, and the temperature was checked each time for uniform process conditions. Sample weights were recorded every 1 h for the first 12 h. After obtaining MC of 10 g/100 g, all dried samples were ground into a fine powder using a Grindomix GM200 grinder (Retsch, Haan, Germany) and stored until analyzed.
Preparation of extracts
Samples of both fresh and dried hemp material (0.1 g) were extracted using MeOH (fresh material – 5 mL, dried material – 2×10 mL) at 25±1°C for 2 min. Mixtures of solids in solvent were homogenized (2 min, 5000 rpm) using a Unidrive X 1000 homogenizer (CAT Scientific Inc., Paso Robles, CA, USA) and then centrifuged (2 min; 10,000×g) using an MPW-380R centrifuge (MPW Med. Instruments, Warsaw, Poland). Sample preparation procedure was described in detail in our previous publication [Kanabus et al., 2023]. The extracts were filtered through a 0.22 μm (13 mm filter diameter) syringe filter (LLG Labware, Meckenheim, Germany) and directly subjected to cannabinoid analysis.
Determination of cannabinoids
Identification and quantification of the cannabinoids were performed using an ultra-high-performance liquid chromatography-Q-Exactive Orbitrap mass spectrometry setup operating with a heated electrospray interface (UHPLC-HESI-MS) (Thermo Fisher Scientific, Waltham, MA, USA). Chromatographic separation was performed using a 2.1×100 mm, C18 Cortecs, 1.6 μm column (Waters, Milford, MA, USA). The mobile phase used in the isocratic mode (0.3 mL/min, 10 min) was a mixture of ACN and an aqueous 0.02% HCOOH and 5 mM HCO2NH4 solution (75:25, v/v). Chromatographic and spectral data and spectrometer operation parameters were described in detail in our previous work [Kanabus et al., 2023].
Standard solutions of all 17 cannabinoids with the concentration of 100 μg/mL were prepared by dissolving 1.0 mL of the compound reference standard in ACN or MeOH using 10-mL volumetric flasks separately. This step was repeated as it was necessary to prepare higher dilutions for most compounds except CBD and CBDA. All solutions were stored at −80°C. Calibration curves in the relevant ranges for the compound were generated using Thermo TraceFinderTM software, version 5.1 (Thermo Fisher Scientific, Pleasanton, CA, USA).
Validation of the method was described in detail in our previous publication [Kanabus et al., 2023]. To confirm and maintain the method’s validity, a Certified Reference Material (HEMP-1) analysis was performed for each series of cannabinoid analyses (unpublished data). The recoveries achieved were within the 80–120% target range and fulfilled the guidelines included in ICH 2005 and AOAC 2002 [Kanabus et al., 2023].
The cannabinoid content was determined using a WPS 30S balance dryer (Radwag, Radom, Poland), and respective results were expressed on a dry matter basis (mg/g DM). In addition, total Δ9-THC content was calculated Δ9-THC and Δ9-THCA-A following Equation (1) [Regulation EU 2023/915]:
Statistical analysis
Data were analyzed statistically using Statistica 13 software (Statsoft, Carlsbad, CA, USA). A one-way analysis of variance (one-way ANOVA) was used to determine significant differences (p<0.01) between the mean contents of individual cannabinoids and their sum in the fresh plant material and dried using different methods. The homogeneity of the groups was determined using the Tukey’s honestly significant difference (HSD) test.
RESULTS AND DISCUSSION
This study discusses the effect of selected drying methods on the stability of 17 cannabinoids (listed in M&M - Chemicals and reagents) found in the Cannabis sativa L. var. sativa ‘Biało-brzeskie’ plant. The chromatographic and spectral data used to identify these compounds were presented in our previous study [Kanabus et al., 2023]. The conditions of the drying methods and the time required to obtain the MC of the samples at the level of 10 g/100 g are presented in the Supplementary Materials (Table S1). The contents of individual cannabinoids and their sums in fresh inflorescences and leaves, and after their drying by the chosen methods are presented in Table 1 and Figures 1–4. The paper also presents results of determinations of the total Δ9-THC content, which was designed to represent the sum of Δ9-THC and Δ9-THCA-A equivalents in a given product [Regulation EU 2023/915].
Table 1
Cannabinoid content (mg/g dry matter) of fresh Cannabis sativa L. var. sativa small (S), medium (M) and large (B) inflorescences and leaves (L) and after their drying by selected methods.
[i] Results are shown as mean ± standard deviation (n=3). Values in the rows marked with different letters (a–f) differ significantly (p<0.01). Values in the columns (separately for each compound) marked with different letters (A–D) differ significantly (p<0.01). LOD, limit of detection. The full names of the compounds are listed in the “Chemicals and reagents”subsection.
Figure 1
Changes in the cannabinoid profile during traditional drying (20°C, 10 days, without access to light) of Cannabis sativa L. var. sativa small (S), medium (M) and large (B) inflorescences. Values marked with different letters (a–f for S, A–F for M, α–ζ for B inflorescences) differ significantly (p<0.01). The full names of the compounds are listed in the “Chemicals and reagents” subsection.
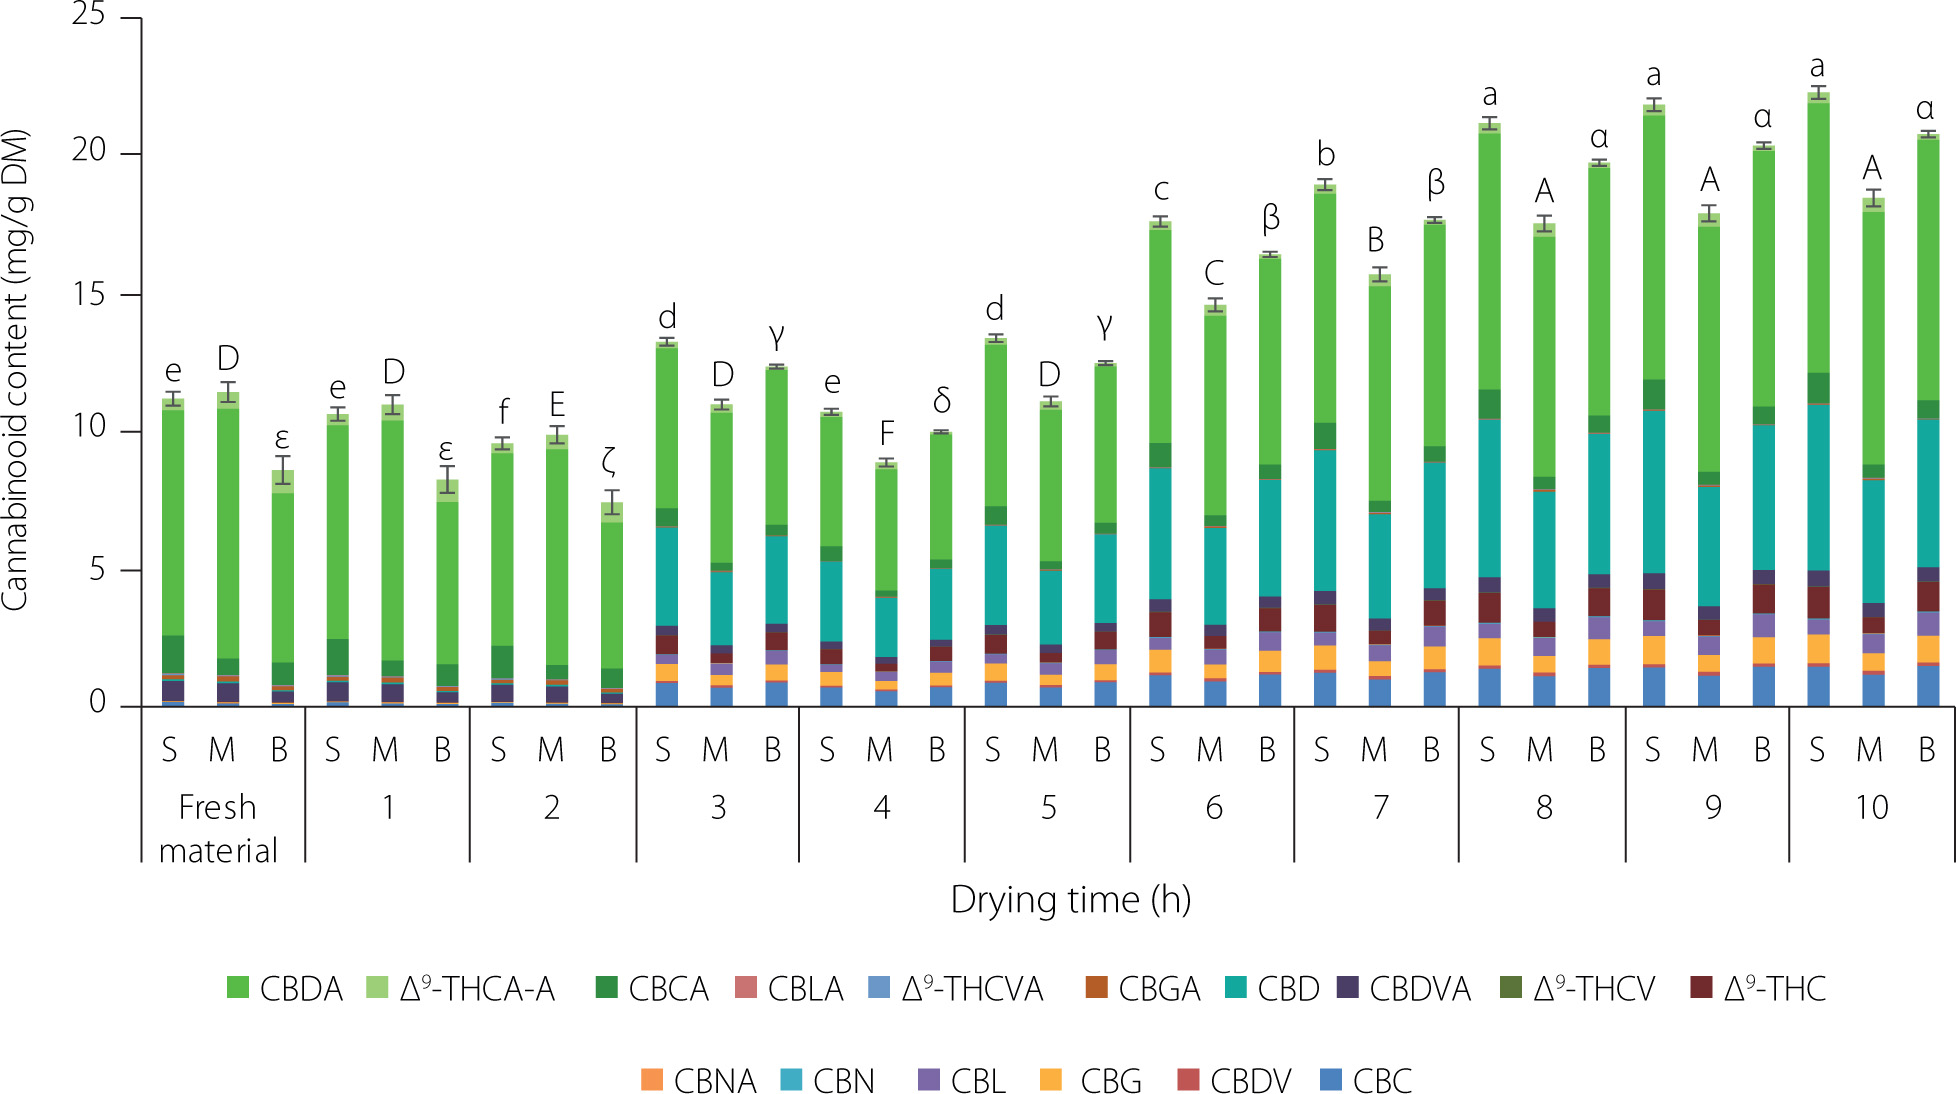
Figure 2
Changes in the cannabinoid profile during traditional drying (20°C, 10 days, without access to light) of Cannabis sativa L. var. sativa leaves. Values marked with different letters (a–i) differ significantly (p<0.01). The full names of the compounds are listed in the “Chemicals and reagents” subsection.
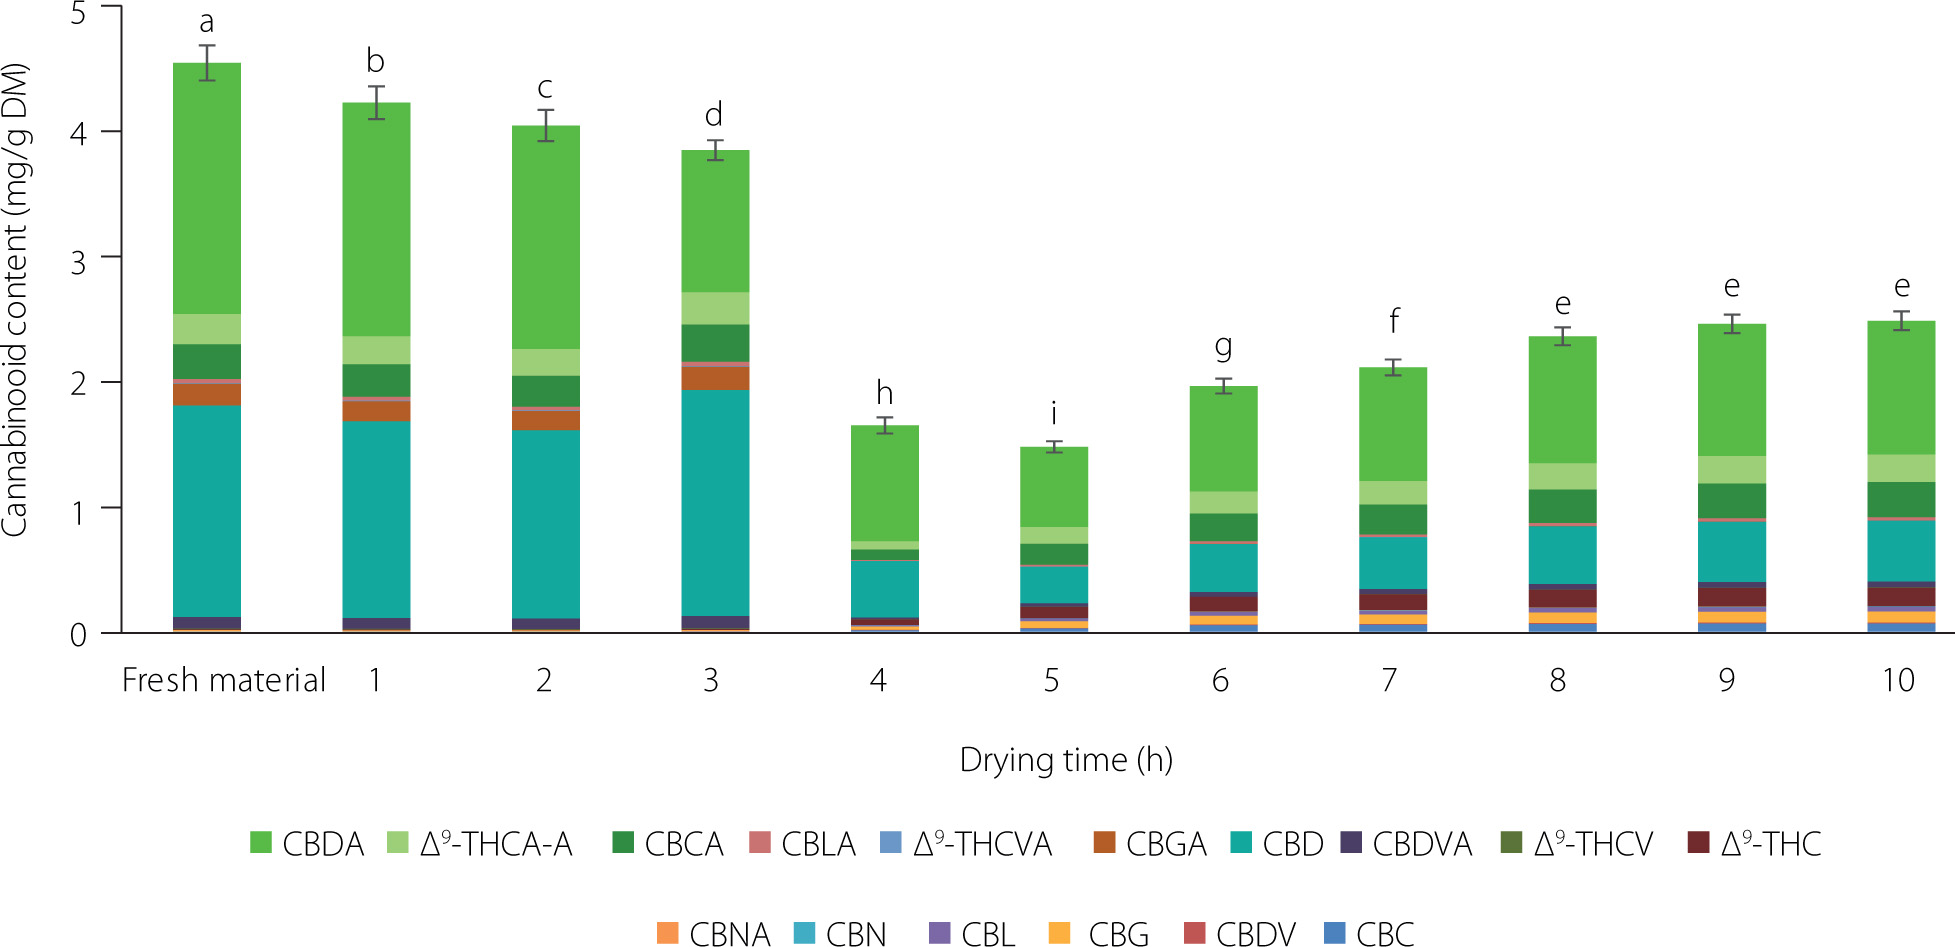
Figure 3
Changes in the cannabinoid profile during convective drying at 50°C (A), 60°C (B), and 70°C (C) of Cannabis sativa L. var. sativa small (S), medium (M) and large (B) inflorescences. Values marked with different letters (a–c for S, A–C for M, α–δ for B inflorescences) differ significantly (p<0.01). The full names of the compounds are listed in the “Chemicals and reagents” subsection.
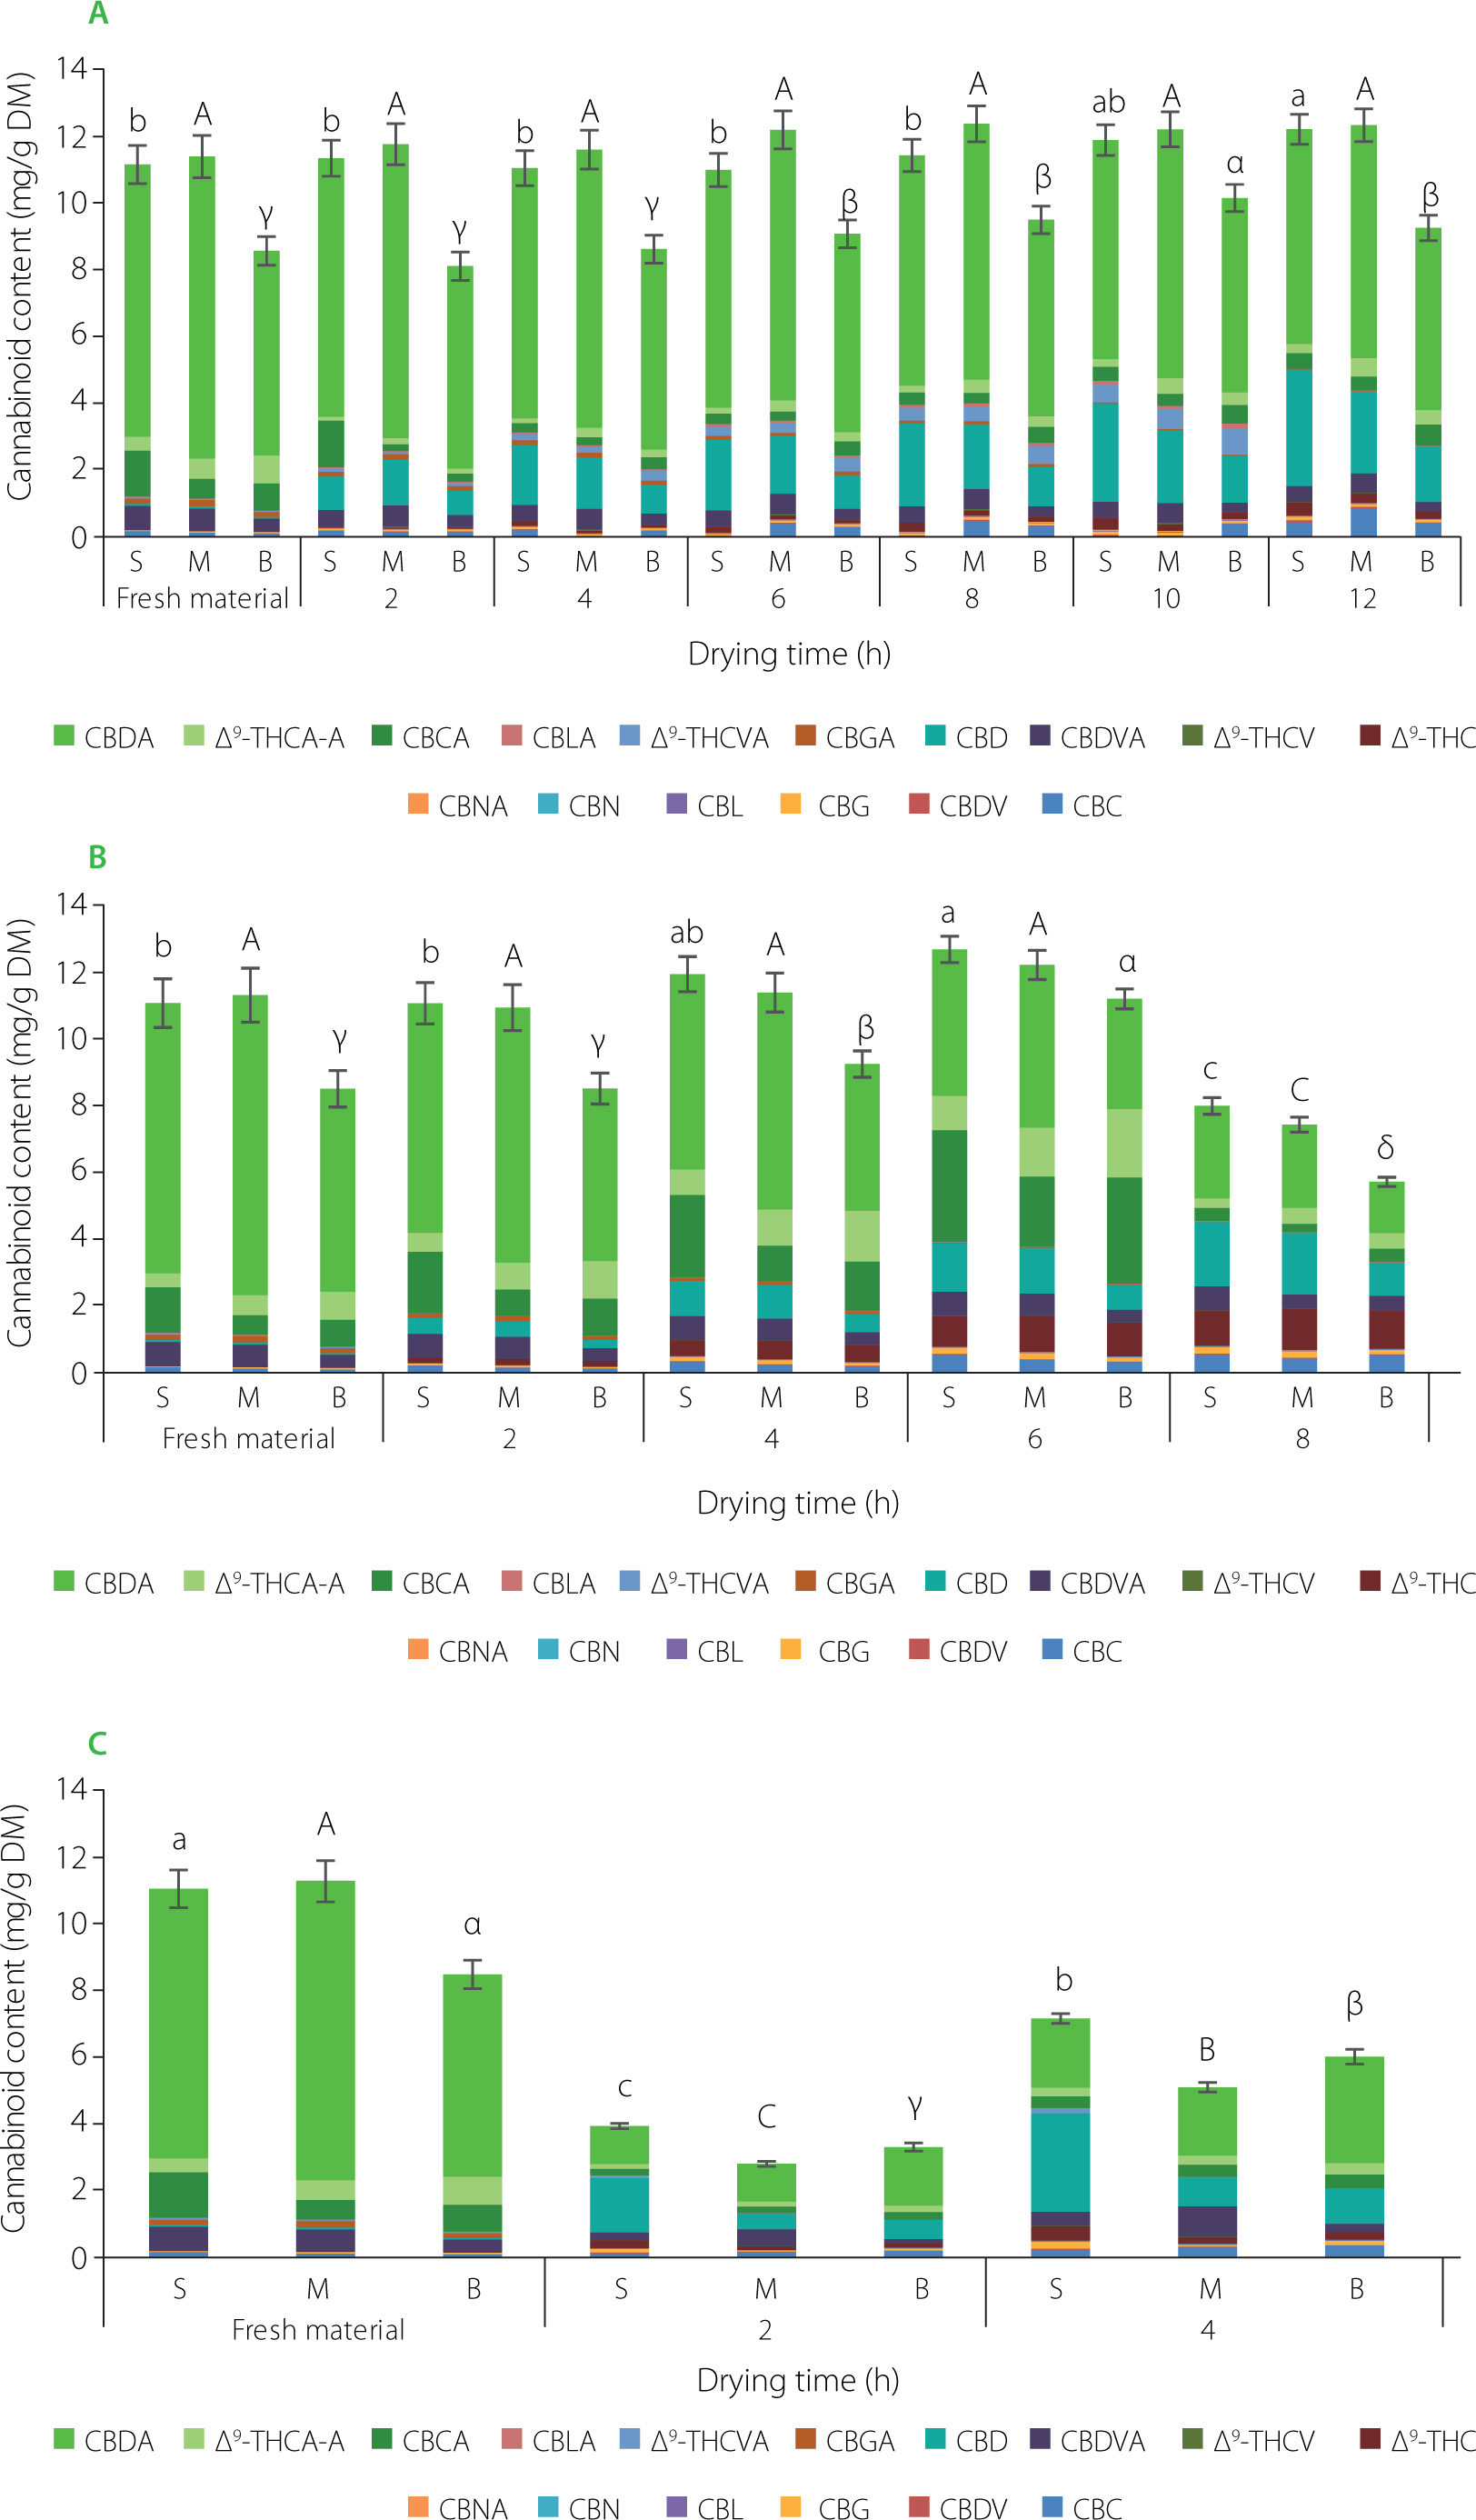
Figure 4
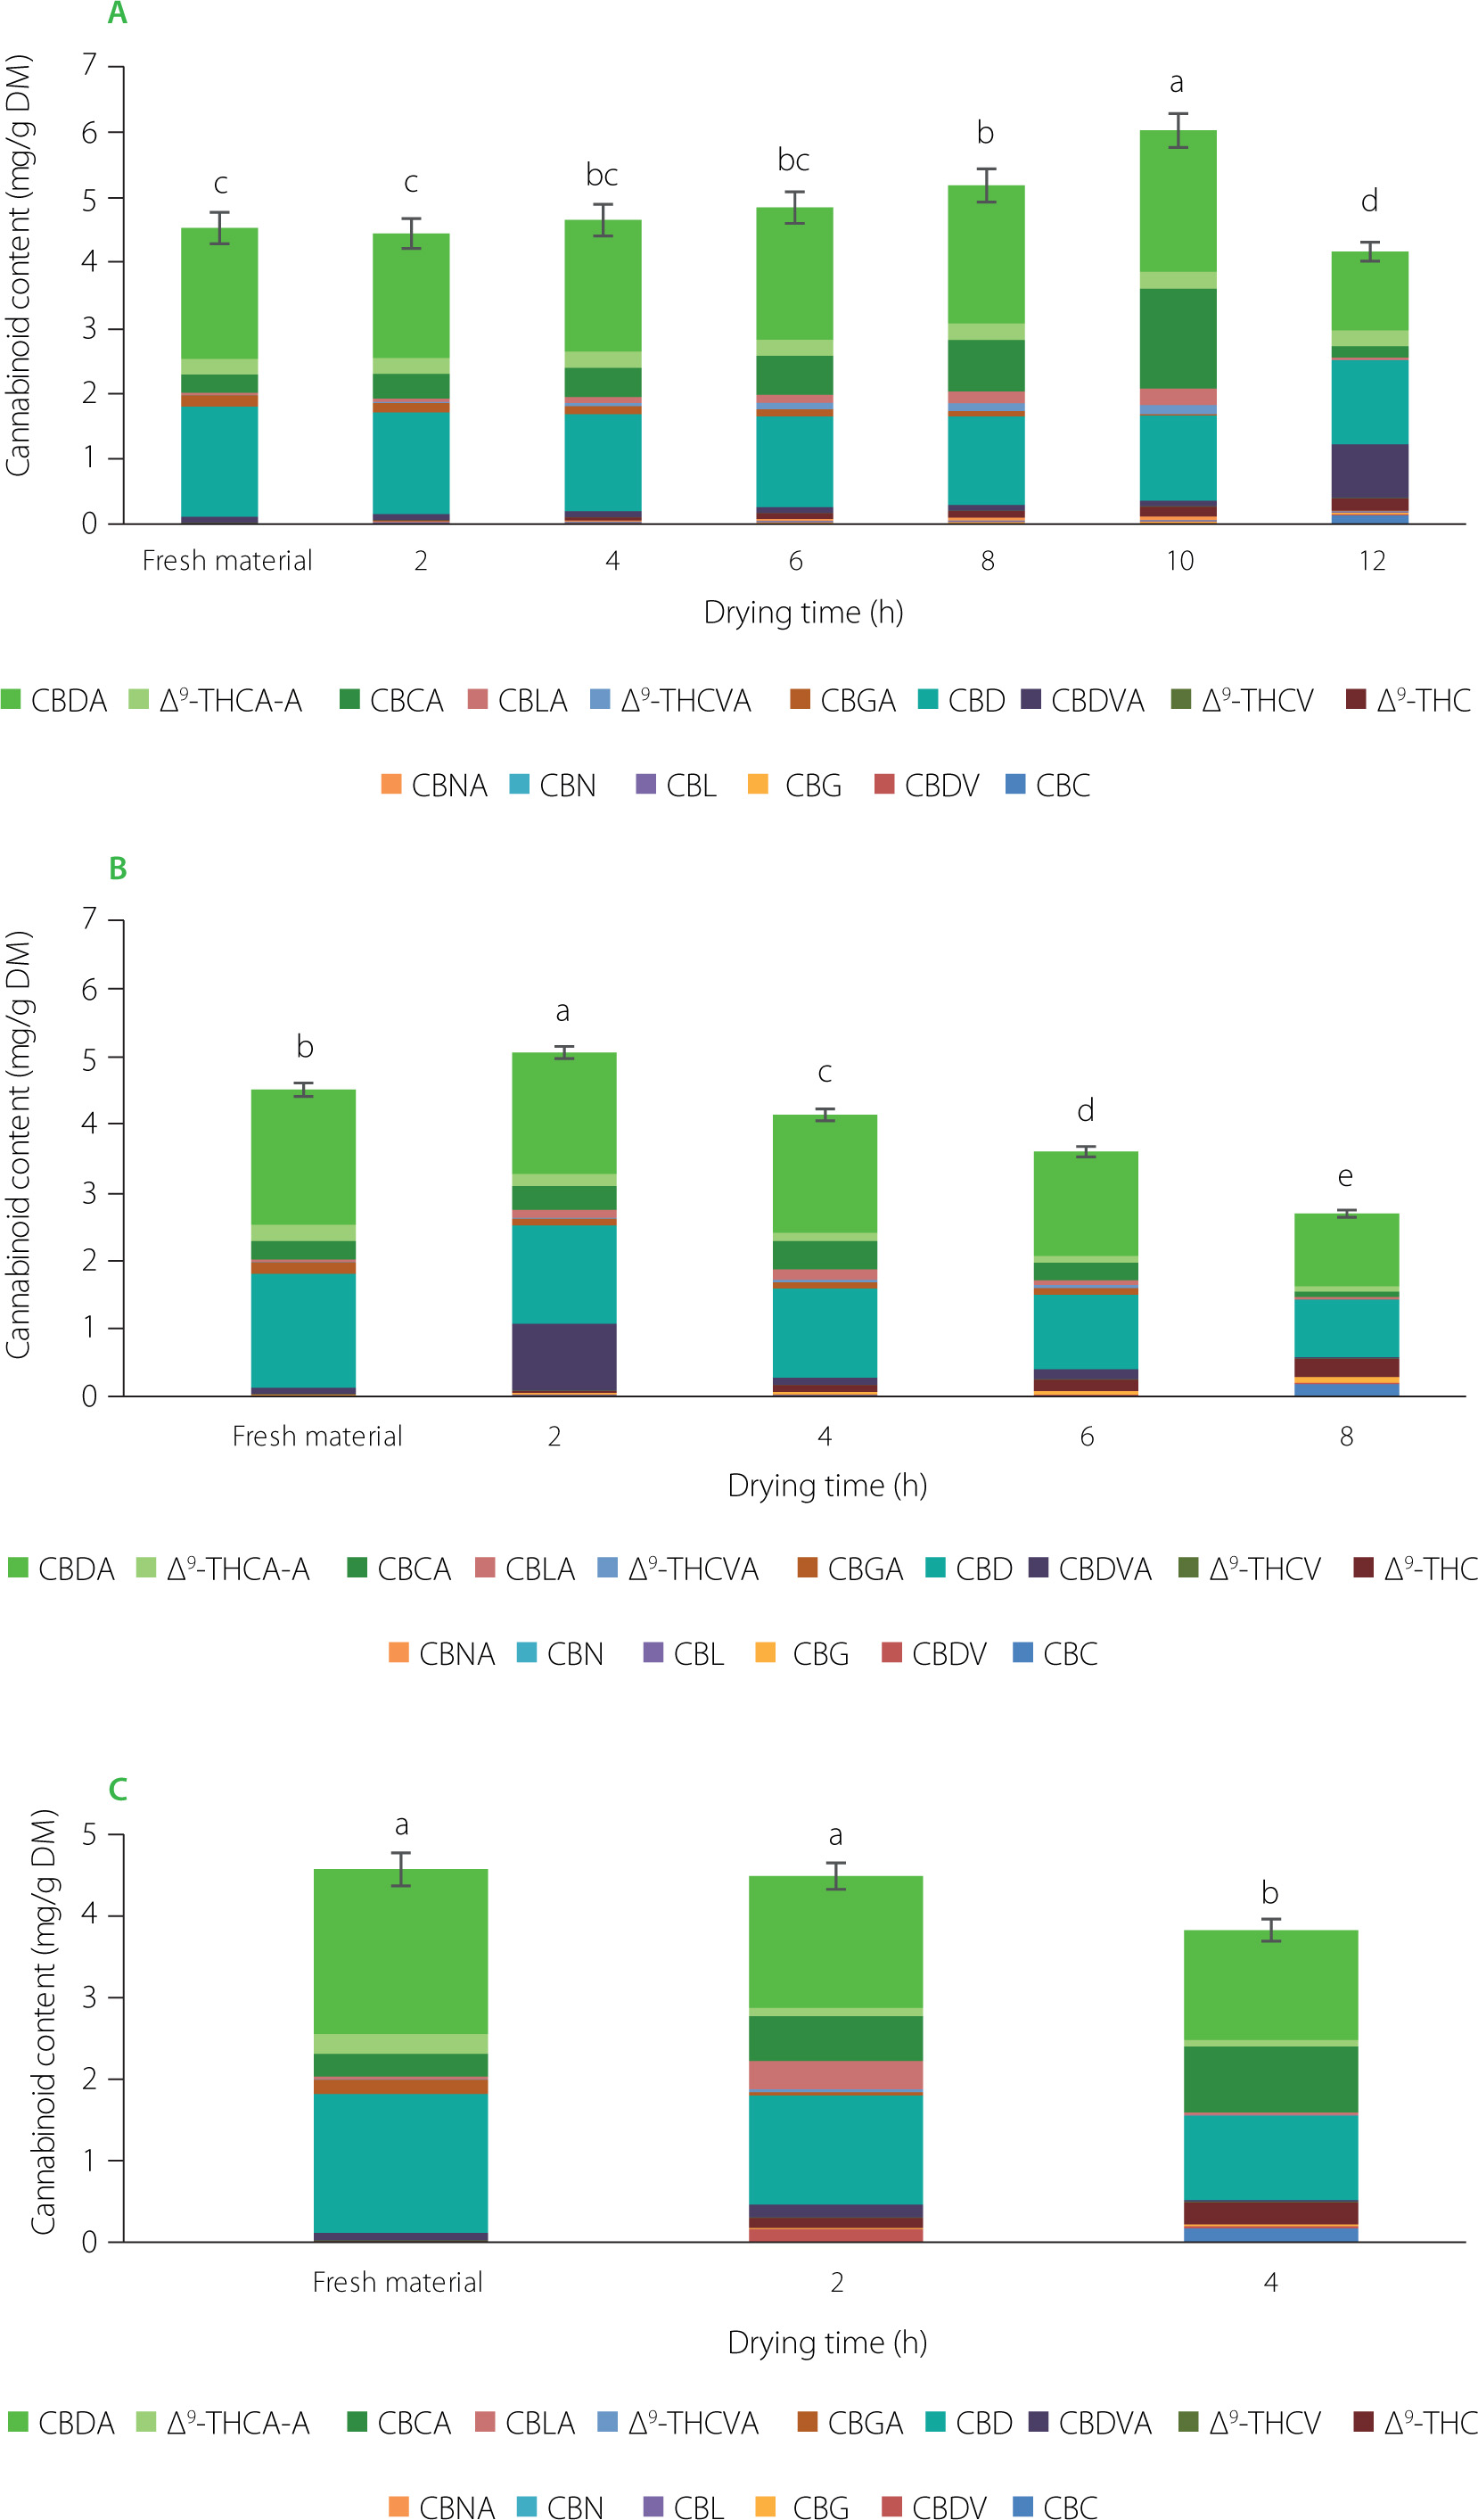
Changes in the cannabinoid profile during convective drying at 50°C (A), 60°C (B), and 70°C (C) of Cannabis sativa L. var. sativa leaves. Values marked with different letters (a–e) differ significantly (p<0.01). The full names of the compounds are listed in the “Chemicals and reagents” subsection.
Effect of drying method on total cannabinoid content
The total cannabinoid content determined in the fresh material ranged from 4.516 mg/g DM (leaves) to 11.386 mg/g DM (medium inflorescences) (Table 1). Freeze-drying and convective drying at low temperature (50°C) allowed the preservation of the total content of cannabinoids except for the medium-sized inflorescences. In contrast, inflorescences dried at 60 and 70°C contained less (p<0.01) total cannabinoids than the fresh material. In general, the higher the drying temperature was, the lower was the content of the total cannabinoids in inflorescences. For leaves, a significantly (p<0.01) lower total cannabinoid content was determined in the samples dried via all methods compared to that in the fresh material. Among dried leaves, those obtained by convective drying (50°C and 70°C) had the highest content of total cannabinoids (3.062–3.418 mg/g DM). Compared to the fresh material, the cannabinoid content of leaves dried by traditional drying and freeze-drying decreased around 1.8-fold. The differences in the total cannabinoid content of materials obtained by different methods may result from the different thermal stability of individual cannabinoids and from possible conversions between them, primarily non-enzymatic decarboxylation of acidic cannabinoids to their neutral forms and isomeric forms occurring under the influence of heating and aging [García-Valverde et al., 2022; Grafström et al., 2016; Meija et al., 2022; Wang et al., 2016]. The effects of each drying method used in our study on individual cannabinoid contents were described below in separate subsections concerning drying at ambient temperature, freeze-drying, and convective drying.
Effect of traditional drying on cannabinoid profile
The total content of cannabinoids in the inflorescences decreased slightly during the initial period of the process, reaching a minimum value after 2 (small and large inflorescences) or 4 (medium inflorescences) days of drying, and then began to increase successively until the 10th day (Figure 1). In the case of leaves, the decrease in the total content lasted longer, until the 5th day of drying, and was definitely greater (more than 2-fold), whereas the further increase was less spectacular than in the case of inflorescences (Figure 2). The highest increase, up to 100-fold, in the content after traditional drying was determined for CBC, CBG, CBD, and Δ9-THC (Table 1). The content of CBD increased the most and the final content of this compound in inflorescences ranged from 4.443 to 5.348 mg/g DM. The Δ9-THC content during drying of the inflorescences at 20°C increased from 0.012–0.017 mg/g DM to 0.576–1.136 mg/g DM. The main acidic cannabinoids in the fresh samples were CBDA, CBCA, CBDVA, and Δ9-THCA-A. The content of the Δ9-THC precursor, Δ9-tetrahydrocannabinolic acid (Δ9-THCA-A), in fresh inflorescences ranged from 0.420–0.840 mg/g DM and decreased after 10 days of drying at ambient temperature (0.279–0-500 mg/g DM). A decrease was also recorded in the contents of CBCA and CBDVA in inflorescences as well as CBDVA and CBDA in leaves. Our study results were in line with those of Esfandi et al. [2024], who dried parts of the C. sativa L. plant at ambient temperature without light. These authors compared changes in CBD and Δ9-THC contents in fresh and dried material and showed successively more than 7-fold and 10-fold increases in the content of these compounds after drying. A higher Δ9-THC content in traditionally dried inflorescences compared to the fresh material was also reported by Uziel et al. [2024]. In turn, Das et al. [2024] dried hemp samples at 30°C and observed a 0.30-fold increase in Δ9-THC content. The content of Δ9-THCA-A decreased 0.25-fold relative to fresh material. Similar results were obtained in the present study, and a decrease in the content of this compound was observed as well.
In the case of C. sativa inflorescences and leaves, a decrease in CBGA content was observed compared to the fresh material, with a simultaneous increase in CBG content (Table 1). Moreover, an increase in CBDA content and a simultaneous increase in CBD content were noted in small and large inflorescences. Based on these observations, it can be assumed that CBGA was converted at 20°C by enzymes, such as cannabidiolic acid synthase, allowing the formation of CBDA and then both compounds underwent non-enzymatic decarboxylation to the neutral forms CBG and CBD. The enzymatic inter-conversion of CBGA to CBDA is well established in the biosynthesis pathway of cannabinoids during plant growth [Kim et al., 2022; Taura et al., 2007]. In turn, Meija et al. [2022] reported that decarboxylation of CBDA to CBD was likely to occur even during storage of dried inflorescences at ambient temperature.
CBL and CBN, which were absent in the fresh material (<limit of detection, LOD), were determined in the inflorescences dried at ambient temperature in the range of 0.550–0.846 mg/g DM and 0.022–0.033 mg/g DM, respectively; for the leaves, the values were lower at 0.037 mg/g DM and 0.004 mg/g DM (Table 1). The Δ8-THC was not determined in any of the samples analyzed.
After 10 days of drying at 20°C without light, the total Δ9-THC content was 1.478, 1.015, and 1.246 mg/g DM in the small, medium and large inflorescences, respectively, and 0.341 mg/g DM in the leaves, indicating that this drying method poses no risk of exceeding the total Δ9-THC content in the dried matter of plants according to the Commission Regulation (EU), which is 0.3% [Regulation EU 2023/915].
Effect of freeze-drying on cannabinoid profile
After freeze-drying of different-sized inflorescences and leaves of C. sativa, no Δ8-THC was detected in any sample. Of all the cannabinoids identified in inflorescences of different sizes, the highest content was found for CBDA (5.450–8.490 mg/g DM), which was approximately 0.1 times lower than its content in the fresh material (6.122–9.047 mg/g DM) (Table 1). When the inflorescences were subjected to freeze-drying, the content of CBD increased from 0.045–0.066 mg/g DM to 1.149–3.890 mg/g DM (depending on the size of inflorescences). The opposite observation was noted for the leaf samples. Drying by this method resulted in a more than 16-fold decrease in CBD content, i.e., from 1.680 to 0.105 mg/g DM. Both CBN and CBL, which were not detected in the fresh plant material (<LOD), were found in the freeze-dried material (at 0.005–0.017 mg/g and 0.011–0.311 mg/g, respectively), probably due to the decarboxylation of their acidic precursors (CBNA and CBLA, respectively). In freeze-dried inflorescence and leaf samples, the total Δ9-THC content did not exceed the target level of 0.3% of plant dry matter, but its values were relatively high: 0.721 mg/g DM (small inflorescence), 0.824 mg/g DM (medium inflorescence), 0.575 mg/g DM (large inflorescence), and 0.240 mg/g DM (leaves).
Several literature reports suggest that freeze-drying retains more aromatic and bioactive compounds in dried plants than other drying methods especially those involving heating [Di Cesare et al., 2003; Thamkaew et al., 2021]. While most of the works focus on the freeze-drying of herbs, there is a lack of information on the bioactive compound profile of C. sativa individual plant parts dried using this method. One of the first studies carried out by Addo et al. [2023] reported that the freeze-drying increased the contents of CBDA, CBGA, and CBG in dried samples by up to 3-fold compared to the fresh material. The contents of the listed cannabinoids after drying were in the range of 0.380–0.450 mg/g, 2.870–4.910 mg/g, and 0.570–1.330 mg/g, respectively. In our study, the contents of the cannabinoids in question fell within the ranges of 1.863–8.490 mg/g DM, 0.002–0.071 mg/g DM, and 0.018–0.280 mg/g DM, respectively.
Effect of convective drying on cannabinoid profile
The convective drying of inflorescences of different sizes and leaves was carried out using three temperatures: 50°C, 60°C, and 70°C. The changes in the total and individual cannabinoid contents during the drying of the inflorescences and leaves are shown in Figures 3 and 4, respectively. The total cannabinoid content of the small, medium and large inflorescences dried at 70°C decreased during the initial period of the process, reaching a minimum value after 2 h of drying. In the case of drying at 50°C and 60°C, the content of cannabinoids remained similar throughout the drying period. The most significant decrease in cannabinoid content was observed in all inflorescences dried at 60°C after the 8th h of drying. In the case of leaves dried at 50°C, an increase in the total content of cannabinoids was recorded up to 10 h of drying, while a further two-hour drying under these conditions resulted in a decrease in the total content of these compounds. For leaves dried at 60°C and 70°C, cannabinoid degradation was noted after 4 h of drying. The predominant cannabinoid in the dried inflorescences in each temperature variant was CBDA (1.070–6.977 mg/g DM), the content of which decreased up to fivefold compared to the fresh material (Table 1). Convective drying at 50°C resulted in inflorescences having a significantly higher CBD content than the samples dried at the other temperatures tested. On the other hand, the convective drying of leaves at all temperatures decreased CBD content by up to half. In the dried inflorescences (all condition variants), the occurrence of CBL (0.019–0.083 mg/g DM) and CBN (0.002–0.017 mg/g DM), which were not detected in the fresh material, was observed. In contrast, in leaves, these compounds were present only in the samples dried at 50°C (0.020 and 0.003 mg/g DM, respectively). The content of CBGA in the inflorescences decreased after drying at all temperatures and was the lowest after drying at 70°C (0.002–0.006 mg/g DM). The convective drying did not affect the formation of Δ8-THC in either inflorescences or leaves. The dominant cannabinoid in leaves was CBDA, whose content was recorded at 1.328 mg/g DM after processing at 70°C. In the variant at 60°C, the final content of this compound in the dried material was significantly lower.
The convective drying at different temperatures also significantly affected the levels of Δ9-THC, Δ9-THCA-A, and total Δ9-THC in the dried samples (Table 1, Figures 3 and 4). The highest content of Δ9-THC was recorded for medium inflorescences dried at 60°C (1.230 mg/g DM). Among the dried leaves, those processed at 60 and 70°C had the highest Δ9-THC content (0.267 mg/g DM). The convective drying of inflorescences and leaves at 70°C resulted in the samples having the lowest content of Δ9-THCA-A (0.080–0.345 mg/g DM). The values of total Δ9-THC calculated for the samples dried at 50°C were in the range of 0.400–0.769 mg/g DM, for these dried at 60°C the range was 0.336–1.560 mg/g DM, and content in materials dried at 70°C ranged from 0.337 to 0.671 mg/g DM. The total Δ9-THC contents determined in all analyzed samples were within the safe limit stipulated in the Commission Regulation (EU) [Regulation EU 2023/915].
Literature data on the effect of the drying process on cannabinoid content/degradation rates indicate that levels of neutral cannabinoids increase after drying. One of the first reports on drying plant parts was presented by Turner & Mahlberg [1984], who dried leaf samples of C. sativa L. for 24 h at 37°C, at room temperature (2 weeks), and at 60°C (oven drying – 12 h). In the samples dried at both 37°C and 60°C, a 2-fold higher amount of neutral cannabinoids was recorded compared to the fresh material, indicating that the decarboxylation process was already occurring at 37°C. Chen et al. [2021] used hot air drying (40, 50, 60, 70, 90°C) and infrared drying (40 and 60°C) to dry the inflorescences of C. sativa L. var. sativa plants. They showed that increasing the ambient temperature to 90°C significantly facilitated the decarboxylation of CBDA (from 0.2% to 14.1%) and also that the use of infrared drying resulted in a higher loss of cannabinoids compared to hot air drying by 16.2% and 72.3% on average, respectively. Uziel et al. [2024] compared microwave drying of hemp with conventional drying. Microwave drying was carried out at 4 temperature variants (40, 50, 60 and 80°C). The authors showed that the use of microwaves in drying hemp significantly shortened the drying time (<4.5 h depending on the temperature used) compared to traditional drying (10 days). They also confirmed that the use of high drying temperatures in cannabis caused changes in the composition of the cannabinoids present in the dried material. The cited article showed that the highest contents of CBDA and Δ9-THCA-A decarboxylation products were determined in the samples dried at 80°C, whereas in our study – in the samples dried at 50°C. These differences may be due to the initial content of these cannabinoids and their precursors in the fresh material. As confirmed by Esfandi et al. [2024], temperature (45, 55, 65°C) as well as drying method type (drying with or without light, oven drying, vacuum drying or microwave drying) used to dry C. sativa L. samples, affect the increase in on the contents of selected cannabinoids (CBD and Δ9-THC) in the dried plant material. There are also data indicating that the drying process did not affect the cannabinoid content of the dried material. The study presented by Kwaśnica et al. [2023] compared the 50, 60, and 70°C convective method, the vacuum-microwave method, and combination thereof used to dry the leaves of C. sativa L. and showed that the drying method did not affect changes in the profile of the cannabinoids analyzed. The results we obtained and those cited above confirm the need to control the drying processes of the C. sativa L. plant parts, as there is a risk of exceeding the acceptable level of Δ9-THC in the dried samples. This poses a severe risk in terms of ensuring the safety of the food produced from the dried plants. The chosen drying process conditions may not have been sufficient to inhibit the activity/activity of the enzymes by which the precursors of the selected cannabinoids are synthesised, and thus changes in the the sum and the profile of individual cannabinoids. Acidic cannabinoids can also be synthesised. The higher temperature of the drying process results in enhanced water diffusion from the dried material, thus resulting in a shorter drying time. Intense evaporation of water from the plant material may have resulted in a lower temperature of the material (not measured during the experiment), which affected the profile of the cannabinoid compounds. In addition, a greater loss of water results in a slower rate of decarboxylation. To confirm this, it would be necessary to determine the changes/kinetics of enzymatic activity during the drying process in order to find conditions (time and water content) that cause a reduction in enzyme activity and accompanying chemical reactions.
CONCLUSIONS
The study highlights the influence of the size (small, medium, large inflorescences) and parts (inflorescences and leaves) of Cannabis sativa L. var. sativa and the effect of the drying process on the cannabinoid content of the dried materials. The use of higher temperatures, i.e., 50°C, 60°C and 70°C, made it possible to determine differences in the content changes of cannabinoids during drying. It was found that increasing the drying temperature by 10°C contributed to greater degradation of the analyzed compounds. Traditional drying resulted in dried inflorescences containing up to 2 times more of the analyzed compounds compared to the fresh material. In the case of leaf samples, drying via all methods tested resulted in a decrease in the total cannabinoid contents (up to 2-fold). Appropriately selected drying conditions of the C. sativa L. var. sativa plant parts make it possible to obtain safe (containing an acceptable total Δ9-THC content) raw material, which can be used to produce hemp-containing foods or dietary supplements.