INTRODUCTION
The demand for cereal-based products that are rich in plant-derived nutrients and bioactive compounds is currently growing. This trend is driven not only by economic and environmental considerations but also by the increasing interest in new, safe, and healthy foods [Spina et al., 2024]. Owing to their complementary amino acid profiles, legume proteins are considered excellent supplements for cereal-based foods. They represent an abundant source of lysine but lack sufficient sulfur-containing amino acids, whereas cereal proteins are rich in sulfur amino acids but deficient in lysine. This complementary relationship makes the combination of legume and cereal proteins nutritionally beneficial, enhancing the overall amino acid balance of the food. Beyond their nutritional advantages, pulse proteins possess remarkable functional properties, including solubility, gelation, and water-binding capacity, all of which play a vital role in contributing to the texture and sensory attributes of final products. Various legumes, including soybean, chickpea, pea, and lupin, have been investigated as protein-enriching ingredients in bakery products, via flours and different protein preparations such as protein concentrates and isolates [Shrestha et al., 2021; Spina et al., 2024].
Lupin has garnered worldwide interest because of its nutritional value, absence of genetic modification in commercial cultivation, enhanced sustainability, and lower costs than current production methods do [Shrestha et al., 2021]. Lupin seeds are an excellent gluten-free source of protein (29–40 g/100 g), dietary fibre (7.2–16 g/100 g), and lipids (5.5–19 g/100 g). They also provide essential minerals, including zinc, iron, and manganese, as well as vitamins such as niacin, thiamine, tocopherols, and riboflavin, along with antioxidants [Pleming et al., 2021]. Furthermore, consuming lupin is associated with numerous health benefits, including improved bowel function and reductions in cholesterol levels, blood glucose, and the glycemic index [Shrestha et al., 2021]. A limiting factor for the consumption of legumes and their products is the presence of antinutritional factors. The main antinutritional factors found in lupin are alkaloids (lupinine, lupanine, sparteine, lupinidine, hydroxylupanine), which can be removed through processes such as heat treatment or soaking lupin seeds in water [Süli et al., 2017].
These qualities position lupin as an appealing and economically viable option for the production of innovative cereal-based products [Pleming et al., 2021]. Lupin flour is made by removing the hulls from whole lupin seeds, isolating the kernels, and grinding them into a fine powder. Compared with refined wheat flour, lupin kernel flour contains approximately 40 g protein and 40 g dietary fibre per 100 g, offering a higher nutritional density and lower energy value and is characterized by its pale-yellow coloration and slight beany flavor [Pereira et al., 2024].
Previously, several authors have investigated the impact of various legume flours, such as chickpea, bean, lentil, and soybean, on the rheological properties of wheat dough as well as qualitative and sensory characteristics, and proximate composition of formulated baked goods [Belc et al., 2021; Bojňanská et al., 2021; Calderón et al., 2022; Rizvi et al., 2022]. However, only a few studies have focused on improving the nutritional composition of common bakery products by including lupin flour as a protein-rich and fibre-rich raw material [Calderón et al., 2022; Pleming et al., 2021; Plustea et al., 2022]. Therefore, the aim of the present study was to provide a comprehensive assessment of the thermomechanical behavior of wheat flour blends with different weight proportions of lupin flour (5, 10, 15, 20, and 25% substitution of wheat flour), baking performance, sensory acceptability, and nutritional characteristics of formulated baked rolls.
MATERIALS AND METHODS
Materials
Lupin flour (LF) (Sobo Naturkost, Köln, Germany), obtained from the Slovak market with a focus on healthy nutrition, contained 7.5 g of lipids, 13 g of carbohydrates, 39 g of protein, 32 g of fibre, and 0.04 g of salt per 100 g of product. Commercial fine wheat flour (marked as a control) (Mlyn Pohronský Ruskov a.s., Slovakia) (1.25 g of lipids, 74.58 g of carbohydrates, 10.37 g of protein, 2.89 g of fibre per 100 g of product) and other ingredients (vegetable oil, sugar, salt, yeast) were purchased from Slovak local markets. The nutritional information was mentioned by the manufacturer on the product’s label.
Flour blends were prepared by blending wheat flour with different portions of lupin flour at levels of 5, 10, 15, 20 and 25% by weight (LF5–LF25).
Rheological properties of dough
The rheological behavior of the dough was studied using a Mixolab 2 device (Chopin Technologies, Villeneuve-la-Garenne, France) applying the “Chopin+” protocol with a constant mixing speed of 80 rpm. An amount of 75 g of flour was used, with a target consistency (C1) of 1.1±0.05 Nm. Initially, the dough was mixed for 8 min at 30°C. The mixture was subsequently heated for 15 min at a rate of 4°C/min until it reached 90°C. The dough was maintained at 90°C for 7 min before being cooled to 50°C at a rate of 4°C/min. Finally, the mixture was mixed for 5 min at 50°C. The determined Mixolab parameters were as follows: water absorption (WA, %), dough stability (DS, min), C2 (Nm) – weakening of the protein during mechanical stress at increasing temperature, C3 (Nm) – starch gelatinization, C4 (Nm) – stability of the formed starch gel, C5 (Nm) – starch retrogradation during the cooling stage, C1–C2 (Nm) – protein network strength under increasing heating, C3–C2 (Nm) – starch gelatinization rate, C3–C4 (Nm) – amylase activity, and C5–C4 (Nm) – anti-stalling effects, which represent the shelf-life of the end products [Guardado-Félix et al., 2020].
Rolls preparation
Baked rolls were prepared according to the recipe described by Holkovičová et al. [2024]. The dough was prepared from 300 g of wheat flour/flour blends which were first dry-mixed in a farinographic mixing bowl. Next, 5.63 g of salt, 3.22 g of sugar, 7.5 g of vegetable oil and 12.06 g of yeast previously dissolved in water were added followed by the addition of water up to a farinographic consistency of 400 BU (Brabender units). After being kneaded for 6 min, the resulting dough was fermented at 27°C for 20 min. Consequently, the dough was portioned into 100 g loaves and shaped using a dough former (Extensograph Brabender, Duisburg, Germany). After the second 45-min proofing, the dough was baked at 230°C for 15 min with steam (250 mL), cooled for 2 h and packed into plastic bags.
Determination of qualitative properties of baked rolls
The qualitative parameters of the baked rolls were assessed 2 h after baking. The volume of the rolls was determined using the rapeseed displacement method. The specific volume (mL per 100 g of loaf) was established by dividing the measured volume by the weight of the rolls. The cambering of the baked rolls was determined by the ratio of the loaf’s height to its width [Minarovičová et al., 2018].
Color analysis
The color of the crumb of the baked rolls was evaluated instrumentally using a Cary 300 UV–VIS spectrophotometer (Agilent Technologies, Santa Clara, CA, USA) with a sphere diffuse reflectance accessory (DRA-CA-30I). The crumb of the baked rolls was dried and ground in a grinder mill (Model 0010, Eta, Hlinsko, Czech Republic) before analysis. The individual color values were established using CIELab. The color parameters were: L* (lightness, 0 – black, 100 – white), a* (–a* – green, +a* – red), b* (–b* – blue, +b* – yellow), chroma (C), and hue angle (h). The spectrophotometer was calibrated with a white plate [Mazumder et al., 2021]. All the determinations were carried out in five replicates, and the average value was used. The total color difference (ΔE) with respect to the control sample was calculated according to Equation (1) [Pathare et al., 2013]:
where: i represents a different level of lupin substitution, and c represents the control sample.The yellowness index (YI), whiteness index (WI), and browning index (BI) were computed following Equations (2), (3), (4) and (5) adopted from Pathare et al. [2013]:
Chemical composition analysis
The proximate analysis of the final products involved the determination of moisture according the International Association for Cereal Science and Technology (ICC) standard No. 110/1 [ICC, 1976], lipids by the Soxhlet method [Stanković et al., 2018], and ash by gravimetric method (ICC standard no. 104/1) [ICC, 1990]. The protein content was assessed as the total nitrogen content by the Kjeldahl method with a factor of 6.25 (lupin flour and flour blends) for nitrogen conversion to crude protein [Rizvi et al., 2022]. The starch content was assessed by the Ewers polarimetric method measuring optical rotation [Omar et al., 2016]. The total dietary fibre content (TDF) was determined by the enzymatic gravimetric method using the Megazyme assay kit [Lauková et al., 2019]. The results of chemical composition were expressed in g per 100 g of baked rolls. The total carbohydrate content was calculated based on the difference obtained by subtracting the sum of moisture, lipid, protein and ash content in 100 g of the baked rolls from the weight of 100 g of product.
The energy value of the products was determined by taking into account the conversion factors reported by Plustea et al. [2022], i.e., 9 for lipids and 4 for carbohydrates and proteins and expressed in kcal per 100 g of the product.
Evaluation of sensory acceptability
The baked rolls were subjected to a preliminary sensory acceptability evaluation using a 5-point hedonic scale, with the following rates: 1 – extremely dislike, 2 – slightly dislike, 3 – neither like nor dislike, 4 – slightly like, and 5 – extremely like [Plustea et al., 2022]. This initial evaluation was conducted with a small group (11 members) of semi-trained participants, including staff and students from the Faculty of Chemical and Food Technology, Slovak University of Technology, Bratislava, Slovakia. The evaluated attributes included color, flavor and taste of baked rolls, adhesiveness to palate, springiness, porosity and overall acceptability.
Statistical analysis
All analyses were performed in triplicate, with results reported as the mean and standard deviation. Analysis of variance (ANOVA) was used to identify significant differences (p<0.05, p<0.01, p<0.001). Fisher’s least significant difference (LSD) test was applied to assess the significance of differences between the control sample and samples with various levels of lupin flour. Pearson’s correlation test was used to evaluate the relationships between rheological parameters and qualitative properties of the baked rolls. Statistical analyses were performed using Statgraphics version 19 (Statsoft-Inc., The Plains, VA, USA).
RESULTS AND DISCUSSION
Rheological properties of dough
Previously it has been documented that incorporation of legume flours into wheat dough affects the viscoelastic and mixing properties of the dough. Mixolab is a rheological instrument that subjects dough to both mechanical and thermal stress, allowing for the assessment of changes in the protein-starch network under conditions that closely simulate real bakery processes [Bojňanská et al., 2021]. The Mixolab parameters of wheat flour (control sample) and flour blends with different proportions of LF are presented in Table 1.
Table 1
Mixolab parameters of wheat flour (control) and blends containing 5–25% by weight of lupin flour as a wheat flour substitute (LF5–LF25, respectively).
[i] Results are presented as mean ± standard deviation (n=3). *, **, and *** indicate a significant difference at p<0.05, p<0.01, and p<0.001, respectively, compared to control. WA, water absorption; DS, dough stability; C2, weakening of the protein during mechanical stress; C3, starch gelatinization; C4, stability of starch gel; C5, starch retrogradation; C1–C2, protein network strength; C3–C2, starch gelatinization rate; C3–C4, amylase activity; C5–C4, anti-stalling effect.
WA provides information about the percentage of water required for the dough to produce a torque of 1.1 Nm. WA significantly increased (p<0.001) with the addition of LF to flour blends from 55.00% in the case of the control to 68.05% in the flour blend containing 25% LF (Table 1). This enhancement in WA was likely attributable to the hygroscopic properties of LF, which facilitate higher water retention within the dough matrix. This phenomenon may be due to lupin’s high protein and fibre contents, which can interact with water molecules [Calderón et al., 2022]. Previously, several authors [Belc et al., 2021; Maradudin et al., 2019] confirmed an increased WA of flour blends including various legume flours (pea, soybean, bean, and chickpea) in comparison with that of wheat flour.
DS, a dough characteristic that indicates dough resistance to mixing and kneading [Manano et al., 2021], was reduced with the increasing levels of LF in the flour blends (Table 1). These findings indicate that incorporating LF disrupted the starch-protein matrix, reducing dough elasticity and leading to its weakening during prolonged mixing [Calderón et al., 2022; Kohajdová et al., 2011].
C2 and C1–C2 are parameters related to protein weakening in the second stage of Mixolab measurement. C2, which is the minimum value of torque observed after the initial mixing phase, is an indicator of the quality and stability of wheat protein network in response to thermal weakening [Plustea et al., 2022]. The combined effect of mechanical stress and increasing temperature induced a significant decrease in the C2 torque of samples from 0.53 Nm in the control to 0.43 Nm in LF25 (Table 1). Similar results as those in this study were also obtained by Maradudin et al. [2019] and Calderón et al. [2022] when bean and sweet lupin flours were incorporated into wheat dough. This indicates that the presence of LF increases protein weakening, possibly due to its interaction with gluten proteins, disrupting their network and reducing dough strength. C1–C2, reflecting the extent of protein weakening, slightly increased with increasing LF levels (Table 1). However, since there were no significant differences observed, this parameter indicates only minor initial protein weakening, likely due to the initial dilution of gluten by LF proteins.
During the third phase of Mixolab measurement, the temperature further increases from 60°C to 90°C. At this point, starch granules swell as a result of WA, which increases the viscosity of the dough and requires greater torque for mixing. Torque point C3 expresses the starch gelatinization and the viscosity of the dough during heating [Plustea et al., 2022]. Wheat flour contained more starch compared to flour blends, which gave control sample higher C3 value with a torque of 2.03 Nm (Table 1). The reduction in starch gelatinization observed with the addition of LF may be attributed to the decreased starch content in the samples or the interference of lupin components, such as fibres and proteins, with starch granule swelling, potentially hindering the gelatinization process. This phenomenon has been previously discussed in the context of similar interactions [Abdel-Samie & Abdulla, 2016].
C4 represents the torque at the end of the heating phase, indicating the extent of enzymatic activity and starch breakdown [Plustea et al., 2022]. The results suggest that as the substitution level of LF increases, consistency decreases due to enhanced amylolytic activity, leading to reduced hot gel stability. This implies that LF may either enhance amylase activity or promote starch hydrolysis, resulting in greater starch breakdown during heating. A similar pattern was observed by Maradudin et al. [2019], who reported increased starch degradation with the incorporation of bean flour. The difference between C3 and C4 is the rate of amylase activity in the dough. The greater the difference between C3 and C4, the higher the amylase activity and lower stability of hot starch paste. The lower value of this parameter (C3–C4) was recorded with the control sample, amounting to 0.18 Nm (Table 1).
The decrease in temperature during the final cooling process from 90°C to 50°C is associated with starch retrogradation. In this phase, there is an increase in dough resistance, the starch hardens, thereby increasing its consistency (C5 value) [Plustea et al., 2022]. Starch retrogradation (C5 and C5–C4) has been shown to be the primary cause of baked goods firming, and is considered as an indicator of final product shelf-life [Abdel-Samie & Abdulla, 2016]. The C5 values of samples decreased significantly, from 3.53 Nm in the control to 1.99 Nm in LF25 (Table 1). The study results indicate that the incorporation of lupin flour into baked products can prolong their shelf-life and delay their staling. This phenomenon may be attributed to the high lipid content of lupin flour, which interacts with starch amylose in the dough, reducing starch retrogradation. The complex formed between amylose and lipids is insoluble in water, preventing amylose from leaching out of starch granules, and the starch retrogradation process is delayed [Codină et al., 2019]. These results were in accordance with those reported by Calderón et al. [2022] who documented that the addition of 20% lupin flour delayed bread firming.
Qualitative parameters of baked rolls
The baking quality is primarily influenced by the physical characteristics of the baked goods, including loaf volume, specific volume, and shape retention [Rodrigues et al., 2014]. The volume of baked goods is influenced mainly by the generation and retention of gas throughout processing. The wheat dough’s unique capacity to hold gas is attributed primarily to the presence and functionality of the viscoelastic gluten network, as well as the role of water-extractable arabinoxylans. Higher loaf volumes are typically associated with better dough fermentation and gas retention properties, leading to a lighter and airier texture [Verdonck et al., 2023].
The data presented in Table 2 show that the control rolls exhibited a volume of 252.5 mL and a specific volume of 285.2 mL/100 g. In comparison, the rolls produced using flour blends enriched with more than 5% LF showed significant decreases (p<0.001) in both volume and specific volume. Michalak-Majewska et al. [2017] proposed that increasing the proportion of non-gluten flours in dough negatively affects its ability to rise and retain gas. This effect is likely due to the dilution of gluten content and the presence of fibres, which disrupt the formation of a stable gluten network.
Table 2
Qualitative parameters of baked rolls prepared using wheat flour (control) and blends containing 5–25% by weight of lupin flour as a wheat flour substitute (LF5–LF25, respectively).
Cambering, the width/height ratio of the central slice, is another crucial parameter influencing the aesthetic appeal of bread and bread-like products such as rolls and buns. Higher cambering values indicate a more desirable, arched loaf shape, whereas values between 0.60 and 0.70 are considered favourable, while values below 0.50 are deemed inadequate [Holkovičová et al., 2024]. In our study, the control rolls had a cambering value of 0.60, which was within the favourable range. However, when the LF in the roll production was used, the cambering values were significantly lower competed to the control, with LF5 at 0.54 and LF25 at 0.44 (Table 2). The observed reductions in cambering suggest that a higher LF content results in flatter loaves, likely due to a weakened gluten network and diminished gas retention capacity in LF-enriched dough. Similar findings regarding the impact of alternative flours on loaf structure and gas retention have been reported by Verdonck et al. [2023].
Instrumental color of baked rolls
Color is a critical quality attribute in baked goods, as it influences consumer perception and acceptance. A consistent and appealing color is often associated with freshness, proper baking, and high-quality ingredients [Pathare et al., 2013].
The incorporation of LF into the baked rolls resulted in significant changes in the crumb color parameters, as outlined in Table 3. The L* value, which represents lightness, decreased significantly (p<0.001) with the addition of LF, indicating that the rolls became darker. For instance, the L* value dropped from 74.94 in the control sample to 69.95 in the LF25 sample. According to Kolarič et al. [2020], acceptable values for the L* parameter are those higher than 60, suggesting that despite the darkening effect, all samples remained within the desirable range for consumer acceptability. The a* values, representing the red-green spectrum, also decreased significantly (p<0.001) with increasing levels of LF (Table 3), indicating a shift toward less red and more green. Similarly, the b* values, representing the yellow-blue spectrum, increased with higher LF content, which means that the yellow hue of the samples intensified [Atudorei et al., 2022]. These color changes were caused by the presence of natural pigments in the raw material. LF is naturally yellower than wheat flour owing to its high carotenoid content (544.78 µg/100 g), mainly lutein and zeaxanthin, which are characterized by intense yellow-orange color [Villacrés et al., 2020]. Comparable results have been reported in several studies focused on the incorporation of lupin into baked goods [Atudorei et al., 2022; Jayasena & Nasar-Abbas, 2011; Yaver & Bilgiçli, 2021].
Table 3
Color parameters of baked rolls prepared using wheat flour (control) and blends containing 5–25% by weight of lupin flour as a wheat flour substitute (LF5–LF25, respectively).
[i] Results are presented as mean ± standard deviation (n=3). *, **, and *** indicate a significant difference at p<0.05, p<0.01, and p<0.001, respectively, compared to control. L*, lightness; a*, red-green spectrum; b*, yellow-blue spectrum; C, chroma; h, hue angle; ΔE, total color difference; WI, whiteness index; YI, yellowness index; BI, browning index.
The C parameter serves as a quantitative measure of color intensity. Higher chroma values indicate greater color vividness as perceived by the human eye [Pathare et al., 2013]. LF increased the C parameter of the products (Table 3), indicating more saturated and intense colors. This is indicative of the higher pigment concentration from the LF, contributing to the overall color intensity [Villacrés et al., 2020].
The hue angle, which represents the property of the color, can vary from 0° (pure red) to 270° (pure blue), where 90° is pure yellow and 180° is pure green. In our study, the hue angle of the rolls produced using flour blends was significantly higher compared to the control (Table 3), reflecting slight shifts in the perceived color type. All the baked rolls exhibited an h value of approximately 80°, indicating their yellowish hue. This color characteristic aligns with findings reported by Mazumder et al. [2021].
ΔE represented the overall color difference compared to the control sample. The ΔE values were significantly (p<0.001) higher than zero (Table 3), indicating that the color difference between the LF-incorporated baked rolls and the control was visually noticeable. This aligns with the criteria outlined by Pathare et al. [2013], where a ΔE value exceeding the threshold is perceptible to the human eye.
The yellowness index (YI) provides a numerical measure of the extent of yellowness in a material. It characterizes color shifts from near-white opaque surfaces to yellowish tones [Yeo & Sung, 2021]. The whiteness index (WI) integrates lightness and the yellow-blue color spectrum into a single value. It reflects the overall whiteness of food products and can be used to assess discoloration occurring during processes such as drying [Pathare et al., 2013]. The addition of LF to the rolls resulted in a significant increase in the YI and a notable decrease in the WI (Table 3). Combined with the changes in L*, it can be stated that the overall color of baked rolls with LF addition ranged from bright yellow to brownish-yellow. However, the light-brown color that develops during the baking process could also be a result of the Millard reaction, the reaction between reducing sugars and amino acids [Jayasena & Nasar-Abbas, 2011]. Therefore, in our study, browning index (BI) was determined. It reflects color changes typically associated with non-enzymatic browning reactions, such as the Maillard reaction and caramelization, which occur during processing or cooking. The addition of LF led to a significant increase in BI of rolls compared to the control (Table 3). In lupin-enriched backed rolls, more Maillard reaction products could appear deepening the yellow-brown color of the products, due to the presence of free amino acids and proteins in lupin flour, which participate in this reaction. These findings align with those of Schouten et al. [2023], who reported a similar increase in BI with the addition of LF in baked goods.
The proximate composition of baked rolls
The nutritional composition of baked rolls substituted with different levels of LF is presented in Table 4. Moisture content is a crucial parameter as it affects the texture, shelf-life, and microbial stability of bread [Holkovičová et al., 2024]. It was observed that values of this parameter decreased significantly with the addition of LF, ranging from 4.86 g/100 g (LF5) to 4.43 g/100 g (LF25). The reduction in moisture content can be attributed to the high protein and fibre contents of lupin, which bind water more effectively, reducing the free moisture content in the rolls. This behavior is consistent with the findings of Kohajdová et al. [2011], who reported that the addition of legume flours resulted in a lower moisture content of baked products.
Table 4
Nutritional composition of baked rolls prepared using wheat flour (control) and blends containing 5–25% by weight of lupin flour as a wheat flour substitute (LF5–LF25, respectively).
It was determined that the baked rolls prepared from flour blends contained a higher amount of lipids, with LF25 containing up to 3 times more lipids than wheat flour baked rolls (1.41 g/100 g) (Table 4). A comparable lipid content in lupin bread (1.55 g/100 g) was also described in a study by Pereira et al. [2024]. From a nutritional point of view, unsaturated fatty acids are especially important, and represent up to 90% of the total amount of fatty acids in lupin. These are primarily oleic acid (32–50%), linoleic acid (17–47%) and linolenic acid (3–11%) [Rybiński et al., 2018].
The replacement of wheat flour with LF significantly (p<0.001) decreased the starch content in baked rolls (Table 4). As was previously documented, lupin flour contains significantly less starch than wheat flour (1–4 g/100 g vs. 70–77.1 g/100 g) [Kohajdová et al., 2011].
Ash content increased with the addition of lupin, from 0.91 g/100 g in the control to 1.59 g/100 g in the LF25 sample (Table 4). Lupin seeds are rich in essential minerals like calcium, magnesium, and potassium, which contribute to the increased ash content in the rolls [Plustea et al., 2022].
Protein content is a crucial nutritional parameter that contributes to the structure and nutritional value of bakery products. A significant increase in protein content of the rolls was observed (from 11.05 g/100 g to 12.52–19.14 g/100 g) following the substitution of the wheat flour with LF. Previously, Yaver & Bilgiçli [2021] also documented an enhanced protein content (approximately 10%) in the wheat bread incorporated with ultrasound-treated lupin. Lupin is rich in high-quality proteins such as albumins and globulins, which enhance the protein content of the rolls. These proteins not only improve the nutritional profile but also contribute to the functional properties of the dough [Shrestha et al., 2021].
The total content of dietary fibre in the baked rolls also significantly (p<0,001) increased with the use of LF for their production, from 3.93 g/100 g in the control to 13.24 g/100 g in the LF25 sample (Table 4). The predominant fibre component in lupin seeds is insoluble fibre (89%), which is mainly composed of cellulose, hemicellulose and lignin [Parmdeep & Singh, 2017]. These findings are in line with those reported by Villarino et al. [2015], who studied the impact of the addition of lupin varieties to wheat bread and reported that the total dietary fibre content ranged between 14.6–16.2 g/100 g.
The results of this study demonstrated that the baked rolls incorporated with lupin flour containing more than 10% lupin can be considered, according to European Commission Regulation (EC) No 1924/2006 [Regulation EC, 2006], as a foodstuff high in fibre and protein (products containing at least 6 g of fibre per 100 g and at least 20% of the energy value of the rolls was provided by proteins).
According to Wójcik et al. [2021], the total carbohydrates include all digestible carbohydrates, primarily starches and sugars, which serve as a significant source of energy for the consumer. The total carbohydrate content was significantly lower in the LF baked rolls (70.72–79.70 g/100 g) than in the control (81.15 g/100 g). This trend aligns with Wójcik et al. [2021] who observed similar reductions in carbohydrate content when 10% pea flour was added to bread formulations.
The energy value indicates the number of calories that baked rolls provide to the body when consumed [Sedláková et al., 2016]. The energy value of the products decreased with the addition of lupin flour, from 365.79 kcal/100 g in the control to 343.57 kcal/100 g in the LF25 sample. The reduction in energy value is due to the lower carbohydrate content and higher fibre content of the lupin-enriched rolls, which are less calorie-dense. Furthermore, Sedláková et al. [2016] reported that lupin consumption caused feelings of satiety and affected the energy balance. These findings suggest that, compared with wheat bread, baked rolls enriched with lupin seed flour may decrease appetite for a short time.
Correlations between the assessed parameters
Correlation analysis revealed high positive correlations between WA and the protein content of the baked rolls (correlation coefficient, r=0.988) and TDF (r=0.898), indicating that the increased WA is closely connected to the enhanced protein and fibre contents contributed by the lupin flour. Comparable findings have been reported by Plustea et al. [2022], who investigated lupin-fortified wheat bread with a replacement of lupin flour at levels of 10, 20, and 30%.
Among the rheological parameters, DS also showed strong positive correlations with starch content and the C2 parameter (r=0.941 and r=0.916, respectively) and negative correlations with C1–C2 and protein content (r=−0.945, r=−0.929). Previously it was documented, that DS, C2, and C2–C1 were parameters related to the development and strength of the gluten matrix [Calderón et al., 2022].
Strong positive correlations were found between C3, C4, and C5 parameters (r in the range of 0.897–0.961). A strong positive correlation between C3 and C5 (r=0.942) was also documented by Belc et al. [2021] for wheat dough incorporated with legume protein concentrates.
Moreover, the content of starch in the samples was strongly positively correlated with the difference between C3 and C2 (r=0.953). The decrease in the viscosity peak (C3) and C3–C2 parameter with the addition of fewer starch components was in line with the findings by Abdel-Samie & Abdulla [2016]. The starch content also showed a strong positive correlation with the C5 parameter of Mixolab (r=0.946) and specific volume values (r=0.949). The C5 parameter is closely connected to the staling process of baked goods. Due to this fact, these results support the importance of the starch phase during the baking process [Abdel-Samie & Abdulla, 2016].
High positive correlations were also observed between loaf volume, specific volume, and the cambering of samples (r in the range of 0.884–0.9215). The relationships between the mentioned parameters underscores the importance of dough expansion and gas retention and that denser loaves (lower specific volume) tend to have poorer shapes [Monteiro et al., 2021]. Moreover, WA was negatively correlated with loaf volume (r=−0.943), specific volume (r=−0.939), and cambering (r=−0.957). In general, the higher the WA ability of a sample is, the greater the specific volume is, up to a certain point. Beyond this point, the weak structure of the dough may cause it to collapse during fermentation or baking. Such a high WA can lead to heavier, denser dough, which impacts the loaf’s ability to rise and maintain a good shape [Monteiro et al., 2021].
In the case of the other Mixolab parameters, the specific volume showed the highest positive correlation with C2 (r=0.971) among all the Mixolab parameters, followed by C5 (r=0.965), C3 (r=0.960) and dough stability (r=0.815). Similar results were also reported by Manano et al. [2021], who studied the properties of wheat-cassava composite dough.
Furthermore, the loaf volume and specific volume were negatively correlated with the protein content (r=−0.977 and r=−0.975, respectively). A higher protein content could lead to stronger dough that may not expand as much, resulting in lower volumes.
Sensory acceptability of baked rolls
Sensory analysis is crucial for assessing the quality, acceptability, and consumer preference of food products [Ruiz-Capillas & Herrero, 2021]. Figure 1 shows the effects of the incorporation of LF to wheat baked rolls on their color, flavor, porosity, springiness, adhesiveness, and taste acceptability. The sensory scores for color did not differ significantly (p≥0.05) between the control sample and LF5. However, with increasing LF levels, the baked rolls became darker and yellowish, and hence less attractive for the panellists. These results are also supported by correlation analysis, which revealed strong correlations (r=0.841–0.913) between the sensory color scores and instrumentally measured b* value and YI.
Figure 1
Sensory acceptability of baked rolls prepared using wheat flour (control) and flour blends containing 5–25% by weight of lupin flour as a wheat flour substitute (LF5–LF25, respectively).
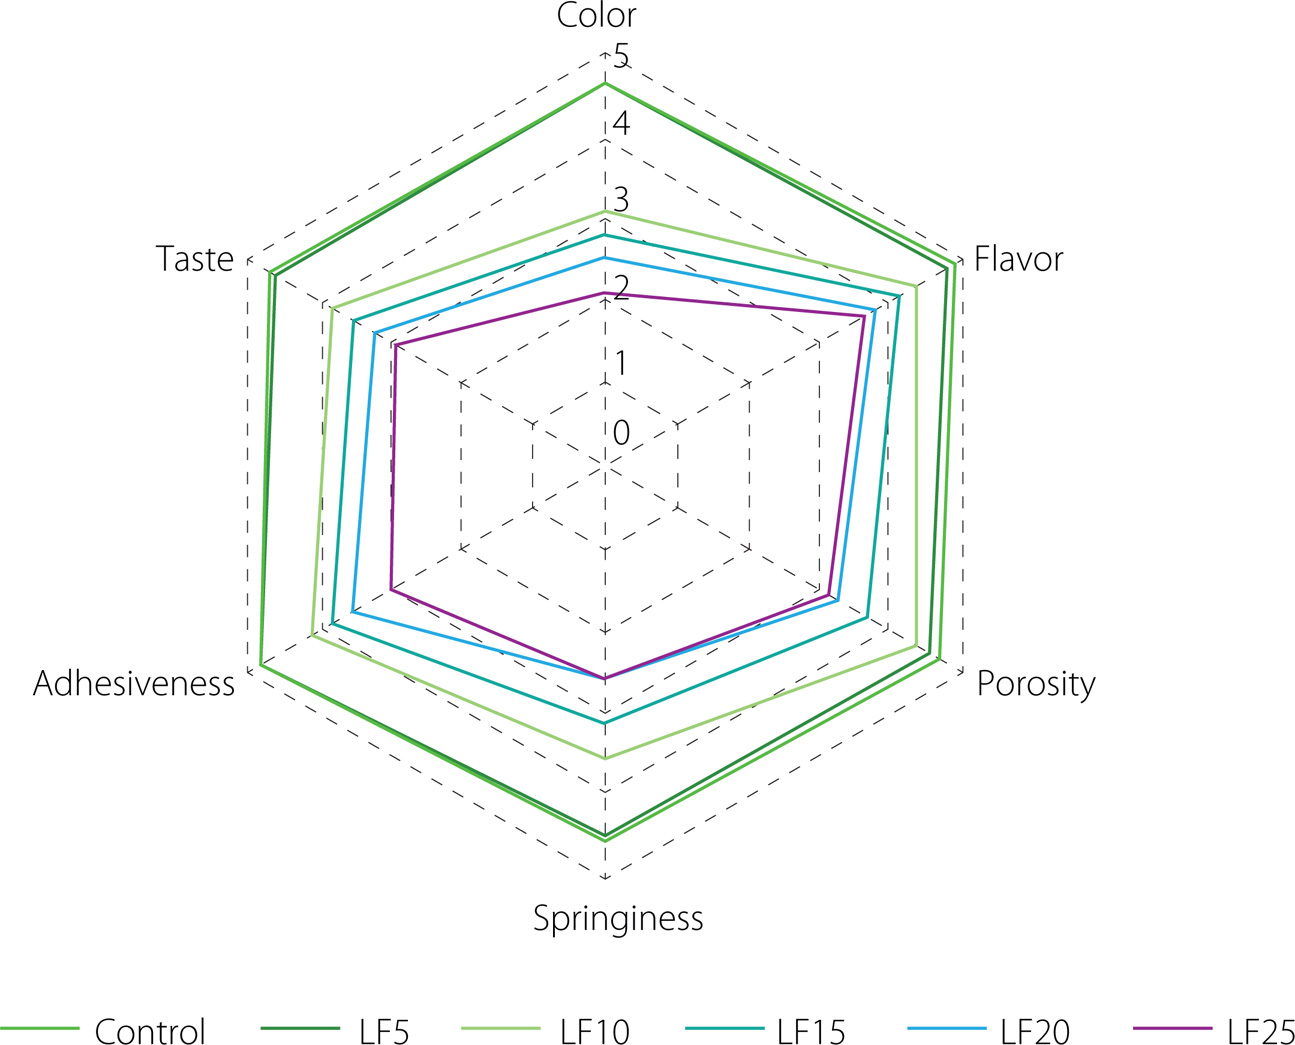
The taste and flavor scores of the baked rolls were significantly affected at a lupin substitution level of 20% (Figure 1). The decline might be due to the beany flavor associated with lupin flour. Likewise, taste and flavor in other bakery products were also affected by higher lupin contents (over 30%) because of their pronounced beany flavor and aftertaste [Jayasena & Nasar-Abbas, 2011; Plustea et al., 2022]. The overall aroma of lupins is described as beany or legume-like, green, or earthy [Schlegel et al., 2019]. One of the main compounds associated with the distinctive beany flavor in lupins, peas, beans, and soy is the alkyl aldehyde hexanal [Schlegel et al., 2019]. 2-Isopropyl-3-methoxypyrazine, 3-sec-butyl-2-methoxypyrazine, and 3-isobutyl- -2-methoxypyrazine are other compounds mainly responsible for beany-like aroma impressions in lupin.
Up to 10% substitution of wheat flour with LF did not affect the porosity of the baked rolls (Figure 1). At ≥15% levels, however, the porosity scores were significantly lower than those of the control. Rathnayake et al. [2018] highlighted the importance of protein quality in achieving good porosity. Porosity refers to the size and distribution of air cells within a crumb. The higher protein and fibre contents of lupin can negatively influence the gluten network, reducing gas retention and resulting in denser crumb structures.
The sensory score for the springiness of baked rolls decreased gradually with increasing replacement levels of LF (Figure 1). This effect may be attributed to the weaker gluten network, which affects the product elasticity. Analogous trends as in this study were observed by Villacrés et al. [2020] when wheat flour was replaced with different levels (10, 15, 20%) of fermented lupin flour.
Adhesiveness indicates how much the baked goods stick to surfaces such as teeth or the mouth [Sugiura, et al., 2017]. The present study results showed that the adhesiveness was higher in the control sample and decreased significantly with increasing levels of lupin in the samples. This may be due to the higher fibre content in lupin, which can reduce adhesiveness and contribute to a less sticky mouthfeel.
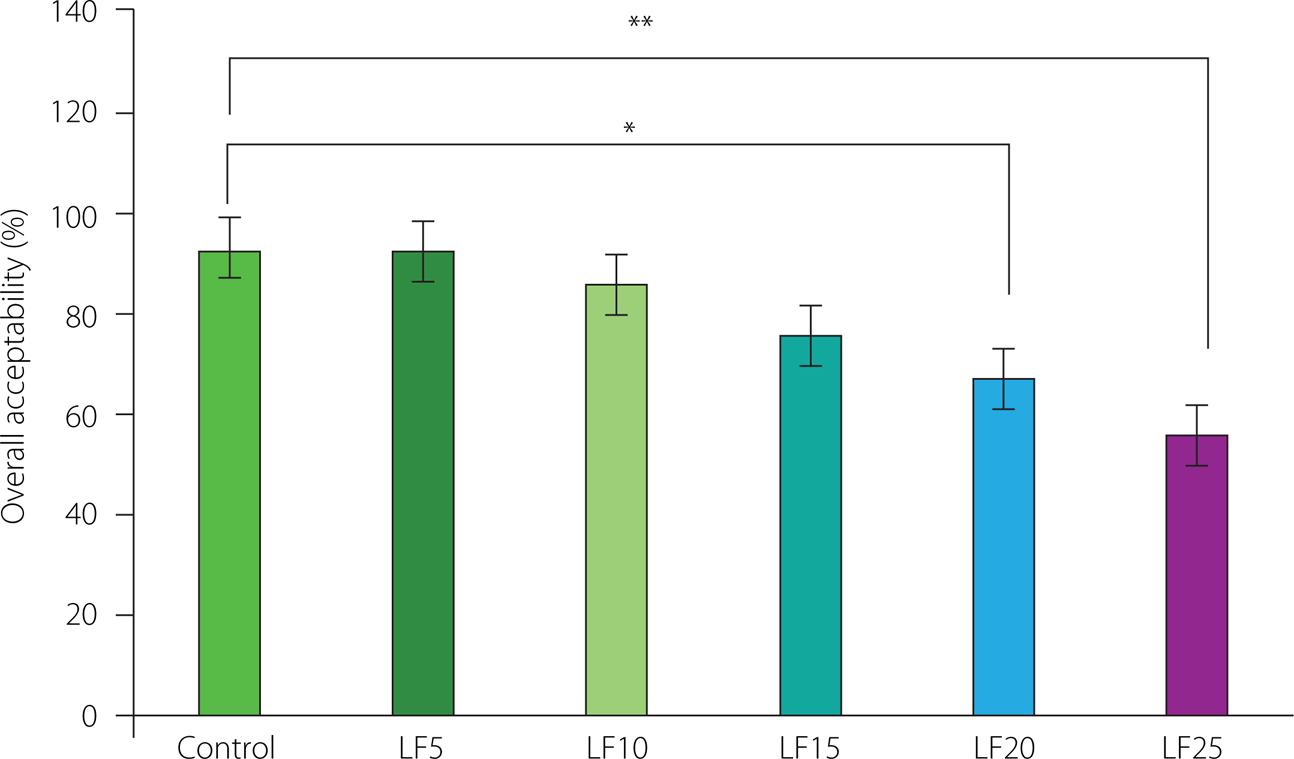
The overall acceptability indicates general palatability of the product. The baked rolls prepared by replacing wheat flour with up to 15% lupin flour were not significantly (p≥0.05) different from the control sample (Figure 2). However, at the 20% and 25% replacement levels, a significant decrease (p<0.05 and p<0.01, respectively) was observed in the overall acceptability score.
Figure 2
Overall acceptability of baked rolls prepared using wheat flour (control) and flour blends containing 5–25% by weight of lupin flour as a wheat flour substitute (LF5–LF25, respectively). Asterisk brackets denote a significant difference between samples at p<0.05 (*) and p<0.01 (**).
Sensory acceptability evaluation revealed that replacing wheat flour with LF up to 15% did not negatively affect the sensory quality of the studied baked rolls.
CONCLUSIONS
The results demonstrated that lupin flour incorporation into the wheat dough could significantly modify its rheological properties resulting in increased WA and reduced DS. These changes in the dough rheological characteristics were also reflected in the final baked rolls, which exhibited reduced volume, specific volume, and cambering. Among the tested formulations, the rolls prepared from the blended flour containing 15% lupin flour were evaluated as the most acceptable for assessors. Products containing higher levels of lupin presented a significant decrease in the overall acceptability due to their beany aftertaste. From a nutritional standpoint, the lupin-enriched rolls produced from the flour blend containing more than 10 % lupin can be considered as “high in protein and fibre”.
In conclusion, the incorporation of lupin flour into baked rolls offers a promising way to enhance their nutritional profile without compromising their sensory acceptability, provided that the substitution level is less than 15%. This balance allows for the production of baked goods that can meet the dietary needs of consumers seeking higher protein and fibre contents in their diets.