INTRODUCTION
A crucial humanitarian issue is to ensure food security for groups suffering from malnutrition. According to the Food and Agricultural Organization (FAO), deficiency of nutrients in the diet is responsible for more than half of infant mortality worldwide [FAO, 2022]. The burden of nutritional deficiency is excruciating for persons with lower incomes, including mostly those from the developing countries [Erokhin et al., 2021].
Maize and cassava are staple crops for over 800 million people; however, a diet dominated by flour from these plants causes nutritional deficiencies (e.g., niacin, calcium). Sustainable processing techniques, like nixtamalization and fermentation, can address these gaps, as shown by FAO data linking calcium-supplemented diets to reduced child mortality [FAO, 2022]. Nixtamalization and fermentation are traditional processing techniques that significantly influence the physicochemical properties of these flours; enhancing their nutritional quality [Sefa-Dedeh et al., 2004; Widowati et al., 2025]. Nixtamalization, being a thermo-alkaline process, improves starch gelatinization and retrogradation by altering its structure and rendering it improved physical properties, as shown in black bean and maize flours [Gutiérrez-Cortez et al., 2022; Santiago-Ramos et al., 2018]. This process also enhances the content of minerals, such as calcium and iron, and reduces resistant starch content, which can improve the nutritional profile of foods [Gutiérrez-Cortez et al., 2022; Santiago-Ramos et al., 2018]. Furthermore, it reduces antinutrient levels, such as phytates, which can inhibit mineral absorption, thereby increasing the bioavailability of essential nutrients like iron and zinc [Hassan et al., 2024; Matendo et al., 2023]. Sefa-Dedeh et al. [2003] reported that lactic acid fermentation of nixtamalized maize, further enhances these benefits by lowering pH and increasing titratable acidity. Such changes in pH can additionally improve the microbial safety and sensory properties of fermented foods. Similarly, fermentation impacts the nutritional and functional properties of cassava flour [Mohidin et al., 2023; Widowati et al., 2025]. Fayemi & Ojokoh [2014] reported that different fermentation methods, such as traditional, brine, and backslopping, affect the physical properties of a cassava flour product – fufu. For instance, brine and backslopping fermentation techniques result in lighter fufu with lower swelling indices and bulk densities compared to traditional method. These fermentation processes also enhance the protein content and mineral levels, making them valuable for nutritional enrichment of cassava flour [Fayemi & Ojokoh, 2014]. Blending nixtamalized maize and fermented cassava flours creates a superior food product with multiple advantages. This combination enhances the nutritional profile by increasing calcium, niacin, and protein availability from the maize while reducing cyanogenic compounds and adding B-group vitamins from the cassava fermentation process [Bongjo et al., 2025a,b]. The blend offers improved functional properties with better viscoelasticity and texture, extended shelf-life through reduced microbial and enzymatic activity (as a result of reduced moisture content), and complementary amino acid profiles that provide a more complete protein source. The processing methods decrease contents of antinutrients, like phytates, while developing complex flavors, with the slight alkalinity of nixtamalized maize complementing the subtle acidity of fermented cassava. Beyond the nutritional and culinary benefits, this blend preserves traditional food processing techniques and modern applications, promoting local food security.
Nixtamalization, a process involving the cooking and steeping of maize in an alkaline solution, alters the integral structure of the maize starch molecules [Gutiérrez-Cortez et al., 2022] which could have implications on the thermodynamic properties and moisture sorption isotherms of nixtamalized products. The study of moisture desorption and thermodynamic characteristics of maize and cassava-based flours is crucial for optimizing their processing and storage conditions. Research has shown that nixtamalized maize flour exhibits type II sorption isotherms, which are effectively described by Guggenheim–Anderson–de Boer (GAB) and Henderson models [Ramírez-Miranda et al., 2014]. The isosteric heat and entropy of nixtamalized maize flour decreased with increasing moisture content, indicating changes in energy requirements during processing and storage [Ramírez-Miranda et al., 2014]. Understanding the thermodynamic properties, such as the isosteric heat of desorption, is also essential for evaluating the energy performance of drying processes for cassava products. Studies have demonstrated that fermentation has minimal impact on the desorption characteristics of cassava products, with the modified Chung–Pfost equation effectively capturing the temperature dependency of the isosteric heat of desorption [Sarnavi et al., 2023].
It has been shown that mathematical models describing moisture sorption isotherms allow for effective prediction of water activity in the product during dehydration [Hssaini et al., 2022; Labuza & Altunakar, 2020]. Moisture sorption isotherms provide critical insights into how water moves and interacts within different food materials, particularly during dehydration processes [Tejada-Ortigoza et al., 2020; Zhang et al., 2016]. By analyzing sorption isotherm data, key thermodynamic properties, including net isosteric heat, differential enthalpy, and entropy, are obtained [Sengev et al., 2016, 2018]. These parameters not only reveal critical information about water behavior within food products but also enable precise estimation of energy requirements for drying processes. Moreover, recent research has highlighted the significance of desorption enthalpies in optimizing drying operations [Biswal et al., 2017], further underscoring the importance of these thermodynamic analyses in food processing research.
Despite the wide application of nixtamalization and fermentation to improve the nutritional value of maize and cassava flours, respectively, few studies have so far explored the thermodynamic properties of these traditionally processed flours. To the best of our knowledge, blends of these flours have not been studied in this respect. Therefore, the aim of our study was to evaluate how nixtamalization of maize flour and fermentation of cassava flour affect moisture desorption isotherms and thermodynamic properties of maize and cassava flour blends.
MATERIALS AND METHODS
Raw materials and preparation of flours
Maize grains of white variety (15 kg) and cassava tubers of sweet variety (50 kg) were purchased on the Wurukum and Wannune markets, respectively, located in Makurdi (Nigeria).
Non-nixtamalized maize flour was obtained by grinding maize grains in an electric power grinder (DE-2000g; Golden Bull, Kuala Lumpur, Malaysia) after cleaning them from extraneous materials. The flour was sieved through a 40 mm mesh and packaged in low-density polyethylene bags until further analysis.
Nixtamalized maize flour was prepared according to the procedure described by Milán-Carrillo et al. [2004] with slight modifications. The maize grains (3 batches of 5 kg each) were immersed in a 1% Ca(OH)2 solution at a ratio of 1:3 (w/v) and cooked for 40 min. Cooked grains were left in the Ca(OH)2 solution for 18 h to steep and then drained. The excess of unabsorbed Ca(OH)2 and the pericarp were removed from the soaked grains by washing them three times with water. The nixtamal thus obtained was dried in a BioChef dehydrator (KT-DE-BC-9T, Vitality4 Life UK Ltd, Peterborough, UK) at 65°C for 24 h and ground in an electric power grinder (Golden Bull). The nixtamalized maize flour that was passed through the 40 mm sieve was sealed in low-density polyethylene bags and stored at ambient temperature until further experiments.
The cassava tubers, after removing their peel and washing in water, were cut into pieces, which were then dried at 65°C for 48 h in the BioChef dehydrator (Vitality4 Life UK Ltd) to obtain non-fermented cassava flour. Fermentation of cassava flour was performed using the back-slopping method. Briefly, flour (50 g) was suspended in distilled water at a ratio of 1:3 (w/v) and left for 24 h at ambient temperature. Half of each fermented mixture was used as a starter for subsequent fermentation cycles. There were four fermentation cycles (i.e., fermentation lasted up to the 96th h). Fermentation was controlled by pH measurements and continued until the pH values stabilized. After fermentation, the flour was dried at 50°C for 24 h using BioChef dehydrator (Vitality4 Life UK Ltd) and sieved through a 40 mm mesh. The non-fermented cassava flour and fermented cassava flour were stored in low-density polyethylene bags until analyses.
Formulation of flour blends
Maize and cassava flours were mixed in a ratio of 2:1 (w/w) using a food mixer (Model: B5; Jiangmen Shengli Food Machinery Co., Ltd., Jiangmen, GD, China) to obtain four blends including a blend of non-nixtamalized corn flour and non-fermented cassava flour (NNNF), a blend of non-nixtamalized corn flour and fermented cassava flour (NNF), a blend of nixtamalized corn flour and non-fermented cassava flour (NXNF), and a blend of nixtamalized corn flour and fermented cassava flour (NXF). The ratio of maize to cassava flour in blends was established based on preliminary studies in which blends (NNNF, NNF, NXNF and NXF) were formulated in 3 different ratios (1:1, 1:2 and 2:1, w/w), and sensory evaluation of the fufu produced from all these blends was carried out. Blends in the 2:1 (w/w) ratio provided the fufu with higher overall acceptability. These blends were stored until analysis in the same conditions as flours, after placing them in polyethylene bags.
Determination of equilibrium moisture content
The equilibrium moisture content was determined using a gravimetric method according to the procedure described by Ariahu et al. [2005]. The varying humidity conditions were created using sulfuric acid solutions of 10, 20, 30, 40, 50 and 60% concentrations providing water activity (aw) between 0.15 and 0.96. A volume of 200 mL of each sulfuric acid solution was measured into plastic containers (500 mL) over which the flour blends weighed into crown corks (in duplicates of 0.5 g each) were placed on wire gauze. Before this placement, the flour blends were moistened with distilled water and kept at 30°C and 98% relative humidity (RH) until they reached equilibrium. The sealed containers with samples were kept at different temperatures of 10, 20, 30 and 40°C using an SPX-80-II incubator (Searchtech Instruments, UK). The samples maintained at RH above 50% were treated with 0.25% sodium azide solution to prevent microorganism growth [Sengev et al., 2016]. The sample weights were measured every 48 h using an AE Adam 160 balance (Adam Equipment Co, Milton Keynes, UK). This weighing process continued until the difference between successive measurements was 0.5% or less. The entire procedure of removing each of the flour blends for weighing and returning them to their airtight containers took between 2 and 5 min, following the guidelines established by the Cooperative Project Cost 90 [Sengev et al., 2018].
The equilibrium moisture content (EMC) was calculated using Equation (1) and moisture desorption isotherms, e.g., aw vs. ECM were plotted for each temperature:
where: M is the initial moisture content of the sample, W1 is the weight of sample during sorption, W2 is the initial weight of the sample and crown cork, and W3 is the final weight of the sample and crown cork at equilibrium.
Modeling and analysis of sorption data
The experimental data of EMC and aw of the flour blends were fitted using the Brunauer–Emmett–Teller (BET), GAB and Oswin models, which are described by Equations 2, 3 and 4, respectively. These models were chosen for their reported fit for starchy foods over various water activities [Ocheme et al., 2013]:
where: M is the equilibrium moisture content, M0 is the monolayer moisture content, while A, B, G, k and C are constants related to the heat of sorption.
Parameters of the BET and Oswin models were determined through linear regression analysis, while the quadratic parameters for the GAB model were computed using the Origin 2024b (OriginLab Corporation, Northampton, MA, USA). The monolayer moisture contents (M0) in BET and GAB models were determined from the regression equations of their respective plots, using the moisture desorption data as the basis for calculation.
The surface area of sorption (S0) is related to the monolayer moisture content and was computed using Equation 5:
where: 3,513.42 is a constant derived from Avogadro’s number and the cross-sectional area of a water molecule.
To evaluate how well the various models performed, the percent root mean square of error (%RMSE) was calculated by comparing experimental moisture content values (Mobs) with predicted moisture content values (Mest) as in Equation 6 [Sengev et al., 2016]:
where: n is the number of experimental data.
Analysis of thermodynamic properties
The Clausius-Clapeyron Equation (7) was used to determine the net isosteric heat of desorption (∆Hst) and indirectly, differential entropy of sorption (∆S0). This equation described isosteres obtained by plotting ln(aw) vs. the inverse of temperature in absolute scale (1/T) for a given equilibrium moisture content [Ariahu et al., 2005]. ∆Hst was calculated from the slope (−∆Hst/R) and ∆S0 was derived from the intercept (Cst), corresponding to the coefficient (∆S0/R):
where: ∆Hst is the net isosteric heat, Cst is a constant related to the entropy of sorption, T is temperature at absolute scale and R is a molar gas constant (0.008314 kJ/mol×K).
RESULTS AND DISCUSSION
Effect of temperature on the moisture desorption isotherm
The moisture desorption isotherms of NXNF, NXF, NNF, and NNNF blends at different temperatures are presented in Figure 1. The blends exhibited S-shaped (type II) isotherms. It was due to the high starch content of the flours, which was determined in our previous study [Bongjo et al., 2025b]. Type II isotherms are common for carbohydrate-rich products as shown, for example, by the results presented for sorghum-based [Sengev et al., 2016] and soybean-plantain-based [Agbor et al., 2024] food products. A high carbohydrate content (>70%) causes multilayer sorption with progressive gelatinization of starch, exposing hydrophilic sites, during nixtamalization [Santiago-Ramos et al., 2018].
Figure 1
Moisture desorption isotherms of blends of nixtamalized maize flour and non-fermented cassava flour (NXNF) (A), nixtamalized maize flour and fermented cassava flour (NXF) (B), non-nixtamalized maize flour and fermented cassava flour (NNF) (C), and non-nixtamalized maize flour and non-fermented cassava flour (NNNF) (D) at different temperatures.
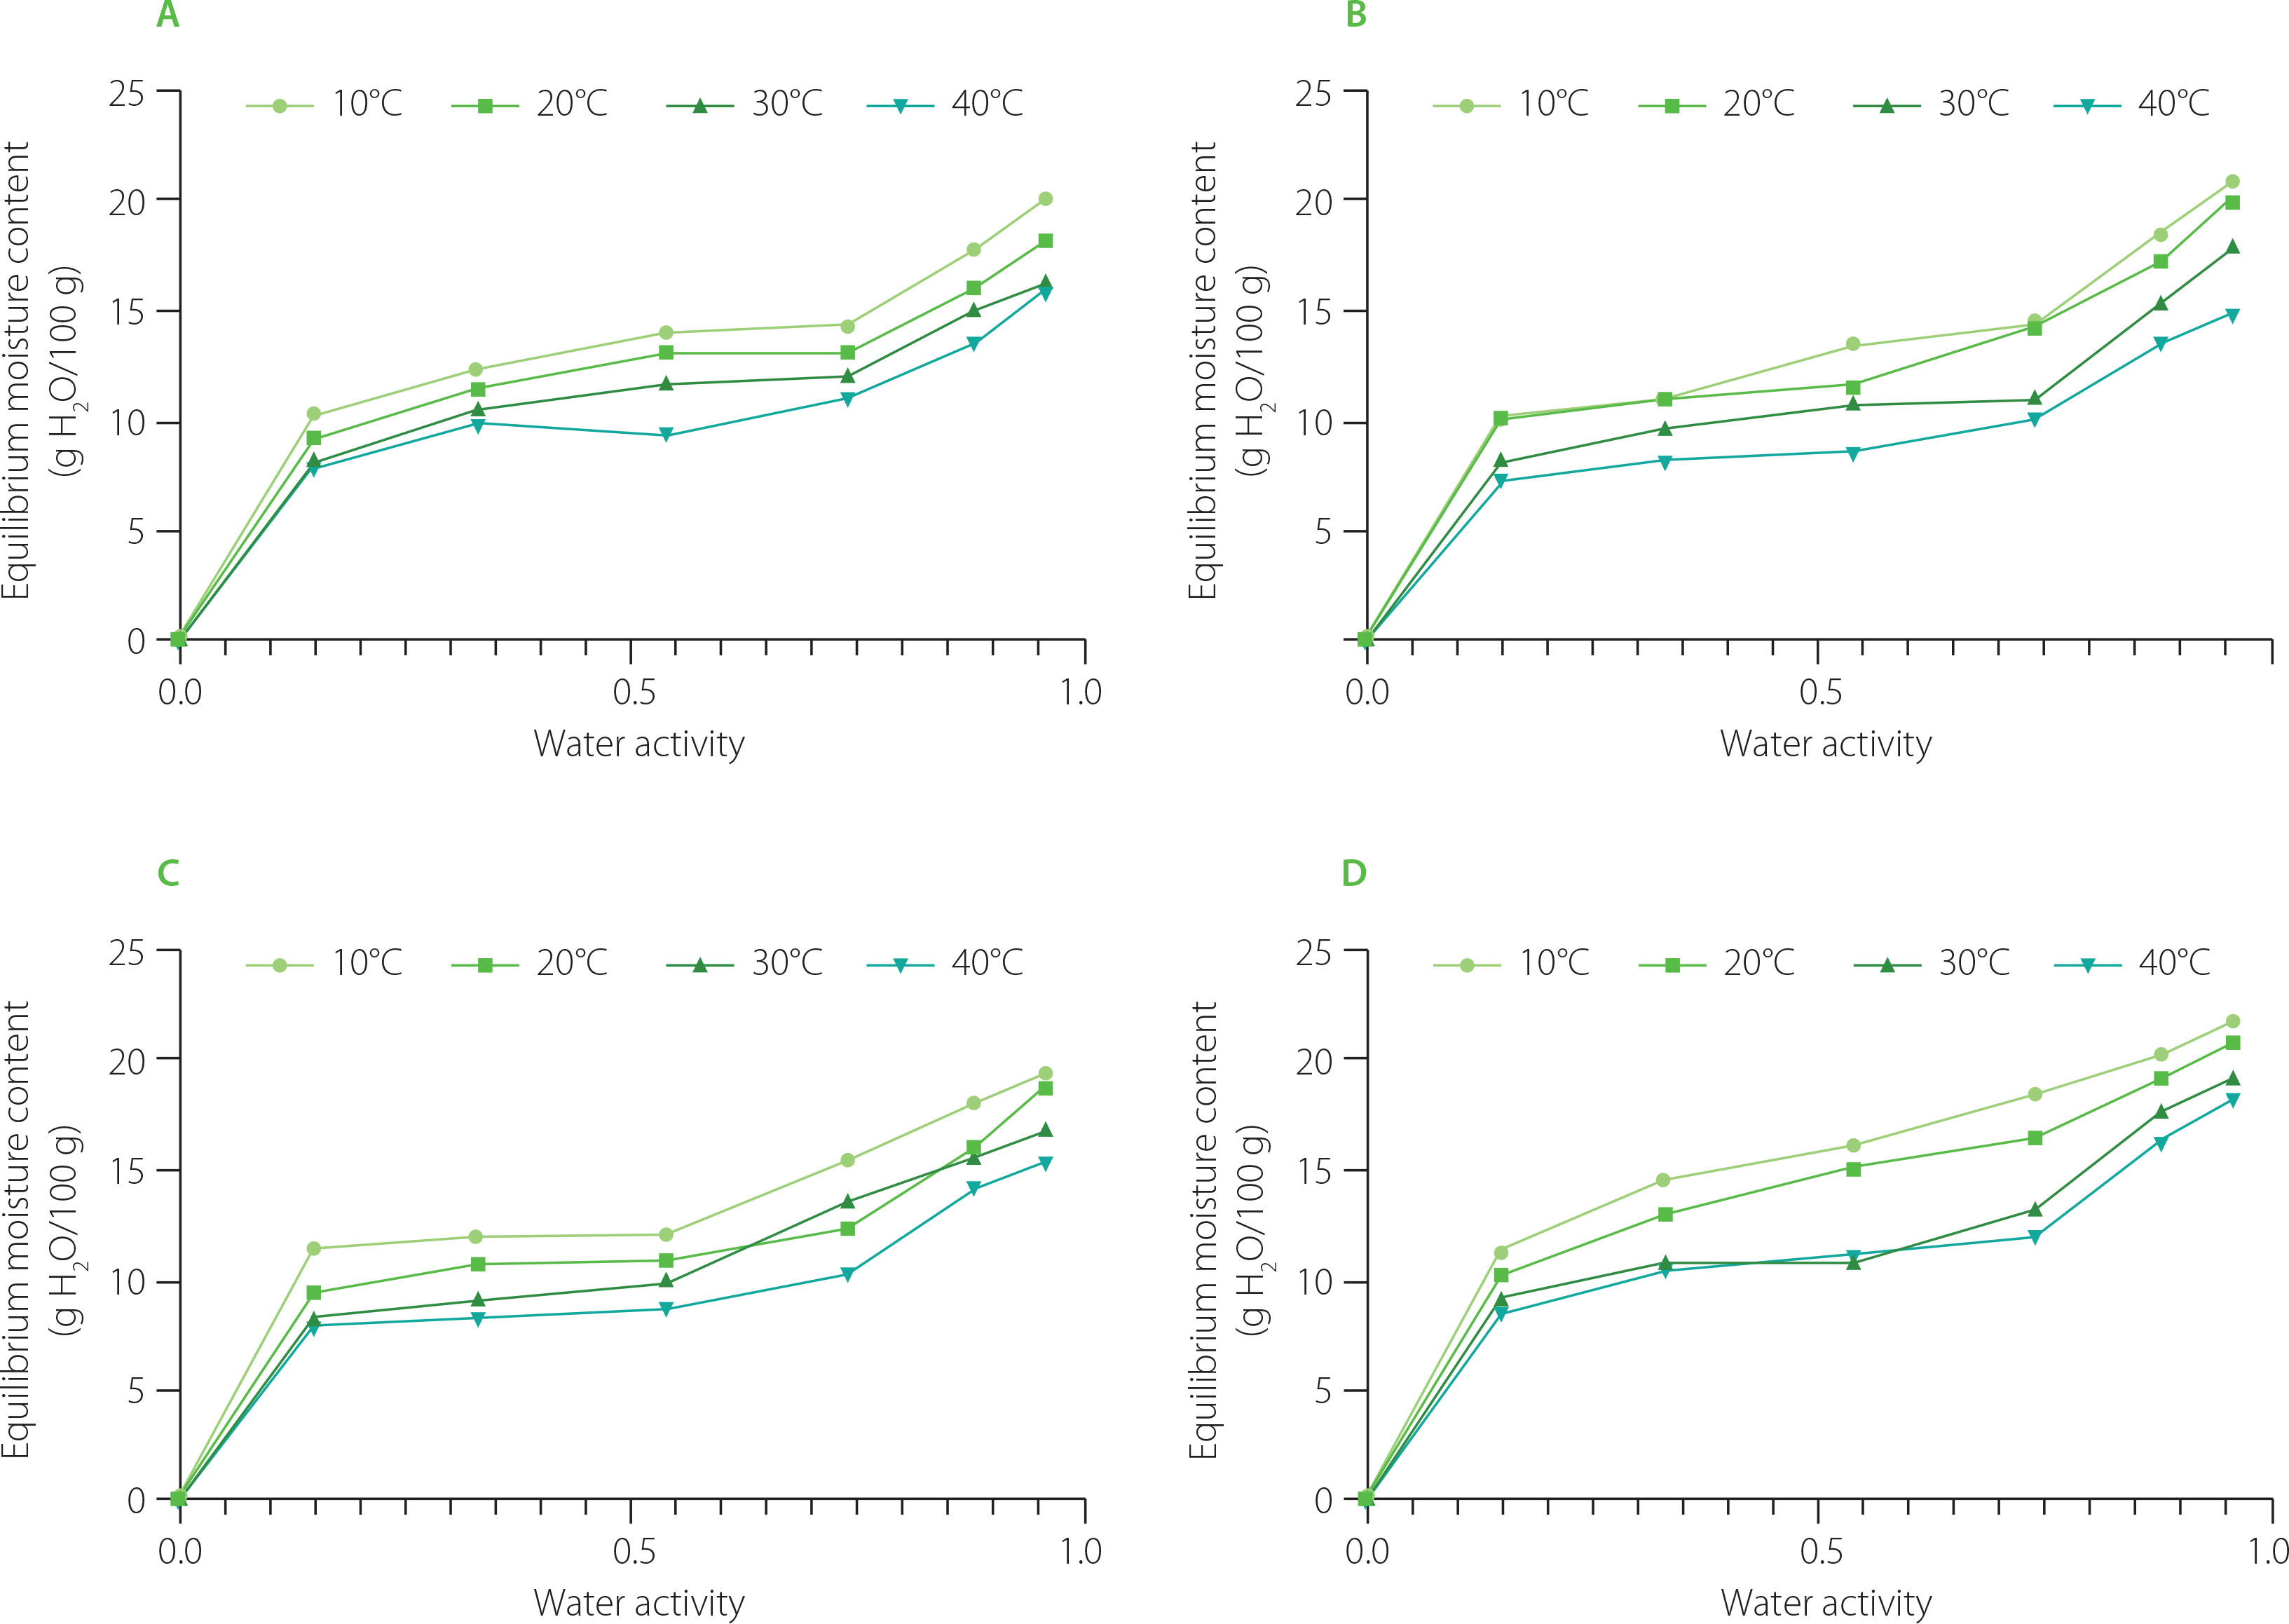
The equilibrium moisture content of the blends decreased as the temperature increased from 10 to 40°C (Figure 1). Such a relationship is often reported in sorption studies and is explained by the fact that with increasing temperature the excited state of molecules of water vapor changes and their kinetic energy increases, which results in less binding to active sorption sites [Zeymer et al., 2022]. It was also observed, for instance, for different varieties of milled rice [Chen et al., 2019] and for a mixture of corn silage and fermentation residue from animal breeding [Poós & Szabó, 2019]. Additionally, an increase in temperature lowered the isotherm curves, resulting in higher aw at a constant equilibrium moisture content (Figure 1). This means that the product is more susceptible to microbial spoilage. An increase in temperature at constant aw leads to a decrease in moisture content, which is much safer for the product and ensures its better stability, as reported by Ocheme et al. [2013]. Gichau et al. [2020] also observed a similar scenario for complementary food from amaranth-sorghum grain blends. Studies have also reported that at low moisture content, water molecules are adsorbed to the active sites on the surface of the solids. However, as moisture content increases, the swelling of the solid increases, creating additional binding sites, allowing more water to be retained [Shih et al., 2011].
Effect of treatments on the moisture desorption isotherms
The NNNF blend was observed to have the highest sorptive capacity at all temperatures (Figure 1). However, the samples that were treated with nixtamalization and fermentation had relatively lower EMCs. The varying water desorption characteristics of NXF and NXNF blends compared to NNNF blend can be understood by considering the complex interactions between water and the food matrix compounds. Nixtamalization modifies the structural components of foods, particularly starch and protein, significantly influencing moisture dynamics. Water initially penetrates more rapidly into processed samples with partially gelatinized starch or altered protein structures due to the more accessible molecular architecture. However, as sorption progresses, these samples tend to release unbound water more readily, ultimately resulting in lower EMC because of a reduced number of tightly bound water sites. This phenomenon highlights the complex relationship between food processing techniques and moisture sorption at the molecular level [Santiago-Ramos et al., 2018]. The observed differences between the NNNF blend and the NXF and NXNF blends could also be due to the different contents of hydroscopic compounds like sugars and amorphous compound. The NNNF blend may have higher levels of soluble sugars or amorphous compounds that are highly hygroscopic and bind water strongly at equilibrium, increasing EMC, while the NXF and NXNF samples may have fewer such components, resulting in their lower EMC.
The effect of fermentation on the sorptive capacity of the flour blends could also be significant. Similarly to nixtamalization, fermentation altered food properties by modifying the starch and protein structures, which can impact moisture sorption characteristics. Research has shown that fermented foods often demonstrate enhanced thermal stability and reduced water uptake, particularly at lower RH levels [Sun-Waterhouse et al., 2014]. Studies have also shown that non-treated food samples tend to exhibit a higher equilibrium moisture content compared to fermented alternatives. For instance, Igbabul et al. [2012] found that non-blanched, non-fermented arrowroot lily tubers absorbed more moisture than their blanched and fermented counterparts. They concluded that heat treatment might have damaged active binding sites, while fermentation could modify tissue structures, consequently reducing the number of water-binding sites available to water molecules. Similar findings were reported in studies of complementary foods made from fermented pre-gelatinized plantain and soybean flours [Agbor et al., 2024], further supporting the hypothesis that food processing techniques significantly influence moisture interactions at the molecular level.
Fit of the sorption models
The adequacy of experimental data for moisture desorption was evaluated using the BET, GAB and Oswin equations, and their fit expressed as the percentage of root mean square of error (%RMSE) is presented in Table 1. The BET model is the most commonly used for modeling sorption isotherms of various foods and is considered appropriate when the aw <0.50. The GAB model is also widely used for analyzing the sorption properties of food products and provides a good fit to data for porous materials. On the other hand, the Oswin model conveniently describes the sorption of food products in the aw range of 0.05 to 0.95 [Ariahu et al., 2005; Igbabul et al., 2012]. In our study, the GAB equation fitted better than the BET and Oswin equations having mean RMSE values <5%. For example, for the NXF blend, RMSE of the GAB model ranged from 3.39 to 6.80% depending on the desorption temperature, while the ranges for BET and Oswin models were 5.64–7.30% and 15.78–16.96%, respectively. Although the RMSEs of the BET model were higher than those of the GAP model for most flour blends (except the NXF blend at 30°C and NXNF and NNNF at 40°C), the former should also be considered as showing very good predictive performance, with mean RMSE below 7.1%. In statistical modelling, RMSE exceeding 10% suggests poor model performance, while values of 10% or less indicate a fairly good model fit, providing confidence that the model is able to accurately describe the moisture sorption [Wang & Brennan, 1991]. López-Vidaña et al. [2021] also reported that the GAB model fitted the moisture sorption isotherms of stevia leaves significantly better than the other models tested. Some researchers have also reported the GAB model being the best fit model for pulp and seed of Syzygium cumini [Araújo & Pena, 2022] as well as for fresh S. cumini fruit [Biswal et al., 2017]. In contrast, Arslan-Tontul [2020] reported that the BET model described moisture sorption isotherm of whole chia seed better than the GAB model did.
Table 1
Percent root mean square error (%RMSE) of moisture sorption models for blends of maize and cassava flours at different temperatures.
[i] BET, Brunauer–Emmett–Teller model; GAB, Guggenheim–Anderson–de Boermodel;NXF, nixtamalized maize flour and fermented cassava flour; NXNF, nixtamalized maize flour and non- - fermented cassava flour; NNF, non-nixtamalized maize flour and fermented cassava flour; NNNF, non-nixtamalized maize flour and non-fermented cassava flour.
Monolayer moisture contents and derivative parameters
The parameters of BET and GAB models for desorption isotherm of flour blends are shown in Tables 2 and 3, respectively. The models allowed for the estimation of the monolayer moisture content (M0) representing the moisture level at which the surface of the material is fully covered by a single layer of water molecules [Ariahu et al., 2005]. M0 is a critical parameter in food preservation studies because it determines the optimal moisture state at which food products maintain maximum stability during storage – microbial growth and chemical degradation are limited. By precisely determining the M0, more effective strategies for food processing, storage, and preservation can be developed [Lahsasni et al., 2003]. The M0 reported in this study decreased with an increase in temperature for each flour blend (Table 2 and 3). This agrees with the findings reported by Sengev et al. [2018] who studied the moisture sorption behavior of sorghum-based complementary foods. A similar observation was made by Gichau et al. [2020] for amaranth-sorghum-based complementary foods. Rakshit et al. [2014] also observed a similar situation with monolayer moisture content decreasing from 1.29 g/100 g solids at 15°C to 1.03 g/100 g solids at 45°C for wadi – a legume-based traditional condiment. Sormoli & Langrish [2015] while investigating the moisture characteristics of spray-dried orange juice powder and Biswal et al. [2017] while studying the moisture sorption behavior of S. cumini fruit both observed this behavior; i.e., a decrease in M0 with an increase in temperature. They further suggested that the decrease in monolayer moisture content may be attributed to a reduction in the total number of active sites available for water binding. This reduction could result from physical and/or chemical changes in the product caused by temperature variations. This could be the case in this study as a result of the treatments; nixtamalization and fermentation, which lead to the modification of the food compound structure. Research have further shown that the decrease in M0 occurs because, as temperature increases, some water molecules gain enough energy to break away from their sorption sites [Ariahu et al., 2005; Igbabul et al., 2012]. These findings suggest that the expected storage temperature of the flour samples will play a crucial role in determining the optimal moisture content for maximum shelf stability.
Table 2
Brunauer–Emmett–Teller (BET) model parameters for desorption isotherms of maize and cassava flour blends.
[i] r2, Determination coefficient; M0, monolayer moisture content; S0, surface area of sorption; C, BET constant; NXF, nixtamalized maize flour and fermented cassava flour; NXNF, nixtamalized maize flour and non-fermented cassava flour; NNF, non-nixtamalized maize flour and fermented cassava flour; NNNF, non-nixtamalized maize flour and non-fermented cassava flour.
Table 3
Guggenheim–Anderson–de Boer (GAB) model parameters for desorption isotherms of maize and cassava flour blends.
[i] r2, Determination coefficient; M0, monolayer moisture content; G and K, GAB constants; S0, surface area of sorption; NXF, nixtamalized maize flour and fermented cassava flour; NXNF, nixtamalized maize flour and non-fermented cassava flour; NNF, non-nixtamalized maize flour and fermented cassava flour; NNNF, non-nixtamalized maize flour and non-fermented cassava flour.
The M0 of foods varies with the composition of the food as well as the treatments or processes applied in the production of the food material. The values obtained in this study (6.26–15.44 g H2O/100 g solids in the GAB model and 6.13–11.19 g H2O/100 g solids in the BET model, Tables 2 and 3) were higher than those reported by Gichau et al. [2020] who found M0 ranging from 2.86 to 3.26 g/100 g solids for amaranth-sorghum-based complementary foods. This was also the case with tropical freshwater crayfish (2.27–5.48 g/100 g solids), as reported by Ariahu et al. [2005]. The results were, however, similar to those reported by Igbabul et al. [2012] for African arrowroot lily tuber mash. The results in this study were also consistent with observations made by other researchers who reported that for both adsorption and desorption, the M0 values obtained by the GAB model were considerably higher than those obtained by the BET model [Ariahu et al., 2005; Gichau et al., 2020; Igbabul et al., 2012]. Moreover, the blends with fermented cassava flours (NXF and NNF) had lower M0 than those with non-fermented cassava flour (NXNF and NNNF) at each temperature (Tables 2 and 3), indicating the need for more rigorous control of the latter during storage.
Similarly as in the case of M0, the blends with nixtamalized flour (NXF and NXNF) had lower S0 than the NNNF blend; having higher values in both sorption models. This could be because during nixtamalization (which causes gelatinization), starch molecules absorb water, swell and rupture. When these molecules rupture, there is loss of water leading to shrinkage. Hence, there is a lesser surface area than in the non-nixtamalized samples.
Thermodynamic properties
To determine thermodynamic properties of the flour blends, the curves of ln(aw) vs. inverse of temperature in absolute scale were plotted and they are shown in Figure 2. The parameters of the Clausius–Clapeyron equation, which described these curves, and calculated values of net isosteric heat and differential entropy of desorption are presented in Table 4. The ΔHst decreased from 21.97 to 10.04 for the NXNF blend, from 29.15 to 11.33 for the NXF blend, from 34.06 to 13.43 for the NNF blend, and from 28.92 to 6.76 for the NNNF blend. The NNF sample had the highest ΔHst as opposed to the NXNF blend exhibiting the lowest net isosteric heat within the equilibrium moisture content range of 2 to 4 g H2O/100 g solids. The ΔHst is a difference in isosteric heat and the latent heat of vaporization of pure water at a particular system temperature [Arslan-Tontul, 2020]. In this study, it was notably greater at low levels of equilibrium moisture content, but it progressively diminished with rising moisture content, approaching the latent heat of vaporization of pure water. As the equilibrium moisture content approached 5–6 g H2O/100 g solids, the ΔHst continued to decrease, but much more slowly, or leveled off to become nearly constant with further increases in moisture content. The decrease in ΔHst with increasing amounts of sorbed water can be explained by the initial sorption process, which occurs on the most active and available sites, leading to high interaction energy [Li X. et al., 2011; Li Y. et al., 2016; Sengev et al., 2018]. As these high-energy sites become occupied, sorption shifts to less active sites, resulting in lower heats of sorption due to the formation of multilayers. At high equilibrium moisture content, the heat of sorption gradually approaches the heat of condensation of pure water [Araújo & Pena, 2022; Sengev et al., 2018]. Additionally, the variation in heat of sorption with moisture content provides essential data for estimating energy consumption and optimizing the design of drying equipment. It also offers insights into the balance between water–solid and water–water interactions, which influence the sorption behavior of the material [Al-Muhtaseb et al., 2002]. For industrial application, lower isosteric heat (~12 kJ/mol) in the NXNF blend suggests energy-efficient drying for fufu production, reducing costs compared to traditional methods.
Table 4
Parameters of Clausius–Clapeyron equation and differential entropy of desorption for blends of maize and cassava flours.
[i] ΔS0, Differential entropy of desorption; ΔHst, net isosteric heat; n, no. of entries; r2, determination coefficient; B, intercept coefficient; A, slope; NXF, nixtamalized maize flour and fermented cassava flour; NXNF, nixtamalized maize flour and non-fermented cassava flour; NNF, non-nixtamalized maize flour and fermented cassava flour; NNNF, non-nixtamalized maize flour and non-fermented cassava flour.
Figure 2
Clausius–Clapeyron relationship between water activity (aw) and temperature in absolute scale (T) for moisture desorption isotherms of blends of nixtamalized maize flour and non-fermented cassava flour (NXNF) (A), nixtamalized maize flour and fermented cassava flour (NXF) (B), non-nixtamalized maize flour and fermented cassava flour (NNF) (C), and non-nixtamalized maize flour and non-fermented cassava flour (NNNF) (D). ECM, equilibrium moisture content.
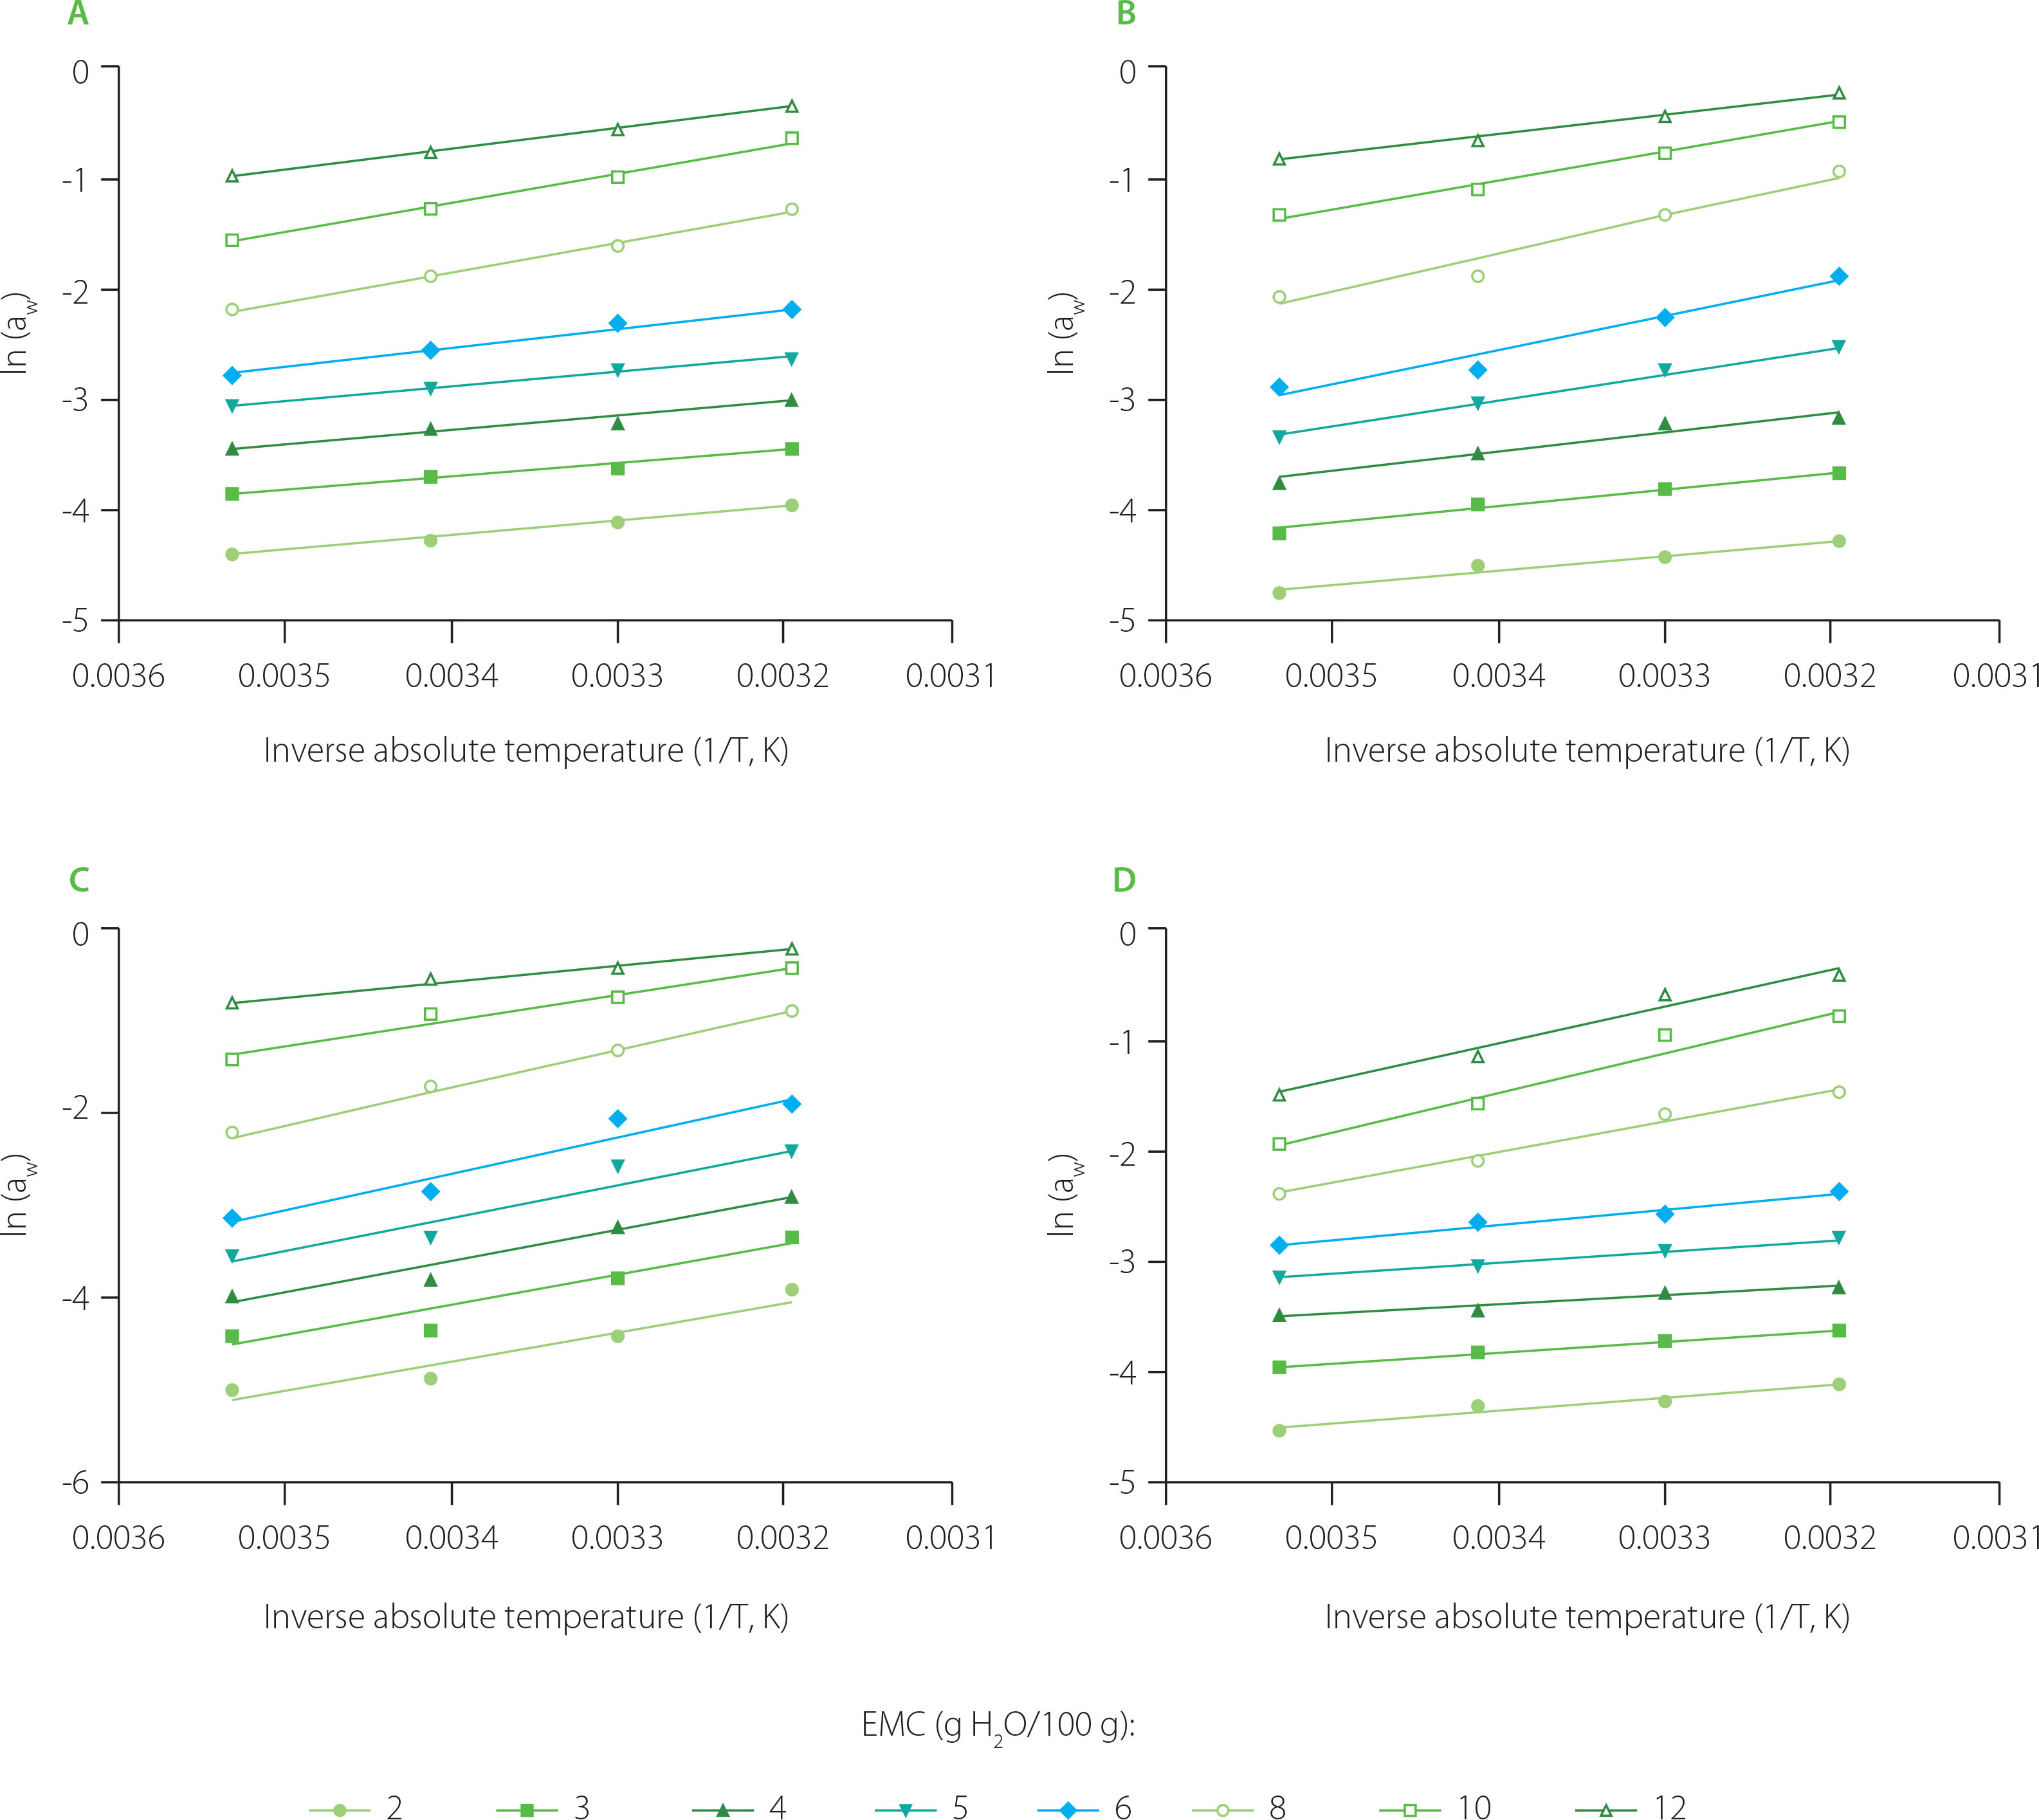
The ΔS0 values ranged from −0.063 to −0.000 for the NXNF blend, from −0.085 to −0.001 for the NXF blend, from −0.102 to −0.041 for the NNF blend, and from −0.086 to −0.002 for the NNNF blend (Table 4). The increase in ΔS0 was observed as the equilibrium moisture content of NXNF, NXF, NNF and NNNF increased with high disorderliness at lower moisture contents. The disorderliness disappeared (low degree of disorderliness) as the curve approached the equilibrium moisture content of 6 g H2O/100 g solids. The low degrees of disorderliness indicate that water molecules are strongly bound to the adsorbent, they are more ordered and less available to participate in deteriorative reactions [Sengev et al., 2018]. The ΔS0 of the flour blends increased up to the equilibrium moisture content of 6 g H2O/100 g solids and became close to constant as the moisture content increased (Table 4). One possible explanation is that the rising moisture content counterbalanced the increased availability of hydrophilic sites, preventing any significant entropy changes in either direction. Similar asymptotic trends have been documented in previous research [Araújo & Pena, 2022; Sarnavi et al., 2023]. The negative ΔS0 values determined in our study may be attributed to either chemical desorption processes or structural modifications of the desorbent, as suggested by Ayala-Aponte [2016] and Sengev et al. [2018].
CONCLUSIONS
The moisture desorption analysis of nixtamalized/non-nixtamalized maize and fermented/non-fermented cassava flour blends showed type II sorption isotherms. The equilibrium moisture content decreased as water activity declined and as temperature increased. When assessing how well different models fit the data, the GAB equation proved to be the most effective for modeling the moisture desorption behavior of these flour blends. The isosteric heat of desorption decreased as equilibrium moisture content increased, while differential entropy of desorption showed the opposite trend, increasing with higher equilibrium moisture contents. For most blends, these respective decreases in isosteric heat and increases in entropy slowed down at an equilibrium moisture content of 5–6 g H2O/100 g solids, after which they exhibited asymptotic behavior. The blends containing nixtamalized maize flour (NXF, NXNF) exhibited lower EMC and reduced isosteric heat vs. the blend of untreated flours (NNNF), suggesting their higher storage stability. To sum up, nixtamalization and fermentation influence the water-binding characteristics of maize and cassava flour blends, with implications for improved drying efficiency and extended shelf-life.