INTRODUCTION
In light of contemporary health challenges, such as the increasing prevalence of lifestyle diseases, functional foods are gaining growing importance as tools for disease prevention and the overall improvement of public health. There is a growing consumer demand for innovative food products that combine high nutritional quality, sensory appeal, and health-promoting properties [Topolska et al., 2021]. Wheat bread, being a staple food in many countries worldwide, represents a promising matrix for the enrichment with bioactive compounds. The source of these bioactive compounds may be, among others, mushrooms [Łysakowska et al., 2023].
Cordyceps sinensis (Berk) Sacc. (CS) (synonym: Ophiocordyceps sinensis (Berk.) G.H. Sung, J.M. Sung, Hywel-Jones & Spatafora) is a parasitic mushroom, also known as “winter worm, summer grass”, naturally occurring in the high-altitude regions of Tibet and the Himalayas [Sharma et al., 2024]. It has been valued for centuries in traditional Asian medicine for its broad spectrum of health-promoting properties. This mushroom is a source of bioactive compounds such as nucleosides (mainly cordycepin and adenosine), polysaccharides (including β-glucans), sterols (including ergosterol), and flavonoids, which exhibit multi-faceted biological activities [Liu et al., 2015; Sharma et al., 2024]. Notably, cordycepin, a nucleoside structurally similar to adenosine, demonstrates anti-inflammatory, immunomodulatory, anticancer, and neuroprotective properties [Chen et al., 2013; Sharma et al., 2024]. By modulating key signalling mechanisms, such as the nuclear factor kappa-light-chain-enhancer of activated B cells (NF-κB) pathway and the mitogen-activated protein kinase (MAPK) pathway, cordycepin reduces neuroinflammatory processes, which are a crucial factor in the pathogenesis of neurodegenerative diseases such as Alzheimer’s and Parkinson’s diseases [Chen et al., 2013]. Moreover, in animal studies, polysaccharides derived from C. sinensis have been shown to regulate intestinal immunity and modulate gut microbiota composition in mice with cyclophosphamide-induced intestinal injury, which may indirectly contribute to the maintenance of gut-brain axis balance [Ying et al., 2020]. In addition, the polysaccharides present in CS may have beneficial effects on cognitive functions and nervous system health [Zhang et al., 2024]. CS is also characterised by a high content of nutritional compounds; per 100 g, it contains 21.9–30.4 g of protein, 24.2–24.9 g of carbohydrates, and 8.62–9.09 g of fat [Hsu et al., 2002]. The relatively high protein content, balanced amino acid profile, presence of unsaturated fatty acids, as well as B-group vitamins (B1, B2, and B12), vitamin E, and essential minerals further enhance the functional properties of C. sinensis [Sharma et al., 2024]. Due to its low energy value (50–70 kcal/100 g of fresh matter) and a high fiber content, CS may support weight management and metabolic regulation [Jędrejko et al., 2024; Liu et al., 2015].
Previous studies have indicated that the enrichment of bread with medicinal mushrooms, such as Inonotus obliquus (chaga), Lentinula edodes (shiitake), Hericium erinaceus (lion’s mane), and Ganoderma lucidum (reishi), leads to significant improvements in its nutritional and health-promoting properties [Kobus et al., 2024; Lu et al., 2021; Łysakowska et al., 2024, 2025]. For instance, wheat starch supplemented with β-glucan derived from L. edodes has been identified as a product with a reduced glycaemic index (GI), making it a suitable component of functional bread and pasta for individuals with carbohydrate metabolism disorders [Zhuang et al., 2017]. Furthermore, the complete genome analysis of L. edodes enabled identifying genes involved in aroma formation and fruiting body autolysis. These genetic features highlight the potential of L. edodes as a valuable additive for enhancing the sensory qualities of bakery products [Salwan et al., 2021]. Additionally, H. erinaceus, which is rich in phenolic compounds and was incorporated into bread by replacing up to 12% of the wheat flour (w/w), significantly increased its antioxidant potential [Łysakowska et al., 2025]. Our previous study further indicated that replacing 3% of wheat flour with G. lucidum powder (w/w) resulted in a significantly higher content of dietary fiber and minerals, particularly calcium and copper, in the bread [Łysakowska et al., 2024]. However, the incorporation of mushrooms into bread may be associated with a deterioration in its baking quality and sensory characteristics. Various biologically active compounds (such as chitin and β-glucans) of mushrooms may hinder gluten network formation in the dough, impede the fermentation process, and negatively affect the expansion of dough pieces, crumb structure, and crust colour [Zhao et al., 2022]. For these reasons, determining the optimal level of supplementation of bread with mushroom, ensuring that, under appropriate technological conditions, obtaining a product with a high nutritional value and health-promoting potential, is required. To date, no studies have evaluated the impact of CS supplementation on wheat dough rheology, bread quality parameters, and its nutritional value. Therefore, the aim of this study was to comprehensively evaluate the effect of replacing wheat flour with CS powder at various levels (3–12%, w/w) on wheat dough rheology, bread baking performance, physical properties, and sensory characteristics, as well as on the chemical composition (including macronutrients, dietary fiber and minerals), total phenolic and flavonoid content, and antioxidant capacity. The study also aimed to determine the optimal substitution level that ensures both technological feasibility and enhancement of the nutritional and health-promoting potential of the bread.
MATERIALS AND METHODS
Materials
Wheat flour type 750, used for bread production, was supplied by Polskie Młyny (Warsaw, Poland). Its gluten index was 99.0±0.3, a falling number was 304±6 s, and an average particle size was 120 µm. Powdered C. sinensis fruiting bodies (CS), used as wheat flour substitute in bread, were sourced from a certified supplier (NatVita, Mirków, Poland). The CS powder had a particle size of 200–300 µm and underwent microbiological control and heavy metal content analysis prior to use. Both raw materials were stored in airtight, dark containers at temperatures below 25°C and a relative humidity (RH) of 60–65%, in accordance with the guidelines from previous studies [Łysakowska et al., 2024].
Determination of farinographic characteristics of dough
The farinographic characteristics were determined using a Farinograph-E (model 8110142, Brabender, Duisburg, Germany), following the Cereals & Grains Association, AACC method 54-21 [AACC, 2010]. The study involved the analysis of dough prepared from wheat flour (control, CON) and from wheat flour substituted with CS powder at levels of 3, 6, 9, and 12% (w/w) (BC3, BC6, BC9, BC12, respectively). The following parameters were assessed: water absorption (WA), defined as the sample’s ability to absorb water; dough development time (DDT), representing the time required to achieve optimal consistency; dough stability (ST), indicating how long the dough maintains its consistency; degree of softening (DS), referring to the loss of consistency during mixing; and farinograph quality number (FQN), which serves as an indicator of the dough’s technological quality. Each measurement was repeated three times.
Bread production
Five bread variants were produced including the control bread (CON from wheat flour, and four types of bread from wheat flour with 3, 6, 9, and 12% (w/w) substitution with CS powder (BC3, BC6, BC9, BC12, respectively). The recipe for each variant included 600 g of flour or a mixture of flour and powder, 9 g of salt (1.5%), 18 g of fresh yeast (3%), and the amount of water determined farinographically according to AACC method 54-21 as water absorption (WA) [AACC, 2010].
The process started with mixing the ingredients in a BEAR Varimixer Teddy 5 L mixer (Varimixer A/S, Copenhagen, Denmark). Mixing was carried out at low speed for 3 min, followed by higher speed until the gluten structure was fully developed. After mixing, the dough was transferred to a proofing chamber (Tefi Klima pro 100, Debag, Bautzen, Germany) and fermented for 90 min at 30°C and an RH of 85±2%. During fermentation, after 60 min, a degassing process was performed to improve dough structure. After fermentation, the dough was divided into portions weighing 290±5 g, which were then manually shaped and placed into baking pans measuring 18×7.5×7 cm. The pans with the dough were left for 30 min in the proofing chamber at 30°C and an RH of 85±2% to ensure optimal volume development. Baking was carried out in a Helios pro 100 oven (Debag) at 230°C for 30 min. Two batches of bread were baked, with each batch consisting of three loaves of each bread variant. After baking, the bread was cooled for 1 h at room temperature, then packed in polyethylene bags and stored at 20°C with an RH of 50% before further analysis.
Chemical composition analysis of raw materials and bread
The chemical composition of the wheat flour, CS powder and bread was analysed, starting with the determination of moisture content using the AACC method 44-15A by drying the samples (3 g) in a laboratory oven (model KBC-100W, WAMED, Warsaw, Poland) at 103±1°C until a constant weight was achieved [AACC, 2010]. The results were expressed as g per 100 g of sample. Next, the ash content was determined using the combustion method (AACC method 08-01) in a muffle furnace [AACC, 2010]. Samples weighing 3 g were placed in porcelain crucibles and ashed at 590°C for 7 h. The protein content was determined using the Kjeldahl method according to the AOAC International standard (method 979.09) [AOAC, 2016] with the Kjeltec™ 8400 apparatus (Foss Analytical AB, Höganäs, Sweden). The nitrogen present in the samples was converted to protein using a conversion factor of N×5.7. The fat content was measured after acid hydrolysis using the Soxtec™ 8000 extraction apparatus (Foss Analytical AB) and n-hexane as the solvent (AOAC method 2003.05) [AOAC, 2016]. The dietary fiber content was analysed using enzymatic methods, following AOAC International guidelines (method 991.43) [AOAC, 2016]. The process involved sequential enzymatic hydrolysis of a 1 g sample using α-amylase, protease, and amyloglucosidase provided by Megazyme Ltd. (Bray, Ireland). The total dietary fiber (TDF), insoluble dietary fiber (IDF), and soluble dietary fiber (SDF) contents were determined. The contents of nutrients were expressed in g per 100 g dry matter (d.m.) of wheat flour, CS powder or bread. All analyses were carried out in triplicate. The content of digestible carbohydrates was calculated as the difference between 100 and the sum of the protein, fat, dietary fiber, and ash content in 100 g d.m. The energy value of the raw materials and bread was determined in kcal per 100 g of product, using the Atwater factors: protein and carbohydrates were assigned a value of 4 kcal/g, fat 9 kcal/g, and dietary fiber 2 kcal/g.
Evaluation of bread baking quality parameters
The bread baking quality was analysed 5 h after cooling. Dough yield was calculated as a percentage by dividing the total weight of the prepared dough by the weight of the flour used. The bread yield was expressed as the percentage ratio of the mass of the baked bread to the mass of flour used for its preparation. Baking loss was determined based on the difference in mass of dough before baking (W2) and the mass of the finished bread (W1). The results were calculated as the percentage mass loss relative to the dough mass according to Equation (1):
The bread volume was assessed by the mustard seed displacement method, AACC method 10-05.01, which allowed for determination of the crumb aeration degree [AACC, 2010]. The specific volume (mL/100 g) was calculated as the ratio of the bread volume to its mass.
To assess the crumb porosity, the microscopic images were taken using a digital microscope VHX-7000N (Keyence, Osaka, Japan) at magnifications ranging from ×20 to ×100. Bread slices approximately 10 mm thick were cut from the central part of the loaf and left to stabilise at room temperature prior to imaging. For each sample, images were acquired from randomly selected areas measuring 3×3 cm in the crumb cross-section under consistent lighting conditions. The analysis included the evaluation of pore size, shape, and distribution, with particular attention to pore connectivity and the presence of irregular voids. Uniformity of pore distribution was also assessed as an indicator of crumb consistency and aeration.
Evaluation of bread colour parameters
The analysis of bread crumb colour was performed using a CR-5 chroma meter (Konica Minolta, Sakai, Osaka, Japan) in the CIELab colour space under D65 light and at a 10° observation angle. The values of lightness (L*), representing the perception of reflected light, the red-green component (a*), and the yellow-blue component (b*) were recorded. Measurements were performed ten times for each sample at different locations within the crumb to ensure the reliability of the results and minimise the impact of material heterogeneity.
Based on the obtained L*, a* and b* data, secondary colour parameters were calculated. The colour intensity (chroma, C) was expressed as the vector modulus in the a*, b* space and was calculated according to Equation (2):
The hue angle (h°), defining the tonal character of the colour, was calculated using the arctangent function of the ratio of the b* and a* components. Saturation (S), which defines the vividness and purity of the colour relative to its lightness, was calculated as the ratio of C to L*. The colour difference (ΔE) between the bread with CS powder (coordinates) and the control bread (coordinates) was calculated according to Equation (3):
The browning index (BI) was calculated using Equation (4):
where x was obtained according to Equation (5):Texture profile analysis of bread
The texture profile analysis (TPA) of the bread was conducted 24 and 48 h after baking. Samples in the form of rectangular prisms with dimensions of 30×30×20 mm were subjected to a double compression test using a Zwick/Roell Z0.5 machine (BT1-FR0.5TN. D14, Ulm, Germany), equipped with a flat cylindrical plunger with a diameter of 50 mm. Compression was performed to 50% of the initial height of the sample at a constant head speed of 1 mm/s. The parameters assessed during the analysis included hardness (expressed in N), elasticity, cohesiveness, and chewiness (expressed in N).
Determination of the element contents of raw materials and bread
The contents of magnesium (Mg), calcium (Ca), potassium (K), iron (Fe), copper (Cu), and zinc (Zn) in wheat flour, CS powder and bread were determined by flame atomic absorption spectrometry (FAAS). The analysis was performed using a Varian SpectrAA 280FS spectrometer (Varian, Mulgrave, VIC, Australia) after microwave-assisted mineralisation of the samples. The digestion was carried out in a CEM Mars Xpress microwave system (CEM Corporation, Matthews, NC, USA) using 4 mL of nitric acid for each 0.5 g of the sample. The mineralised solutions were diluted to 50 mL with deionised water. The FAAS determinations were conducted with an air-acetylene flame and element-specific conditions (wavelength, slit width and lamp current) optimised for each element. Calibration curves were prepared using standard solutions. Selenium (Se), lead (Pb), and cadmium (Cd) were determined using inductively coupled plasma mass spectrometry (ICP-MS) (ICP, Palo Alto, CA, USA). The samples digested as described above were analysed using Varian MS-820 mass spectrometer operated with the following settings: plasma gas flow – 16 L/min, nebuliser gas flow – 0.98 L/min, RF power – 1.38 kW, and sampling depth – 6.5 mm. No collision/reaction cell was used. Selected isotopes were monitored for identification and quantification (78Se, 114Cd, 206Pb, 207Pb, 208Pb). Quantification was performed using external calibration with certified standard solutions. The results for all analysed elements were expressed in mg/kg on a dry matter basis. Quality control included the analysis of blanks, duplicates, and certified reference material (NIST-1577c Bovine Liver, National Institute of Standards and Technology, Gaithersburg, MD, USA) to ensure accuracy and precision.
Extraction and determination of total phenolic content, total flavonoid content and antioxidant capacity of raw materials and bread
To determine the total phenolic content (TPC), the total flavonoid content (TFC) and the antioxidant capacity, the wheat flour, CS powder and bread were extracted using 70% (v/v) ethanol as the solvent. Ten-gram samples were mixed with 90 mL of the solvent and incubated in a water bath at 40°C for 10 h, according to the methodology of Kozłowska et al. [2015]. After extraction, the samples were filtered through filter paper, and the obtained extracts were used for further determinations.
The TPC was determined using the method of Singleton & Rossi [1965] with a Folin-Ciocâlteu reagent. Briefly, 0.1 mL of the extract was mixed with 0.1 mL of the Folin-Ciocâlteu reagent and 1 mL of a 20% (w/w) sodium carbonate solution. After 30-min incubation, absorbance was measured at a wavelength of 700 nm using a Thermo Spectronic Helios Epsilon spectrophotometer (Thermo Electron, Waltham, MA, USA). The results were expressed as mg gallic acid equivalents (GAE) per g of product d.m.
The TFC was determined using the aluminium chloride method according to Quettier-Deleu et al. [2000]. Two mL of the extract were mixed with 0.4 mL of a 5% (w/w) aluminium chloride solution in test tubes. The mixtures were incubated for 30 min at room temperature in the dark. Absorbance was measured at a wavelength of 405 nm using a Thermo Spectronic Helios Epsilon spectrophotometer (Thermo Electron). The results were expressed as mg quercetin equivalents (QE) per g of product d.m.
2,2-Diphenyl-1-picrylhydrazyl (DPPH) radical scavenging activity was determined using the method of Brand-Williams et al. [1995]. An extract (0.5 mL) was mixed with 2 mL of an ethanolic DPPH radical solution (0.025 g DPPH radical in 100 mL ethanol). The absorbance of the reaction mixture was measured at 515 nm using a Thermo Spectronic Helios Epsilon spectrophotometer (Thermo Electron). Trolox (6-hydroxy-2,5,7,8-tetramethylchroman-2-carboxylic acid) was used as a standard, and the results were expressed in mg Trolox equivalents (TE) per g of product d.m.
To determine 2,2’-azinobis-(3-ethylbenzothiazoline-6-sulfonic acid) (ABTS) radical cation scavenging activity, the ABTS radical cation solution was prepared by mixing 0.1920 g of ABTS with 0.0343 g of potassium persulfate, followed by incubation for 16 h in the dark [Re et al., 1999]. The solution was then diluted with methanol to an absorbance of 0.75 at a wavelength of 734 nm. Next, 100 µL of the extract were added to 1.8 mL of the ABTS radical cation solution, mixed, and incubated for 3 min. Absorbance was measured at a wavelength of 734 nm Results were calculated based on a calibration curve plotted for Trolox and expressed as mg TE per g of product d.m.
All analyses were performed in triplicate for each sample.
Sensory analysis
The sensory analysis of bread was conducted by a nine-member panel of experts selected based on their experience in food product evaluation, regular consumption of bakery products, and absence of gluten allergies. The panellists were trained in accordance with a standard method [ISO 8586:2012] and familiarised with the principles of sensory evaluation using a five-point scale. Assessments were carried out under controlled laboratory conditions, ensuring standardised lighting, temperature, and humidity [ISO 8589:2007]. The study received approval from the Bioethics Committee of the University of Life Sciences in Lublin, Faculty of Food Sciences and Biotechnology (Resolution No. UKE/09/2023).
The evaluation included the following sensory attributes: external appearance, aroma, crumb colour, crumb elasticity, taste, and overall rating. The appearance was assessed based on shape, degree of crust browning, and surface uniformity. Aroma was analysed upon unpacking the samples, considering intensity and specific olfactory notes associated with the presence of the CS powder. Elasticity was evaluated by applying pressure to the crumb and observing its ability to return to its original shape, while porosity was determined based on pore size and distribution. Taste was assessed for intensity, balance, and the presence of characteristic notes, whereas overall acceptability incorporated all analysed attributes. Bread was sliced into 1 cm-thick pieces, coded, and presented to panellists in a random order to eliminate systematic errors. Panellists were allowed to cleanse their taste receptors with water and coffee between evaluations. Results were recorded on evaluation sheets using a five-point scale, where 5 indicated the highest quality and 1 the lowest. Each assessed attribute was assigned corresponding reference points, defining specific criteria for each value on the scale. The inclusion of these reference points standardised assessments, enhancing their objectivity and reproducibility.
Statistical analysis
The obtained data were analysed using one-way analysis of variance (ANOVA) with Tukey’s test to assess the significance of differences in physical parameters, chemical composition, sensory attributes, content of elements and phenolics, and antioxidant capacity of bread produced from wheat flour with different levels of CS powder substitution. The differences were considered significant at p≤0.05. The ANOVA of data for wheat flour and CS powder (chemical composition, content of elements and phenolics, and antioxidant capacity) was conducted in a separate set.
Results for each parameter were presented as means from repetitions with standard deviations. The data were analysed using STATISTICA 13 software (StatSoft, Kraków, Poland).
RESULTS AND DISCUSSION
Farinographic properties of the dough
The partial substitution of wheat flour with CS powder significantly affected the rheological properties of dough (Table 1). The observed extension of dough development time compared to the control dough (by approximately 111-121%) indicated a disruption in the kinetics of gluten network formation, which can be attributed to the specific physicochemical properties of the additives [Liu et al., 2020]. Similar results were observed for the dough enriched with other powdered mushrooms including G. lucidum, Agaricus bisporus, and Pleurotus ostreatus (oyster mushroom) [Łysakowska et al., 2024; Majeed et al., 2017; Zhang et al., 2019]. The authors attributed the observed changes in dough development time to the interactions of mushroom-derived polysaccharides and proteins with wheat gluten.
Table 1
Farinographic characteristics of doughs from wheat flour (control, CON) and from wheat flour substituted with Cordyceps sinensis powder at levels of 3, 6, 9, and 12%, w/w, (BC3, BC6, BC9, BC12, respectively).
As shown in Table 2, CS powder was significantly richer in protein and dietary fiber compared to wheat flour. The substitution of wheat flour with such a high-fiber and high-protein ingredient led to a significant (p≤0.05) increase in the water absorption (WA) of the flour (Table 1), which could, in turn, result in higher dough and bread yield (Table 3). The increase in WA was in line with findings from a previous study by Majeed et al. [2017] who prepared wheat dough with oyster mushroom powder.
Table 2
Chemical composition of raw materials including wheat flour and Cordyceps sinensis (CS) powder, and bread from wheat flour (control, CON) and from wheat flour substituted with CS powder at levels of 3, 6, 9, and 12%, w/w, (BC3, BC6, BC9, BC12, respectively).
[i] Data are shown as mean ± standard deviation (n=3). Different lowercase letters (a–e) and uppercase letters (A–B) within a column indicate significant differences according to Tukey‘s test (p≤0.05). TDF, total dietary fiber; IDF, insoluble dietary fiber; SDF, soluble dietary fiber; d.m., dry matter.
An important farinographic parameter defining the quality of flour is dough stability (ST), which measures the dough’s resistance to prolonged mixing. The addition of CS powder to wheat flour reduced values of this parameter, with the most significant changes observed in the samples with substitution levels of 9 and 12% (w/w) (Table 1). A similar trend was observed by Majeed et al. [2017] when adding oyster mushroom powder to wheat flour, as well as by other authors who used various high-fiber additives such as aronia berry powder [Cacak-Pietrzak et al., 2023] and roasted barley coffee [Cacak-Pietrzak et al., 2024]. These changes in dough stability are most likely due to the disruption of the gluten matrix continuity and are positively correlated with the amount of mushroom or other high-fiber additives. When using such additives in wheat dough, it is important to strictly control the mixing time to ensure that, on the one hand, the gluten network develops sufficiently strong and, on the other, it does not suffer mechanical damage.
The substitution of wheat flour with CS powder negatively affected dough softening. The degree of dough softness increased by 91 and 150% for the 3 and 12% (w/w) mushroom powder-supplemented samples, respectively (Table 1). This suggests a weaker protein matrix in the dough prepared with mushroom powder and a greater susceptibility to degradation during mixing. Majeed et al. [2017] also observed this phenomenon and noted the greatest degree of softening in the dough with a 15% oyster mushroom powder addition, while the least softening occurred in the dough made with 100% wheat flour. Similarly, when adding raw materials rich in phenolic compounds (green tea extract) or plant proteins (hemp seed cake), which negatively affect the structure of the gluten network, dough stability was reduced, leading to poorer bread quality [Capcanari et al., 2023; Qin et al., 2022].
The use of CS powder in wheat dough preparation also led to a decrease in the farinograph quality number (FQN). Replacing 9–12% of wheat flour with the mushroom powder resulted in a decrease in the FQN from 94 to 73.
Chemical composition of raw materials and bread
The production of bread from wheat flour with CS powder substitution ranging from 3 to 12% (w/w) resulted in significant changes in its chemical composition, proportional to the enrichment level (Table 2). Due to the high dietary fiber content of the CS powder, enrichment of bread with this powder resulted in a significant (p≤0.05) increase in the total dietary fiber (TDF) content by up to 131% in the BC12 sample. This change was mainly attributed to the increase in the content of insoluble dietary fiber (IDF). In the BC12 sample, the IDF content was more than 2.7 times higher than in the control bread. Much smaller, but statistically significant (p≤0.05) changes were observed in the soluble dietary fiber (SDF) content. It should be emphasised that different medicinal mushroom powders are excellent sources of dietary fiber, especially insoluble fiber, and their addition to bread consistently leads to an increase in fiber content of the final product [Łysakowska et al., 2023]. A similar trend was observed when analysing the protein content changes (Table 2). The lowest 3% (w/w) substitution of wheat flour with the mushroom powder resulted in a bread protein content increase of about 28%, while the 12% (w/w) substitution led to a 51% increase compared to the control sample. CS is distinguished among other medicinal mushrooms due to its particularly high protein content, which in our study was 33.73 g/100 g d.m. For comparison, the protein content of H. erinaceus was reported to be 21.16% d.m. and G. lucidum – 15.49% d.m. [Łysakowska et al., 2024, 2025]. The dominant amino acids in CS proteins are glutamic acid, aspartic acid, lysine, arginine, and histidine [Hsu et al., 2002]. Therefore, the addition of this mushroom can effectively balance the lysine deficiencies in bread, which are typical for cereal-based products. Although not directly demonstrated for CS, phenolic compounds such as chlorogenic acid, caffeic acid, and other hydroxycinnamic derivatives – known to occur in this mushroom [Babotă et al., 2022] – may enhance the bioavailability of basic amino acids, including lysine, by inhibiting Maillard reactions in which these amino acids are consumed as substrates. This mechanism has been observed in polyphenol-rich plant extracts such as those from Coffea arabica, which reduce protein glycation by trapping reactive carbonyl species and protecting amino groups [Rebollo-Hernanz et al., 2019. This is particularly important for individuals on plant-based diets, who often face deficiencies in essential amino acids [Mariotti & Gardner, 2019]. Up until now, protein from legume seeds has been most commonly added to improve the nutritional value and amino acid profile of bread [Bosmali et al., 2025; Han et al., 2024]. However, it is worth noting that there is currently a lack of studies on the digestibility of CS protein, and researching its bioavailability could provide valuable insights into the full nutritional value of this mushroom.
The introduction of CS powder into the recipe also led to an increase in the fat and ash contents of the bread (Table 2). The changes in fat content were slight, but statistically significant (p≤0.05), with the fat content of the bread produced from wheat flour with the highest (12%, w/w) substitution with mushroom powder not exceeding 2 g/100 g d.m. These increases were due to the higher fat and ash contents naturally present in the CS powder compared to wheat flour.
The increase in fiber, protein, and fat contents was correlated with a decrease in the amount of digestible carbohydrates. Compared to the control bread, their levels decreased in the range of 7.34–20.69%, proportionally to the increasing level of mushroom powder replacement (Table 2). The reduction in carbohydrates, which are the primary source of energy in wheat bread, suggests a potential reduction in its glycaemic load. The decrease in carbohydrate content, along with the higher moisture content of the enriched bread, also resulted in a reduction in its energy value. Compared to the control sample, the energy value of the bread with the mushroom powder decreased in the range of 4.42–11.71%, proportionally to the enrichment level (3–12% of what flour, w/w). The reduction in the energy value of bread is particularly significant in the context of the growing demand for products with lower energy values, especially in diets aimed at controlling or reducing body weight [Karunarathna et al., 2024].
Bread baking quality
The substitution of wheat flour with CS powder led to a significant (p≤0.05) increase in bread yield ranging from 4.5 to 7.7%, and the highest bread yield was determined for the BC12 sample (151.65%) (Table 2). This increase can be attributed to the higher water absorption observed in the dough enriched with the mushroom powder. It is important to highlight that the CS powder was rich in dietary fiber and protein, both of which have a high water absorption capacity and likely contribute to the improved water retention in the bread [Łysakowska et al., 2023]. The water absorption of flour plays an important role in the economic aspect of bread production, as it leads to a higher bread yield, which reduces raw material costs and improves production efficiency [Różyło et al., 2015]. Our results are in line with findings from studies that used powders from other mushroom species, such as Flammulina velutipes and A. bisporus, and showed enhanced water absorption in the dough with these powders, leading to an increase in bread yield [Nie et al., 2019; Zhang et al., 2019].
The baking loss, reflecting the mass loss of bread due to evaporation during baking, was lower by 27–39% in the case of the bread enriched with the mushroom powder compared to the control, for which it was 13.19% (Table 3). However, the baking loss of the bread produced from flour containing the mushroom powder at levels of 6, 9 and 12% (w/w) did not differ significantly (p>0.05). The reduced baking losses observed in the study may result from increased moisture retention in the bread, which is consistent with the results of Ammar et al. [2016] and Bojňanská et al. [2024], who showed that additives such as Boerhavia elegana Choisy seed flour, rich in fiber, and turmeric extracts, rich in phenolic compounds can significantly impact dough’s ability to retain water. Similarly, in the case of CS powder, dietary fiber, protein, and bioactive compounds such as phenolics may determine the internal structure of the gluten network. These compounds can interact with proteins and starch, increasing the ability of the bread to bind and retain water. Higher water retention positively affects bread crumb texture, reduces staling, and extends freshness [Dong & Karboune, 2021].
Table 3
Parameters of baking quality of bread from wheat flour (control, CON) and from wheat flour substituted with Cordyceps sinensis powder at levels of 3, 6, 9, and 12%, w/w, (BC3, BC6, BC9, BC12, respectively).
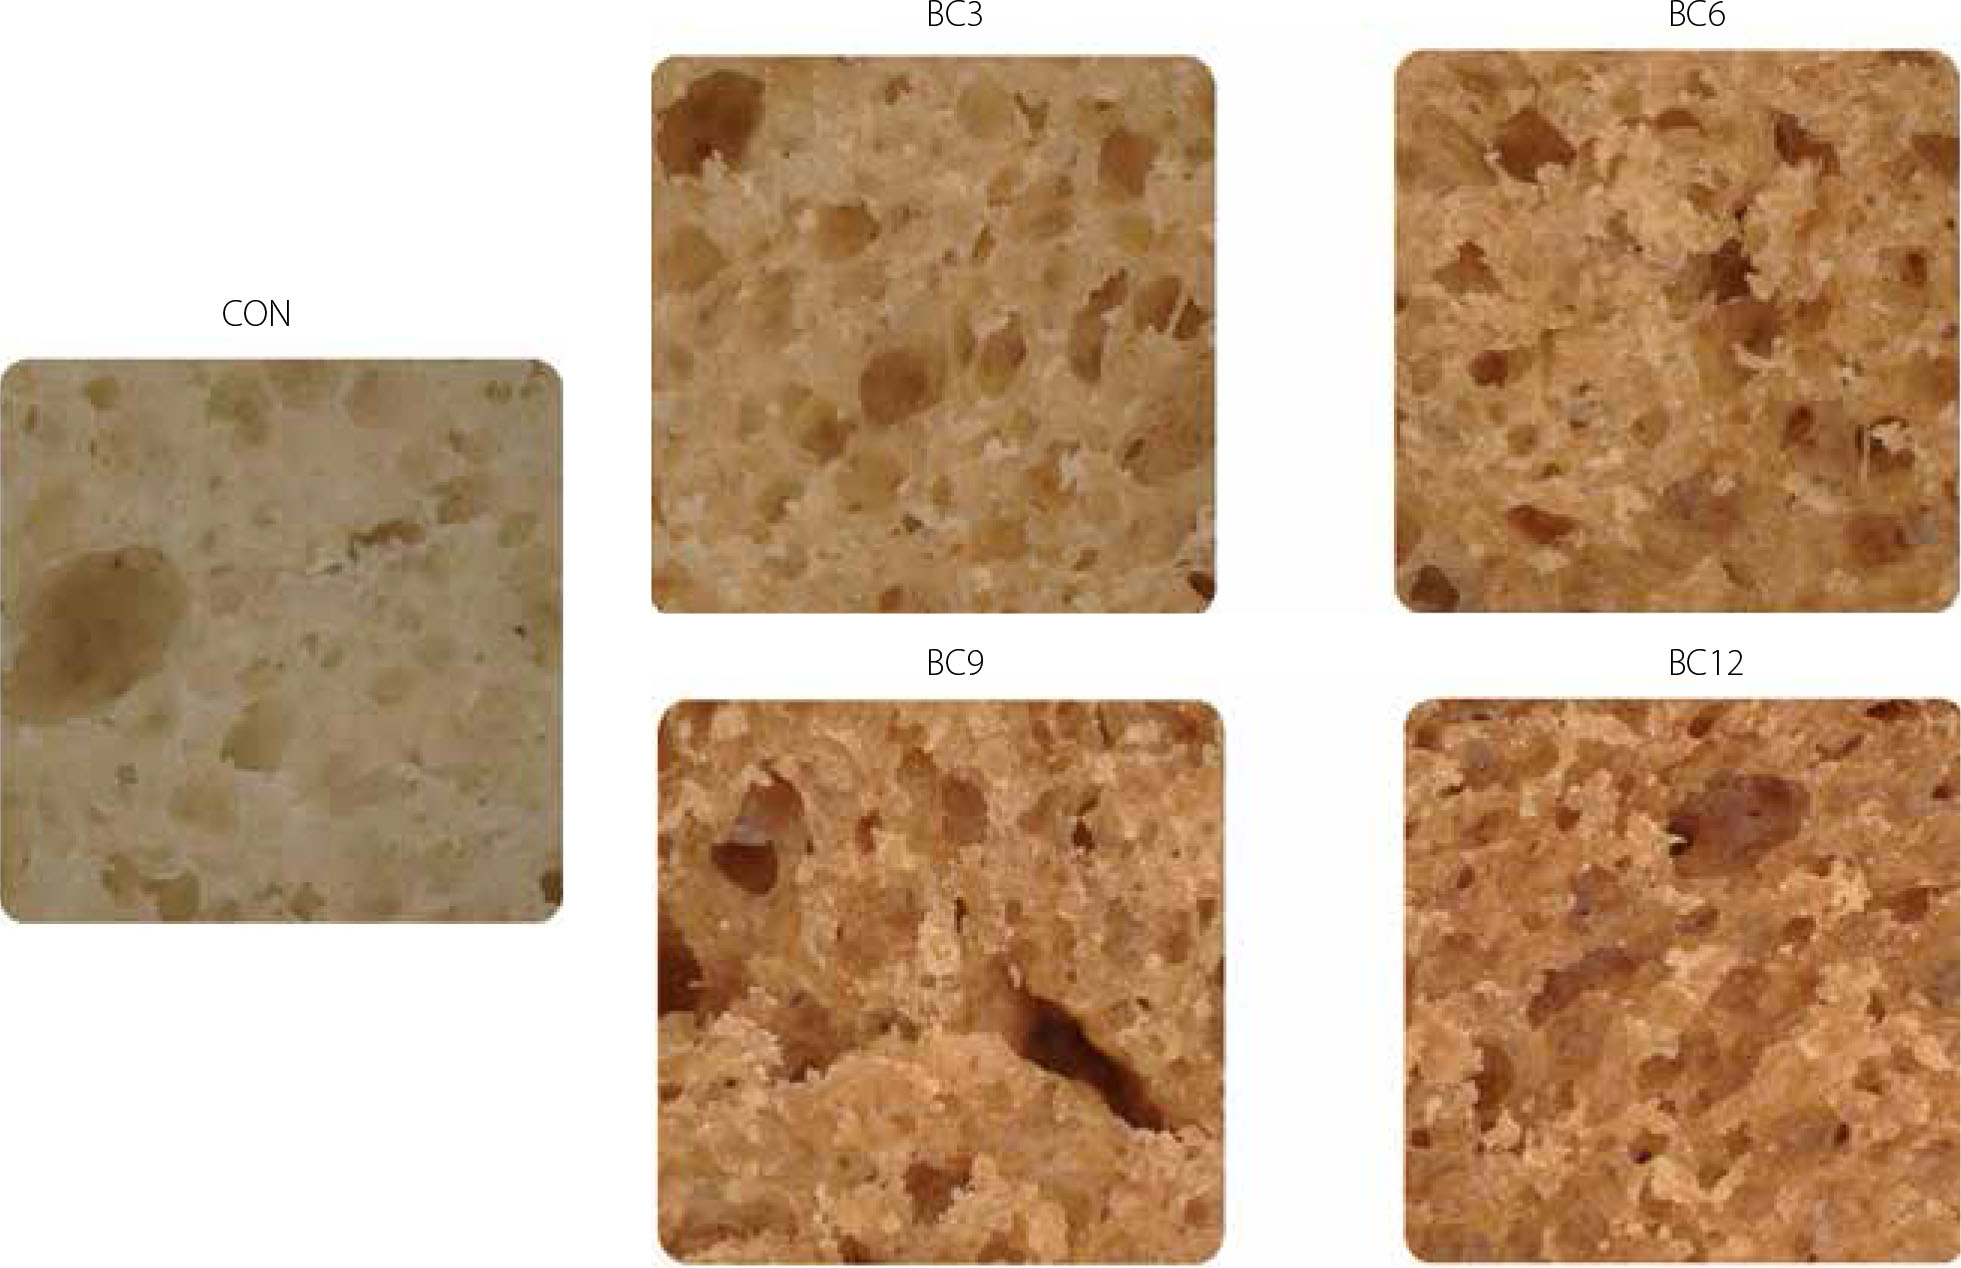
The addition of CS powder negatively affected the bread volume (Table 3). The highest bread volume (350.8 mL/100 g) was determined for the bread prepared with 100% wheat flour. Partial substitution of wheat flour with the mushroom powder led to a decrease in bread volume by 6.2–12.7%, with the most significant changes observed in the BC12 sample. The reduction in bread volume can be explained by the weakening of the gluten network, caused by the introduction of components that do not contain gluten proteins but are rich in ingredients such as fiber and phenolic compounds, which, as studies have shown, may negatively affect the gluten structure [Welc-Stanowska et al., 2023]. Phenolic compounds in plant extracts can interact with gluten proteins, disrupting their intermolecular and intramolecular interactions, which may lead to the weakening of the gluten network in the dough. According to the research by Hanuka-Katz et al. [2022], these interactions may involve non-covalent bonds, such as hydrogen bonds and hydrophobic interactions, which influence dough properties. Furthermore, non-gluten proteins present in the CS powder may compete with gliadins and glutenins, hindering the formation of a strong gluten network and reducing the ability to trap gases during dough fermentation and bread baking. The microscopic images of crumbs showed that enriching bread with the CS powder reduced its porosity (Figure 1). Samples with a higher substitution level of the mushroom powder (BC9 and BC12) had visibly lower porosity than those with lower levels of wheat flour substitution (BC3 and BC6). At the same time, the pores in the BC9 and BC12 samples were more heterogeneous, thick-walled, and relatively densely packed. The crumb of bread with lower CS powder additions (BC3 and BC6) exhibited a more regular pore structure, with a large number of larger, thin-walled pores, indicating slightly better textural properties of these products.
Bread colour
The substitution of wheat flour with the mushroom powder led to a significant (p≤0.05) reduction in lightness (L*) and an intensification of red and yellow tones (higher a* and b* values) in the bread crumb (Table 4). This effect was further confirmed by the increase in the browning index (BI), which indicated a progressive darkening of the crumb with a higher mushroom powder content. A significant (p≤0.05) increase in chroma (C) and a decrease in hue angle (h°) were observed in the samples BC3 to BC12, indicating a progressive intensification and shift of crumb colour towards warmer, red-yellow tones. Additionally, saturation (S) increased with the addition of the CS powder, with significant differences (p≤0.05) noted between the control sample and BC6, BC9, and BC12 samples, and the highest S value recorded for BC12, confirming the enhancement of colour intensity in the enriched breads, as also visually presented in Figure 2. These results are consistent with findings from other studies on the impact of mushroom additions on bread colour, where similar trends were observed; the addition of mushrooms such as I. obliquus, A. bisporus, and G. lucidum to bread formulations resulted in darker product colours, with noticeable changes in the intensity of red and yellow hues [Kobus et al., 2024; Łysakowska et al., 2024; Zhang et al., 2019].
Table 4
Colour parameters of bread from wheat flour (control, CON) and from wheat flour substituted with Cordyceps sinensis powder at levels of 3, 6, 9, and 12%, w/w, (BC3, BC6, BC9, BC12, respectively).
[i] Results are shown as mean ± standard deviation (n=10). Different letters within a column indicate significant differences according to Tukey’s test (p≤0.05). L*, lightness; a*, red-green spectrum; b*, blue-yellow spectrum; ΔE*, colour difference compared to the control; C, chroma; h°, hue angle; S, saturation; BI, browning index.
Figure 2
Appearance of bread from wheat flour (control, CON) and from wheat flour substituted with Cordyceps sinensis powder at levels of 3, 6, 9, and 12%, w/w, (BC3, BC6, BC9, BC12, respectively).
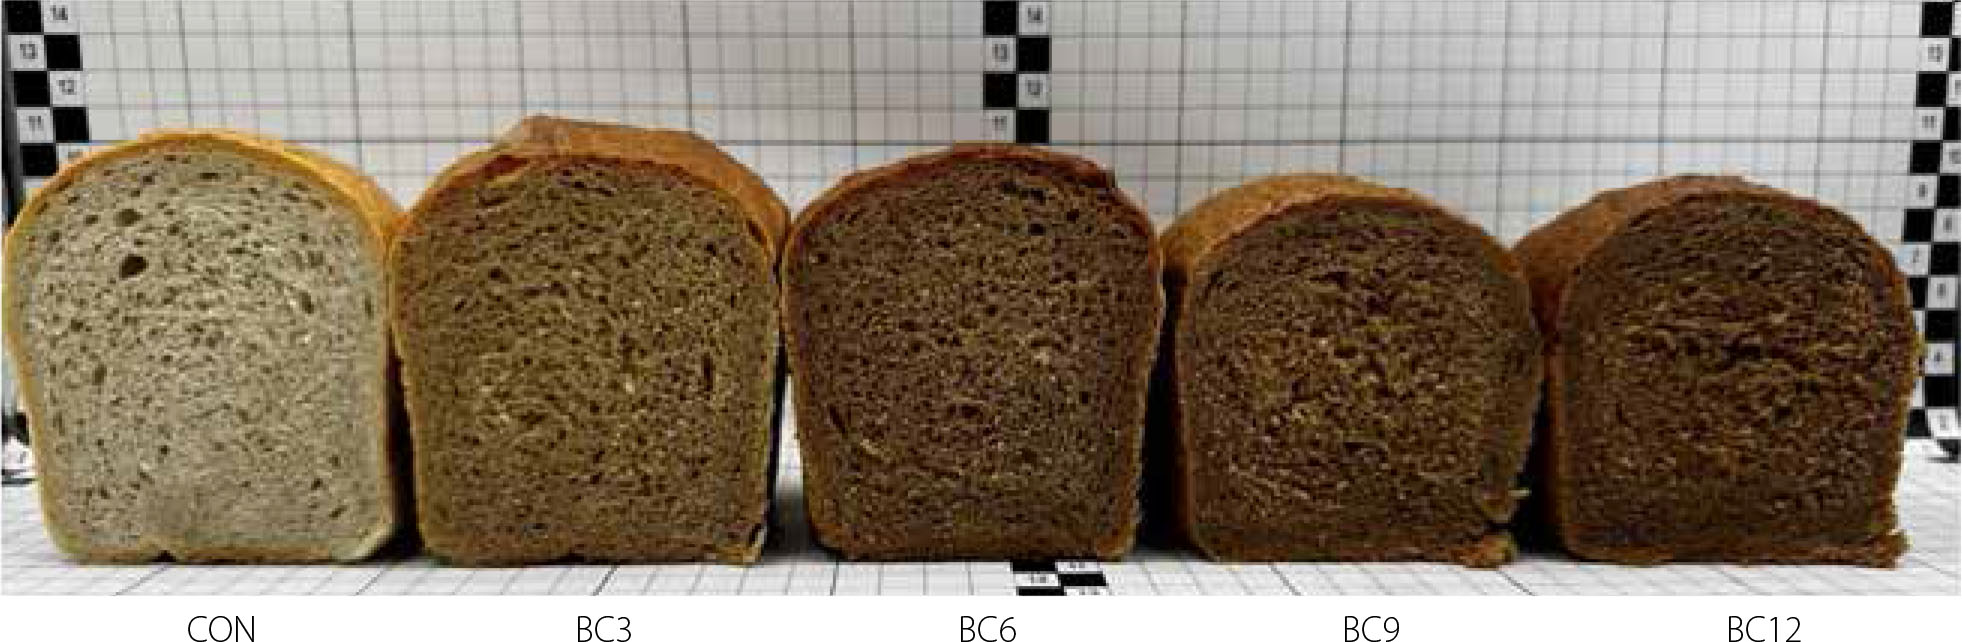
The changes in the colour of the crumb in the wheat bread enriched with CS (Table 4) can be attributed to the presence of natural high-molecular weight pigments, such as melanins [Karmańska & Karwowski, 2022] and phenolic compounds [Babotă et al., 2022]. The phenolic compounds present in the CS powder may inhibit the Maillard reaction and reduce the formation of melanoidins by binding to amines, thereby decreasing their availability for reactions with reducing sugars [Rebollo-Hernanz et al., 2019]. Additionally, phenolic compounds can inhibit oxidoreductases, such as polyphenol oxidase (PPO) and peroxidase (POD), thereby limiting enzymatic browning of the crumb [Karmańska & Karwowski, 2022; Sui et al., 2023; Zhang et al., 2019]. However, in our study, these possible reactions of phenolic compounds did not significantly affect the course of colour changes, which was primarily determined by the high content of pigments (melanins) in the CS powder.
Texture profile of bread
The texture parameters of wheat bread enriched with the CS powder did not show statistically significant differences (p>0.05) after 24 and 48 h of storage (Table 5). The hardness of the crumb, measured 24 h after baking, increased with the growing addition of mushroom powder and was higher compared to the control bread by 4.7–46.9%. This trend may result from the decreased porosity of the bread, which is linked to the deterioration of the gluten network structure and its reduced elasticity [Jødal & Larsen, 2021]. The weakening of the gluten network could be directly due to the lower content of gluten proteins, while the increasing proportion of non-gluten proteins, dietary fiber, and polyphenols may contribute to the disruption and weakening of the gluten network, as shown in previous studies [Franceschinis et al., 2024; Marinopoulou et al., 2024; Zhang et al., 2019]. No significant (p>0.05) changes in bread hardness were observed after 48 h of storage as a function of increasing replacement of wheat flour with the CS powder (Table 5). An earlier study on the influence of bioactive ingredients, such as inulin and fiber from Helianthus tuberosus L., showed that their presence increased the hardness of the crumb through modifications of the water-starch-protein interactions [Franceschinis et al., 2024]. Similar effects were observed with the introduction of hemp proteins, which induced a denser crumb structure of the bread, while simultaneously reducing its elasticity [Marinopoulou et al., 2024]. The changes in crumb elasticity and cohesiveness observed after 24 and 48 h of storage, resulting from the use of the CS powder in bread production, were not statistically significant (p>0.05) (Table 5). Compared to the control bread, chewiness, measured 24 h after storage, was significantly (p≤0.05) higher for the bread produced from flour containing 6% (w/w) CS powder and more, while after 48 h, statistically significant differences in this parameter were observed only at the 12% (w/w) fortification level. The increase in chewiness in the bread enriched with the CS powder correlated with a previous report on the impact of high-fiber additives, such as carob extract, on the textural properties of bread [Zahorec et al., 2024].
Table 5
Parameters of texture profile of bread from wheat flour (control, CON) and from wheat flour substituted with Cordyceps sinensis powder at levels of 3, 6, 9, and 12%, w/w, (BC3, BC6, BC9, BC12, respectively), determined 24 and 48 h after baking.
[i] Data are shown as mean ± standard deviation (n=7). Different lowercase letters (a–d) within a column indicate significant differences according to Tukey’s test (p≤0.05). No significant (p>0.05) differences were found between determinations performed 24 and 48 h after baking (separately for each parameter and product).
Element content of raw materials and bread
The introduction of the CS powder into bread significantly enriched its mineral profile (Table 6). Compared to wheat flour, the mushroom powder contained approximately 10 times more magnesium, 9 times more calcium, and 7.5 times more potassium. It also exhibited significantly higher levels of trace elements such as iron, copper, zinc, and selenium, while showing only trace amounts of heavy metals (lead and cadmium), which ensures its health safety. Compared to the control sample, the bread produced with 12% (w/w) wheat flour substitution with the mushroom powder contained over three times more magnesium, which constitutes 14.7% of the recommended daily allowance (RDA) for this element, as established by the Institute of Medicine of the National Academies, USA [Institute of Medicine, 2006]. Similarly, the calcium content increased 2.8 times, meaning that the consumption of BC12 bread covers 5.5% of the RDA for this mineral. The potassium content increased 1.5 times, reaching 15% of the RDA. A significant increase (p≤0.05) was also observed in the trace elements. Even at the lowest 3% (w/w) substitution level of wheat flour with the CS powder, the bread became a good source of iron, zinc, and selenium (covering >15% of the RDA for these elements). Fortification at levels of 6–12% (w/w) resulted in bread with a high copper content (>30% RDA). At the same time, the content of lead and cadmium, remained at safe levels. The Pb content in the bread produced from flour containing 12% (w/w) of the CS powder was 0.0104 mg/100 g, which corresponded to only 2.43% of the acceptable daily intake (ADI) established by the joint Food and Agriculture Organization (FAO) and World Health Organization (WHO) expert committee [FAO/WHO, 2001]. The Cd content of this bread type was minimal (0.0032 mg/100 g), accounting for 5.33% of the ADI. This indicates that the use of CS in bread production does not increase the risk associated with the presence of these metals and ensures the full health safety of the product. The fortification of bread with elements such as iron and zinc, whose bioavailability in wheat-based products is limited due to the presence of phytates, becomes especially significant in the context of preventing deficiencies of these elements in groups at risk of their shortages [Gupta et al., 2024].
Table 6
Content of selected elements (mg/100 g d.m.) in raw materials including wheat flour and Cordyceps sinensis (CS) powder, and bread from wheat flour (control, CON) and from wheat flour substituted with CS powder at levels of 3, 6, 9, and 12%, w/w, (BC3, BC6, BC9, BC12, respectively).
[i] Results are shown as mean ± standard deviation (n=3). Different lowercase letters (a–e) and uppercase letters (A–B) within a column indicate differences according to Tukey’s test (p≤0.05). d.m., Dry matter; ND, not detected; RDA, recommended dietary allowance [Institute of Medicine, 2006]; ADI, acceptable daily intake [FAO/WHO, 2001].
Total phenolic content, total flavonoid content and antioxidant capacity of raw materials and bread
The incorporation of the CS powder into bread significantly enhanced the TPC, TFC and antioxidant capacity in DPPH and ABTS assays compared to the control bread (Table 7). Flavonoids were undetectable in both wheat flour and the control bread but TFC exhibited an increase in the bread produced from flour with increasing levels of the mushroom powder. For instance, the sample with the highest mushroom powder substitution (BC12) demonstrated an over 25-fold increase in TFC compared to the samples with lower supplementation level (e.g., BC3). TPC also increased markedly in the enriched breads. BC12 showed an 11.2-fold increase in TPC relative to the control and a 39.7-fold increase compared to wheat flour. Statistical analysis confirmed significant (p≤0.05) differences between samples. Antioxidant capacity, assessed via the DPPH assay, improved proportionally with the increase in the amount of mushroom used in the production of the breads. BC12 exhibited a 52% higher DPPH radical scavenging activity than the control and a 110% increase over wheat flour. A comparable pattern was observed in the ABTS assay, where antioxidant capacity in BC12 more than doubled compared to the control and increased nearly fourfold relative to wheat flour. Although the antioxidant capacity of the enriched breads remained lower than that of pure CS powder (e.g., approximately 33% lower for BC12), the results highlight the viability of enriching bread with mushroom, even at low levels of flour replacement, in enhancing its functional properties. These trends align with studies on bread enriched with other medicinal mushrooms (e.g., chaga and shiitake) or plant-derived antioxidants (e.g., green tea) where phenolic enrichment correlated with improved free radical-scavenging capacity [Chen et al., 2022; Kobus et al., 2024; Lu et al., 2021]. Notably, the magnitude of improvement observed here exceeds reports for Terfezia boudieri (desert truffle), where a 5% supplementation increased TPC fivefold [Najjaa et al., 2021], underscoring CS as a potent functional ingredient for bakery applications.
Table 7
Total phenolic content, total flavonoid content and antioxidant capacity of raw materials including wheat flour and Cordyceps sinensis (CS) powder, and bread from wheat flour (control, CON) and from wheat flour substituted with CS powder at levels of 3, 6, 9, and 12%, w/w, (BC3, BC6, BC9, BC12, respectively).
[i] Results are shown as mean ± standard deviation (n=3). Different lowercase letters (a–e) and uppercase letters (A–B) within a column indicate significant differences according to Tukey’s test (p≤0.05). QE, quercetin equivalent; GAE, gallic acid equivalent; TE, Trolox equivalent; DPPH assay, assay with 2,2-diphenyl-1-picrylhydrazyl (DPPH) radicals; ABTS assay, assay with 2,2’-azinobis-(3-ethylbenzothiazoline-6-sulfonic acid) radical cations; d.m., dry matter; ND, not detected.
Sensory scores for bread
The substitution of wheat flour with the CS powder in amounts ranging from 3–12% (w/w) did not significantly impair the sensory quality of the bread (Table 8). Although generally, an increase in the level of the mushroom powder was associated with a slight deterioration in external appearance, aroma, taste, and crumb elasticity of the bread, leading to a decrease in the overall rating, the differences in the evaluation of individual sensory attributes were statistically insignificant (p>0.05). Moreover, according to expert evaluations, the use of the mushroom powder in bread recipe did not significantly (p>0.05) change the crumb colour. However, even a wheat flour substitution with CS powder at a level of 12% (w/w) resulted in bread that was still fully acceptable from a sensory perspective. The characteristic mild taste of CS contributed to its high acceptability. Comparing these results with studies on bread enriched with G. lucidum powder, where doses above 6% led to a drastic decline in sensory scores due to a bitter taste [Łysakowska et al., 2024], CS showed a significantly higher potential for bread substitution and, therefore, can be used in relatively high doses. Similarly, 5–10% flour replacement with P. ostreatus powder ensured high acceptability of the bread, but its higher contents negatively impacted the texture [Wahab et al., 2022]. Furthermore, studies on bread enriched with H. erinaceus powder suggested that the best-quality bread could be obtained using a moderate substitution level (6–9%) [Łysakowska et al., 2025].
Table 8
Sensory evaluation of bread from wheat flour (control, CON) and from wheat flour substituted with Cordyceps sinensis (CS) powder at levels of 3, 6, 9, and 12%, w/w, (BC3, BC6, BC9, BC12, respectively).
CONCLUSIONS
The research has shown that C. sinensis exhibits high potential as a functional ingredient in wheat bread. The substitution of 3–12% (w/w) of wheat flour with the mushroom powder modified the nutritional value of the bread by increasing its dietary fiber, protein, and selected mineral contents, while also lowering the levels of digestible carbohydrates. Incorporation the CS powder into bread recipe increased the content of phenolic compounds of the product, significantly enhancing its antioxidant capacity. The texture parameters of the bread generally did not change significantly with increasing levels of the mushroom powder in the recipe, with only a notable increase in hardness occurring at the level of 12% (w/w) wheat flour substitution, while a 6–12% (w/w) substitution improved its chewiness. Sensory analysis confirmed the high acceptability of the enriched bread, with even the highest 12% (w/w) wheat flour substitution with the mushroom powder resulting in bread with good sensory quality, as indicated by high sensory scores. The use of the CS powder in bread fortification highlights its great potential in the production of foods with improved health-promoting properties that can help prevent lifestyle-related diseases. The research findings encourage further application of this ingredient in various bakery products and other categories of functional foods.