INTRODUCTION
Corn is an important food source in the world. There has been a growing interest in corn products because they are gluten-free and also dense in antioxidants [Blanch et al., 2023]. Corn is rich in phenolic acids such as gallic acid, ferulic acid, vanillic acid, tannic acid, caffeic acid, o-coumaric acid, cinnamic acid, and salicylic acid [Pandey et al., 2013] and also contains flavonoids including anthocyanins in the case of pigmented grain varieties [Magaña-Cerino et al., 2020]. Carob flour, another gluten-free product, has a significant health-promoting value due to its high contents of phenolic compounds and dietary fiber [Ortega et al., 2011]. This insoluble and non-fermentable fiber (cellulose, hemicellulose, and lignin) exerts anti-diabetic and anti-obesity effects [Dahmani et al., 2023]. Durazzo et al. [2014] reported that carob flour with a high total phenolic content and antioxidant properties offered the potential to be a valuable food ingredient. Carob can also be considered as a natural sweetener [Benković et al., 2017].
A growing interest has recently been observed in developing gluten-free bakery products, due to the increasing number of patients with celiac disease and other gluten-related diseases in the world [Šmídová & Rysová, 2022; Xu et al., 2020]. However, the variety of gluten-free products is limited because of the difficulties in manufacturing products with the desired physicochemical and sensory properties. To improve these properties, new sources of gluten-free flour, such as carob flour, and appropriate technological processes are sought, e.g., Yalcin & Basman [2008] reported that the gelatinization process of corn flour, gum addition (locust bean gum and xanthin gum), and transglutaminase caused an improvement in the quality of corn noodles. Różyło et al. [2017] used carob fiber (0–5%) in gluten-free bread made from rice flour, corn flour, and buckwheat flour to increase dietary fiber content because of its generally low content in gluten-free products. They reported that carob fiber increased the volume and springiness while decreasing the hardness of bread. In addition, it affected the color of the bread by decreasing the lightness and yellowness and increasing the redness. Igual et al. [2024] investigated the effect of carob flour (5–12.5%) on the quality of gluten-free corn extruded products. They reported that carob flour led to an increase in starch and fiber contents, while reducing hardness. Thus, this product could be a viable source of fiber after extrusion. Preichardt et al. [2011] reported that xanthan gum (0.2–0.4%) increased the specific volume and decreased the firmness of cake including rice and maize flour (50/50, w/w). In turn, Berk et al. [2017] investigated the effects of carob flour (10%, 20%, 30%) and gums (xanthan gum, guar gum) on the quality of the gluten-free cake including rice flour and reported that 30% carob flour and xanthan gum ensured optimum hardness. Ammar et al. [2021] optimized a gluten-free sponge cake formulation using combinations of rice flour, maize flour, and whey protein and reported that whey protein caused higher volume, reduced baking loss, and increased hardness. Paesani et al. [2021] investigated the effect of stabilized wholegrain maize flour on the quality of gluten-free layer cakes. They determined that the gluten-free cake including extruded whole grain maize flour had a lower specific volume and higher hardness than the gluten-free cake including non-extruded wholegrain maize flour. Previous studies have only investigated a few gluten-free flours including those made of rice, millet, chickpea, buckwheat, and maize starch [Xu et al., 2020]. Several gums were also added to the cookies, cakes, and crackers to improve final product quality. Despite the outcomes of these studies, further research is necessary to develop more preferable, and nutritious gluten-free muffins.
In recent years, new gluten-free flours, processing aids, and physical treatments have been used to get closer to gluten-containing products. Flours or starches do not exhibit gluten properties. Adding protein, hydrocolloids, emulsifiers, physical treatments, and enzymatic technology has created a gluten network. Hence, gluten-free products have improved but still differ from wheat-based products in terms of appearance, texture, and sensory properties. Corn flour and carob flour represent good potential in a gluten-free product technology; however, their presence in the market is still limited [Gasparre & Rosell, 2023]. Some studies have been conducted on gluten-free cake production. However, there is no study on the production and quality characteristics of gluten-free cakes including corn and carob flour. Therefore, this research aimed to develop high-volume and score, and good-texture gluten-free cakes with vital minerals, essential fatty acids, and antioxidants at high levels, in order to expand gluten-free food options for celiac patients. Additionally, I used buffalo cream as a fat replacer in the cake to decrease fat content. Buffalo cream is a traditional product of Afyonkarahisar (Turkey). Afyonkarahisar is a city famous for producing poppy products. It is also the place where buffalo breeding is highest. The buffalos here are fed with poppy pulp. Therefore, the flavor of the Afyonkarahisar buffalo cream differs from others and has received a geographical indication.
MATERIALS AND METHODS
Materials
Corn flour (containing 11.4 g of moisture, 4.9 g of protein, 2.5 g of lipids, 79.9 g of total carbohydrates, 3.3 g of total dietary fiber, and 1.3 g of ash per 100 g), carob flour (3.8 g of moisture, 4.6 g of protein, 0.6 g of lipids, 89.9 g of total carbohydrates, 39.8 g of total dietary fiber, 2.1 g of ash per 100 g), sucrose, baking powder, salt and UHT milk (3.3 g of lipids per 100 g) were purchased from a local market in Afyonkarahisar. Buffalo cream (65 g of lipids per 100 g) was bought from Afyon Kocatepe University buffalo breeding farm. Egg white powder (8.3 g of moisture, 79.3 g of protein, 1 g of lipids, 5.4 g of total carbohydrates, 6 g of ash per 100 g) was supplied from Kor AGRO Organik Gıda Enerji San. Tic. A.Ş. (Izmir, Turkey). The macronutrient composition of the materials was determined using methods described below.
Preparation of cake
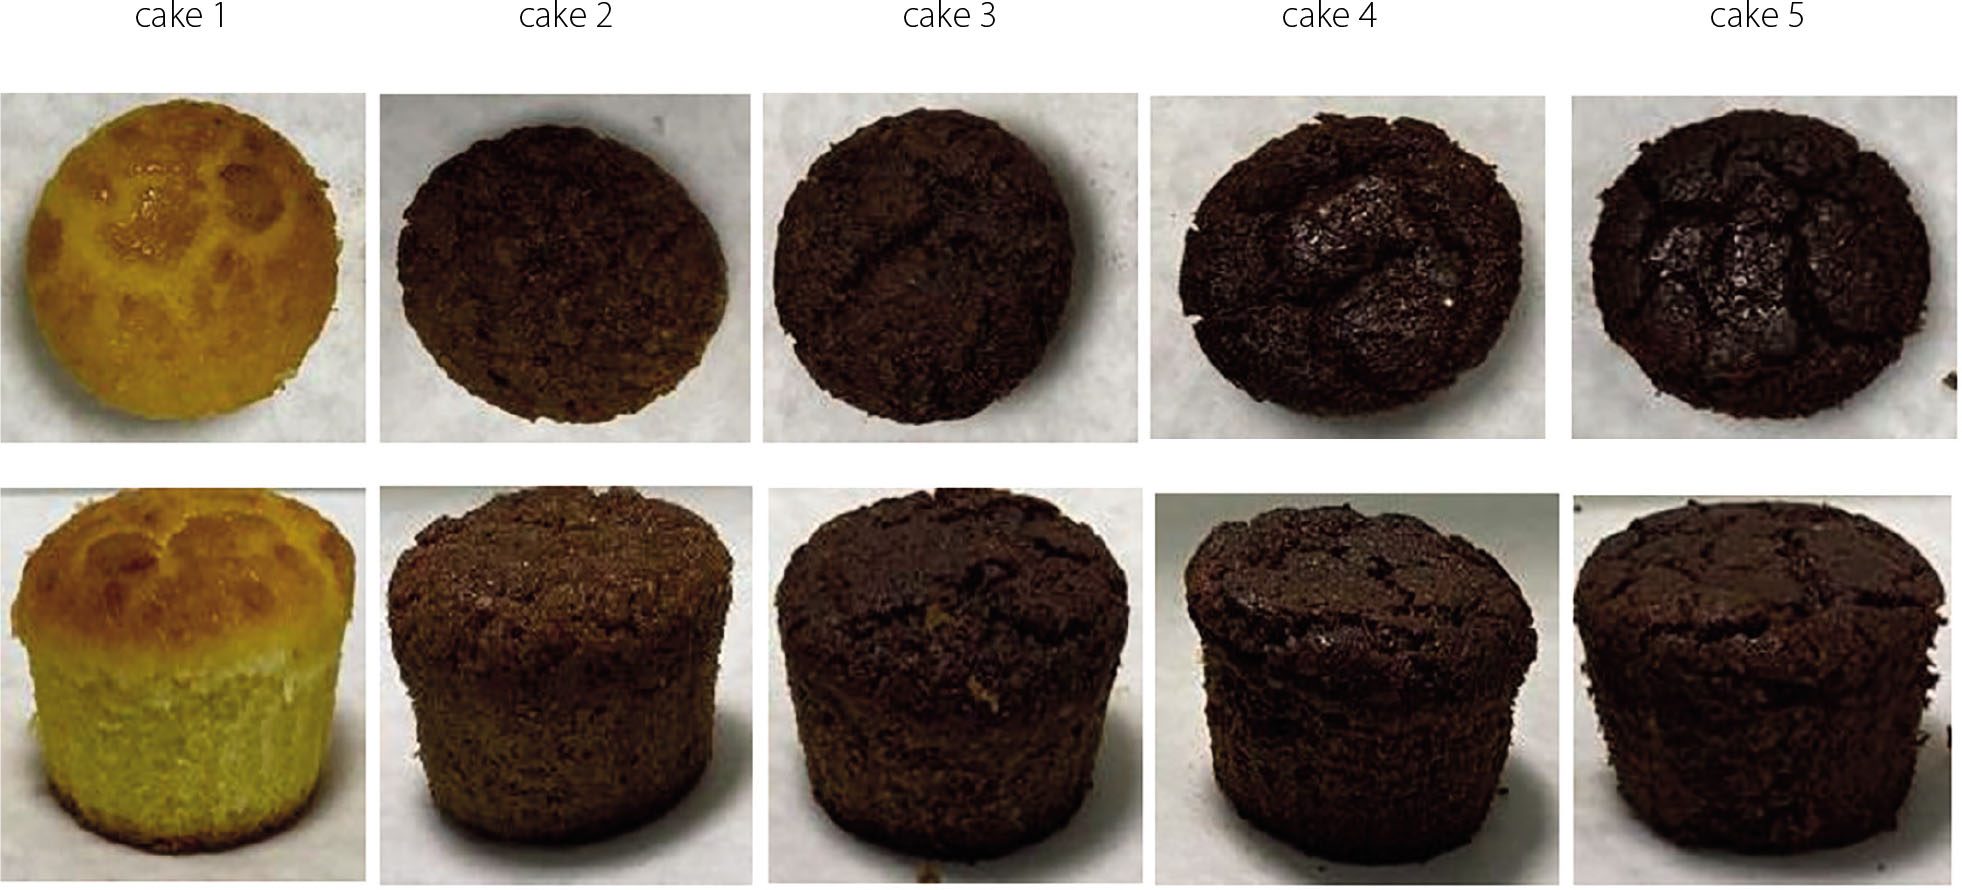
The cake was produced according to the method stated by the American Association of Cereal Chemists (AACC) No. 10-91 [AACC, 2000] with some modifications. For this purpose, 100 g of sucrose, 9 g of egg white powder, 112 g of milk, 3 g of salt, 5 g of baking powder, 40 g of buffalo cream, and 100 g of corn flour were used in the control (cake 1). Unlike the control sample, in cake 2, 90 g of corn flour and 10 g of carob flour were used instead of 100 g of corn flour; in cake 3, 80 g of corn flour and 20 g of carob flour were used instead of 100 g of corn flour; in cake 4, 70 g of corn flour and 30 g of carob flour were used instead of 100 g of corn flour; while in cake 5, 60 g of corn flour and 40 g of carob flour was used instead of 100 g of corn flour. Boiled milk, egg white powder, sucrose, and buffalo cream were mixed in a mixer (Arzum, Ningbo, China) at a low speed for 1 min. Afterward, the sides of the container were scraped and mixed at a high speed for 4 min. Then, baking powder, salt, and flour were added to the mixture, which was then mixed at a low speed for 1 min. The sides of the container were scraped and mixed at high speed for 2 min. Finally, the sides of the container were scraped again, and the process was completed by mixing for 1 min at a low speed and for 2 min at a high speed. The resulting dough was weighed in equal amounts (60 g) and divided into molds. It was then baked at 175°C for 35 min in the conventional oven (Seg, Manisa, Turkey). After the baked cakes were prepared, they were left in the container to cool for about 30 min. The production was made in duplicate. Six cakes were baked in each batch. The appearance of the gluten-free cakes is shown in Figure 1.
Measurement of cake volume
The volume of the cakes was determined according to the rapeseed displacement method. The empty pan was filled with rapeseed. The empty pan volume (V1) was measured based on the rapeseed volume as determined with a graduated cylinder. The cake was placed in the pan. The rest of the pan’s volume (V2) was filled with rapeseed, and the rapeseed volume was determined with a graduated cylinder. The cake volume was calculated using Equation (1):
Determination of the volume index of cakes
The method of the AACC No. 10-91 [AACC, 2000] was used to determine the volume index of the cakes. The cake was cut vertically through the center. The template was used for measuring the cake heights at three different points (B, C, D) along the crosssectioned cakes. The volume index was calculated as a sum of B, C, and D, where B was the height of the cake at the points 2.5 cm away from the center towards the left side of the cake, C was the height of the cake at the center point, and D was the height of the cake at the points 2.5 cm away from the center towards the right side of the cake.
Determination of the baking loss of cakes
Percentage baking loss of the cakes during baking was calculated using the weight of the cake batter (W1) and the weight of the cake after baking (W2), using Equation (2):
Determination of color values of cakes
The color coordinates of the cakes were measured in the CIELab space using a chromameter (Konica Minolta Cr-400/410, Osaka, Japan). The viewing angle of the instrument was 0°, and the light source was a pulsed xenon lamp. The chromameter was calibrated using standard white and black calibration plates. The coordinates L* describing the brightness, a* varying from green to red, and b* varying from blue to yellow were measured. The cake crumb and crust’s total color change (ΔE) was determined using Equation (3), where the suffix “0” denotes the control sample (corn cake without carob flour):
Texture analysis of cakes
The texture analysis of the cakes was performed 24 h after baking. The cakes’ hardness, springiness, cohesiveness, chewiness, and resilience were determined using a TA.XT plus texture analyzer (Stable Micro Systems, Godalming, England) equipped with a 50 N load cell and a cylindrical probe 36 mm in diameter. Textural parameters were obtained from two-bite force–time curves. Hardness was defined as the peak force of the first compression cycle. Springiness was defined as the height at which the sample sprang back after the first compression. Cohesiveness was defined as the ratio of the work during compression of the second cycle divided by that of the first cycle. Chewiness was defined as the product of hardness, cohesiveness, and springiness. Resilience was defined as the ratio of work returned by the sample as compressive strain is removed to the work required for compression. Center of cakes was cut into cube shapes having dimensions of 25×25×25 mm and was compressed to 40% strain at a speed of 5 mm/s. The pre-test and post-test speeds were at 1 mm/s and 5 mm/s, respectively.
Measurement of pH of cakes
pH measurement of the cakes was realized according to the method reported by Žilić et al. [2016]. Ground cakes (0.4 g) were mixed with 20 mL of deionized water for 3 min. The mixture was kept at an ambient temperature for 60 min to separate solid and liquid phases. The pH of supernatants was measured with a pH meter (Testo 205, Titisee Neustadt, Germany).
Determination of moisture, protein, lipid, total ca rbohydrate, total dietary fiber, and ash contents of cakes
The moisture, protein, lipid, and ash contents of the cakes were determined according to internationally approved method 44–01.01 [AACC, 2010], Dumas method reported by Shea & Watts [1939], Turkey standard (TS) – ISO 11085 method [TS EN ISO, 2016], and method 08–01.01 [AACC, 2010], respectively. The total carbohydrate content of the cakes was calculated as 100−(g of moisture + g of protein + g of lipids + g of ash per 100 g). The total dietary fiber content of the cakes was determined based on the AOAC International 985.29 method [AOAC, 1992] using the total dietary fiber assay kit (Megazyme, Bray, Ireland). The principle of the method was based on the use of α-amylase, protease, and amyloglucosidase under different incubation conditions to remove starch and protein components, followed by gravimetric determination of the total dietary fiber content. Results of analyses were expressed as g per 100 g of cakes.
Determination of mineral content of cakes
Ground cakes (1 g) were added to 65% HNO3 (8 mL) and 30% H2O2 (2 mL) and heated to 110°C for 15 min and then left in the microwave oven (Milestone start D, Sorisole, Italy) for 15 min. The cakes’ phosphorus, magnesium, calcium, sodium, and potassium contents were determined according to the method reported by Gopalani et al. [2007] using an inductively coupled plasma–optical emission spectrometer (ICP-OES) Optima 8000 (Perkin Elmer, Waltham, MA, USA). The phosphorus, magnesium, calcium, sodium, and potassium wavelengths were 214.9, 279.0, 315.8, 589.0, and 766.4 nm, respectively. Mineral contents were expressed as mg per kg of cakes.
Analysis of the fatty acid composition of cakes
Lipids from ground cakes were extracted, and their fatty acids were methylated according to the AOAC 996.01 method [AOAC, 1996]. The derivatization solution was the methanolic HCl solution (1.5 M), and the reaction was performed at derivatization 80°C for 2 h. Fatty acid methyl esters were analyzed using a gas chromatography-mass spectrometry (GC-MS) technique by Agilent 7890A GC and Agilent 5975 C XL EI/CI MS (San Diego, CA, USA) equipped with a DB WAX column (50 m × 0.20 mm, 0.20 μm; Agilent). Detector and injector temperature was 240°C. The oven starting temperature was 80°C. After waiting at 60°C for 4 min, it was increased to 175°C with an increase of 13°C per min. This temperature was kept for 27 min. Then, 215°C was reached with an increase of 4°C per min, and was kept for 5 min. Thereafter, 240°C was reached with an increase of 4°C per min and kept for 15 min. Identification of individual compounds was performed using a reference mixture of fatty acid methyl esters (FAME mixture, Supelco, Bellefonte, PA, USA). The content of individual fatty acids was expressed as g per 100 g of total fatty acids.
Determination of the α-tocopherol content of cakes
Ground cakes (2 g) were added to 100% n-hexane (40 mL), mixed in a vortex for 5 min, sonicated for 120 min, and centrifuged at 8,965×g for 5 min. The supernatant was removed and dried in a rotary evaporator at 30°C. The extract was then dissolved in 4 mL of n-hexane and used for analysis. α-Tocopherol content was determined by high-performance liquid chromatography (HPLC) analysis. The instrument (Agilent 1260 infinity series) with a diode array detector was connected to a Beckman coulter silica column (250×4.6 mm, 5 μm; Beckman, Brea, CA, USA). The mobile phase consisted of n-hexane (997.5 mL) and isopropyl alcohol (2.5 mL) and was used with a flow rate of 1 mL/min. Column temperature was 35°C. The peak was identified by comparing the retention time with the α-tocopherol standard. Quantification of α-tocopherol was performed by using a calibration curve of α-tocopherol standard. α-Tocopherol content was expressed as mg per kg of cakes.
Analysis of the phenolic compound profile of cakes
Ground cakes (2 g) were added to 96% ethanol (10 mL), and mixed in a homogenizer for 2 min. The mixture was kept in a water bath at 45°C for 15 h. After that, it was centrifuged at 2,540×g for 5 min. The supernatant was removed and dried in a rotary evaporator at 45°C. The extract was then dissolved in 1 mL of methanol and used for analysis. Phenolic compounds of the cakes were analyzed in the gradient system of a mobile phase (solvent A: 0.1% (v/v) phosphoric acid and solvent B: 100% acetonitrile, at 0 min volume ratio of 83:17, 7 min – 85:15, 20 min – 80:20, 24 min – 75:25, 28 min – 70:30, 30 min – 60:40, 32 min – 50:50, 36 min – 30:70, 40 min – 83:17) using Agilent 1260 infinity series HPLC equipped with a diode array detector and ACE Generix C18 column (250×4.6 mm, 5 μm; Avantor, Radnor, PA, USA). The flow rate was 0.8 mL/min, and the column temperature was 30°C. The peaks were identified by comparing their retention times with those of phenolic compound standards. Quantitative analysis of phenolic compounds was carried out by using calibration curves of standards. Phenolic compound contents were expressed as mg per kg of cakes.
Sensory analysis of cakes
The sensory evaluation of the cakes was performed using a 5-point hedonic scale. To this end, 100 untrained panelists recruited students of the Afyon Kocatepe University (Afyonkarahisar, Turkey) assessed the cakes for their shape, color, softness, odor, aroma, consistency, and overall acceptability. Based on total scores, consumer acceptance was rated as <2.90 – unacceptable, 3.0–3.50 – acceptable, 3.51–4.50 – good, and 4.51–5.0 – very good [Gambuś et al., 2009].
Statistical analysis
The production of cakes was performed in duplicate. One cake from each batch was analyzed by individual methods. The data was expressed as the mean ± standard deviation. One-way analysis of variance (ANOVA) was conducted for volume, volume index, baking loss, color coordinates, texture parameters, mineral content, fatty acid composition, contents of α-tocopherol, and phenolic compounds with the Duncan’s post hoc test using IBM Statistics SPSS 24 software (IBM Corp. Armonk, NY, USA). The means were considered to be significantly different at p<0.05.
RESULTS AND DISCUSSION
Physical properties of cakes
Volume, volume index, and baking loss of corn gluten-free cakes produced with and without carob flour are shown in Table 1. Carob flour inclusion into the cake recipe significantly (p<0.05) affected these parameters of the analyzed products. Cake volume and volume index increased dramatically with the increasing levels of carob flour used in cake production. Cake including 40% (w/w) carob flour (flour-based) had the highest volume and volume index. This finding is consistent with the study by Turabi et al. [2008] who reported that locust bean gum (from carob seeds) caused an increase in the specific volume of rice cakes. Statistically similar (p≥0.05) baking loss values were observed for control gluten-free cake, gluten-free cake including 10% (w/w) carob flour, and gluten-free cake including 20% carob flour (Table 1). The gluten-free cake with 40% (w/w) carob flour substitution had the lowest baking loss value.
Table 1
Volume, volume index, baking loss, texture parameters, and color values of corn gluten-free cakes produced without (control) and with carob flour as a corn flour substitute at the level of 10–40% (w/w).
Color of cakes
The values of the color coordinates of gluten-free cakes produced using corn and carob flours are shown in Table 1. Carob flour significantly (p<0.05) affected L*, a*, b* crumb and crust color values. L* and b* crumb color values decreased, and a* crumb color values increased, while L*, a*, and b* crust color values decreased with the increasing levels of carob flour used in the gluten-free cakes. The brightness of the control gluten-free cake was significantly (p<0.05) higher than that of the gluten-free cakes produced with carob flour. The crumb and crust color changes (ΔE) increased with the increasing levels of carob flour in the cake recipe. The darkening, an increase in a* value, and a decrease in b* value of the crumb color of the cakes resulting from the use of carob flour were consistent with the literature data. Igual et al. [2024] reported such changes in the color of extrudates produced from a blend of corn flour and carob bean flour (5–12.5%). Różyło et al. [2017] observed similar trends in the crumb color of breads made from rice, corn, and buckwheat flours with the addition of carob fiber (1–5% of the total flour content). The color of the crumb in the cake, in the present study, was linked to the color of the carob flour, as the temperature inside the cake does not exceed 100°C during baking. In the case of crust, its color could also be influenced by Maillard reaction and caramelization products, which are formed at temperatures above 150°C [Purlis, 2010]. Especially since carob flour is characterized by a high carbohydrate content (above 50% with about 75% of these carbohydrates as sucrose) [El Batal et al., 2016].
Texture properties of cakes
The texture parameters of corn gluten-free cakes produced with and without carob flour are shown in Table 1. There were significant (p<0.05) differences between gluten-free cakes produced with different levels of carob flour in terms of hardness, chewiness, and resilience values. At the same time, the gluten-free cakes did not differ significantly (p≥0.05) in terms of the springiness and cohesiveness values. The hardness values of gluten-free cakes decreased significantly (p<0.05) with the increasing levels of carob flour in the recipe. Carob flour caused a decrease in the chewiness values of the gluten-free cakes. The highest chewiness value was obtained in the control gluten-free cake; however, the chewiness of gluten-free cake including 10% (w/w) carob flour did not differ significantly (p≥0.05) compared to the control cake. The gluten-free cakes with 30% and 40% (w/w) carob flour substitution had significantly higher resilience values compared to other cakes. The lowest resilience value was obtained in the control gluten-free cake and in the cake with 10% (w/w) carob flour substitution.
Springiness is related to aerated, fresh, and elastic properties while cohesiveness is negatively associated with crumbliness [Onyango et al., 2010]. The hardness, chewiness, resilience, springiness, and cohesiveness of gluten-free cakes including carob flour were found to be lower than the values reported by Li et al. [2020] who found hardness, adhesiveness, resilience, springiness, cohesiveness, and chewiness of gluten-free potato cake to be 1,292.67; −11.40; 35.58; 0.73; 90.07; and 850.03, respectively. The lower the hardness and chewiness are, the softer is the cake [Li et al., 2020]. Gambuś et al. [2009] reported that texture parameters like hardness and cohesiveness are essential in gluten-free products. The cited article showed that the control sponge cake had the lowest hardness, while the sponge cake, which included 40 g of potato starch and 60 g of amaranth flour, had the highest cohesiveness. Carrot cake, including 60 g of corn flour and 110 g of linseed meal, had the lowest hardness due to the content of the linseed meal, while carrot cake, including 170 g of corn flour, had the highest cohesiveness. In turn, coconut cake, including 125 g of rice paste and 125 g of linseed meal, had the lower hardness. Román et al. [2017] reported that roasting locust bean flour at 100°C for 60, 75, and 90 min increased the activity and consistency of the cake dough since it reduced cake hardness. Some researchers have used the gelling properties of heat-treated and gelatinized starch to improve the texture of gluten-free corn products. Yalcin & Basman [2008] gelatinized corn flour with boiled water to impart the dough a binding feature and reported that the highest gelatinization level (80%) resulted in the best-quality corn noodles. For this reason, in the present study, gelatinization was applied to corn flour with hot milk to improve the gelling properties of the gluten-free corn cake dough. Moreover, carob gum shows its effect in hot water [Mir et al., 2016], while many studies demonstrated that hydrocolloids and gums retain water as well as compete and interact with starches during gelatinization [Mir et al., 2016; Padalino et al., 2013].
pH of cakes
The pH values of gluten-free cakes produced from corn flour and its blends with carob flour are shown in Table 2. As the carob flour level increased, the pH values of the gluten-free cakes successively decreased.
Table 2
pH and contents of moisture, protein, lipids, total carbohydrates, total dietary fiber, ash and minerals of corn gluten-free cakes produced without (control) and with carob flour as a corn flour substitute at the level of 10–40% (w/w).
Moisture, protein, lipid, total carbohydrate, total dietary fiber, and ash contents of cakes
The moisture, protein, lipid, total carbohydrate, total dietary fiber, and ash contents of the corn gluten-free cakes produced with and without carob flour are shown in Table 2. Carob flour caused significant (p<0.05) changes in the macronutrient composition of the cakes. Their moisture content significantly (p<0.05) increased as the substitution of corn flour with carob flour in the cake recipe increased. A statistically similar protein content was obtained in the control gluten-free cake and the gluten-free cakes with 10%, 20%, and 30% (w/w) carob flour substitution. The lipid content of the gluten-free cakes decreased, whereas their contents of total carbohydrates, dietary fiber, and ash increased with the increasing levels of carob flour.
Carob flour substitution reduced the lipid content and increased dietary fiber in the cakes, which is considered healthy. Research has shown that increasing dietary fiber intake can reduce the risk of development of many chronic diseases, such as cardiovascular diseases, diabetes, obesity, colon cancer, and inflammation. These health conditions are major global challenges, making dietary fiber a key focus for disease prevention [Alahmari, 2024]. This increase in dietary fiber content is also valuable for celiac patients, because gluten-free products are usually poor in this dietary constituent [Kupper, 2005].
Compared to the results of this study, higher protein (18.20%), lipid (14.30%), total dietary fiber (9.44%) contents, and a similar total carbohydrate content (56.06%) were observed for gluten-free cake produced using potato flour [Li et al., 2020]. In turn, Gambuś et al. [2009] reported that the sponge cake with 50% amaranth flour and 27% corn flour had 35% more protein than the control cake. They also showed that some sponge cakes had the highest total dietary fiber content due to the high content of this fraction of non-starch polysaccharides in amaranth flour and corn flour.
Mineral contents of cakes
The mineral contents of gluten-free cakes produced from corn flour and its blends with carob flour are shown in Table 2. Carob flour caused significant (p<0.05) changes in the contents of phosphorous, magnesium, calcium, sodium, and potassium in the gluten-free cakes. The phosphorous, calcium, and potassium contents increased with the increasing levels of carob flour. All these minerals were found in carob flour in significant amounts in previous studies [Dahmani et al., 2023; Youssef et al., 2013]. The magnesium and sodium contents were significantly (p<0.05) reduced by using carob flour in the cake formula (Table 2). A higher content of potassium (630.50 mg/100 g) and lower contents of calcium, sodium, magnesium, and phosphorus (63.00, 107.00, 43.75, and 86.75 mg/100 g, respectively) were determined in potato cake by Li et al. [2020].
Fatty acid composition of cakes
The fatty acid composition of the corn gluten-free cakes produced with and without carob flour is shown in Table 3. Carob flour significantly affected their fatty acid composition. It caused significant (p<0.05) increases in the contents of butanoic acid, capric acid, 6-heptanoic acid, myristic acid, pentadecanoic acid, undecanoic acid (10-methyl), palmitic acid, heptadecanoic acid, hexadecenoic acid (14-methyl), stearic acid, linoleic acid, and linolenic acid of the gluten-free cakes, while it caused significant (p<0.05) decreases in the contents of caproic acid, caprylic acid, lauric acid, nonanoic acid (9-oxo), palmitoleic acid, 9-12-exadecadienoic acid, and oleic acid. Statistically similar linoleic acid contents were obtained in the gluten-free cakes including 20%, 30%, and 40% (w/w) carob flour in the flour blend. In contrast, there was no statistical difference (p≥0.05) between the linolenic acid contents of the gluten-free cakes with 20% and 30% (w/w) carob flour in the flour blend. Linolenic acid content was significantly (p<0.05) higher in the gluten-free cake with 40% (w/w) carob flour compared to the other gluten-free cakes, which is highly positive due to its nutritional value.
Table 3
Fatty acid composition (g/100 g total fatty acids) of corn gluten-free cakes produced without (control) and with carob flour as a corn flour substitute at the level of 10–40% (w/w).
The fatty acid profile of the gluten-free cakes was influenced primarily by the fatty acid profile of the buffalo cream used as a lipid source in the cake recipe, but also by the fatty acid profiles of the corn and carob flours. Felice et al. [2021] reported that palmitic acid, stearic acid, oleic acid, linoleic acid, and linolenic acid in buffalo cream accounted for 27.8%, 9.7%, 23.6%, 4.4%, and 0.9% of the total fatty acids, respectively. Similar contents of these fatty acids in buffalo cream (36.0%, 9.85%, 20.3%, 0.9%, and 0.7% of the total fatty acids, respectively) were determined by Ahmad et al. [2013]. In turn, Youssef et al. [2013] showed that the fatty acid profile of carob flour was characterized by lower contents of palmitic acid and stearic acid (11.01% and 3.08% of the total fatty acids, respectively), and higher contents of oleic acid, linoleic acid, and linolenic acid (40.45%, 23.19%, and 2.47% of the total fatty acids, respectively). In turn, Dunlap et al. [1995] analyzed the fatty acid profile of maize flour and reported that oleic acid and linoleic acid accounted for 16.2–43.8% and 39.5– 69.5% of the total fatty acids, respectively. Summarizing, the high oleic acid content in the gluten-free cakes could be caused by its contents in buffalo cream, corn flour, and carob flour. Its content decreased in the gluten-free cakes with the increasing levels of carob flour due to the lower oleic acid content in carob flour compared to corn flour. Moreover, the low linoleic acid content in the gluten-free cakes could be attributed to the high baking temperature applied to the batter. According to Hădărugă et al. [2006], linoleic acid was degraded at temperatures above 100°C, and aldehydes were formed due to oxidation; in turn the heat treatment at 150°C reduced linoleic acid content to 54.5%.
α-Tocopherol content of cakes
The α-tocopherol content of the corn gluten-free cakes is shown in Table 4. Carob flour caused a significant (p<0.05) increase in its content in the cakes. The highest α-tocopherol content was determined in the gluten-free cakes including 30% and 40% (w/w) carob flour.
Table 4
Content of α-tocopherol and phenolic compounds (mg/kg) of corn gluten-free cakes produced without (control) and with carob flour as a corn flour substitute at the level of 10–40% (w/w).
α-Tocopherol was determined in both corn flour and carob flour in previous studies [Dunn et al., 2014; Youssef et al., 2013]. Dunn et al. [2014] reported its content at 0.13–6.1 mg/kg in corn flour, whereas Youssef et al. [2013] demonstrated its content at 5.177 μg/100 g in carob flour. Therefore, a high α-tocopherol content in the gluten-free cakes analyzed in my study could be attributed to its content in corn flour and carob flour. It increased with the increasing levels of carob flour in the cake formula because it was a richer source of this valuable dietary constituent compared to corn flour.
Phenolic compound profile of cakes
The content of phenolic compounds in the corn gluten-free cakes produced without and with carob flour is shown in Table 4. Carob flour caused significant decreases in contents of chlorogenic acid, 4-hydroxybenzoic acid, vanillic acid, and naringin, while increases in contents of caffeic acid, p-coumaric acid, trans-ferulic acid, o-coumaric acid, cinnamic acid, rosmarinic acid, catechin, rutin, resveratrol, quercetin, and naringenin in the cakes. The highest caffeic acid, p-coumaric acid, trans-ferulic acid, o-coumaric acid, cinnamic acid, rosmarinic acid, catechin, rutin, quercetin, and naringenin contents were determined in the gluten-free cake including 40% (w/w) carob flour in the flour blend. Chlorogenic acid and naringin were detected only in the control gluten-free cake, which additionally had the highest contents of 4-hydroxybenzoic acid and vanillic acid. In turn, the highest resveratrol content was determined in the gluten-free cakes with 30 and 40% (w/w) carob flour in the flour blend.
Among the phenolic compounds determined in the gluten-free cakes, chlorogenic acid, caffeic acid, p-coumaric acid, and trans-ferulic acid were previously identified in corn flour at the contents of 39.52 μg/g, 39.14 μg/g, 35.42 μg/g, and 8.48 μg/g, respectively [Nikolić et al., 2019]. In turn, Youssef et al. [2013] showed that vanillic acid, ferulic acid, cinnamic acid, and catechin were present in carob flour at the contents of 13.92 ppm, 10.17 ppm, 3.78 ppm, and 27.97 ppm, respectively. High ferulic acid and catechin contents in the analyzed gluten-free cakes could be attributed to a high ferulic acid content in corn flour and to high ferulic acid and catechin contents in carob flour. Their contents in the cakes increased with the increasing levels of carob flour – being their richer source compared to corn flour – in the cake formula.
Sensory properties of cakes
The sensory profile of the gluten-free cakes produced from corn flour and its blend with carob flour is shown in Figure 2. The gluten-free cakes with 20% (w/w) substitution of corn flour with carob flour had the best shape and color. The softness of the cakes including carob flour was higher than that of the control cake. The best odor and aroma were reported for the gluten-free cake including 20% (w/w) carob flour in the flour blend. The consistency of the gluten-free cake including 40% (w/w) carob flour was the best among all cakes. In turn, the gluten-free cake including 20% (w/w) carob flour received the highest score (4.3) for overall acceptability, however, all gluten-free cakes were of good quality (scores above 3.5). Similar scores were also reported by Gambuś et al. [2009] for 3 types of gluten-free sponge cakes (60 g of corn flour and 60 g of potato starch and 60 g of amaranth flour), 2 types of gluten-free carrot cakes (170 g of corn flour or 60 g of corn flour and 110 g of linseed meal) and 2 types of gluten-free coconut cakes (250 g of rice paste or 125 g of rice paste and 125 g of linseed meal).
Figure 2
Sensory profile of corn gluten-free cakes produced without (cake 1) and with carob flour as a corn flour substitute at the weight levels of 10% (cake 2), 20% (cake 3), 30% (cake 4), and 40% (cake 5).
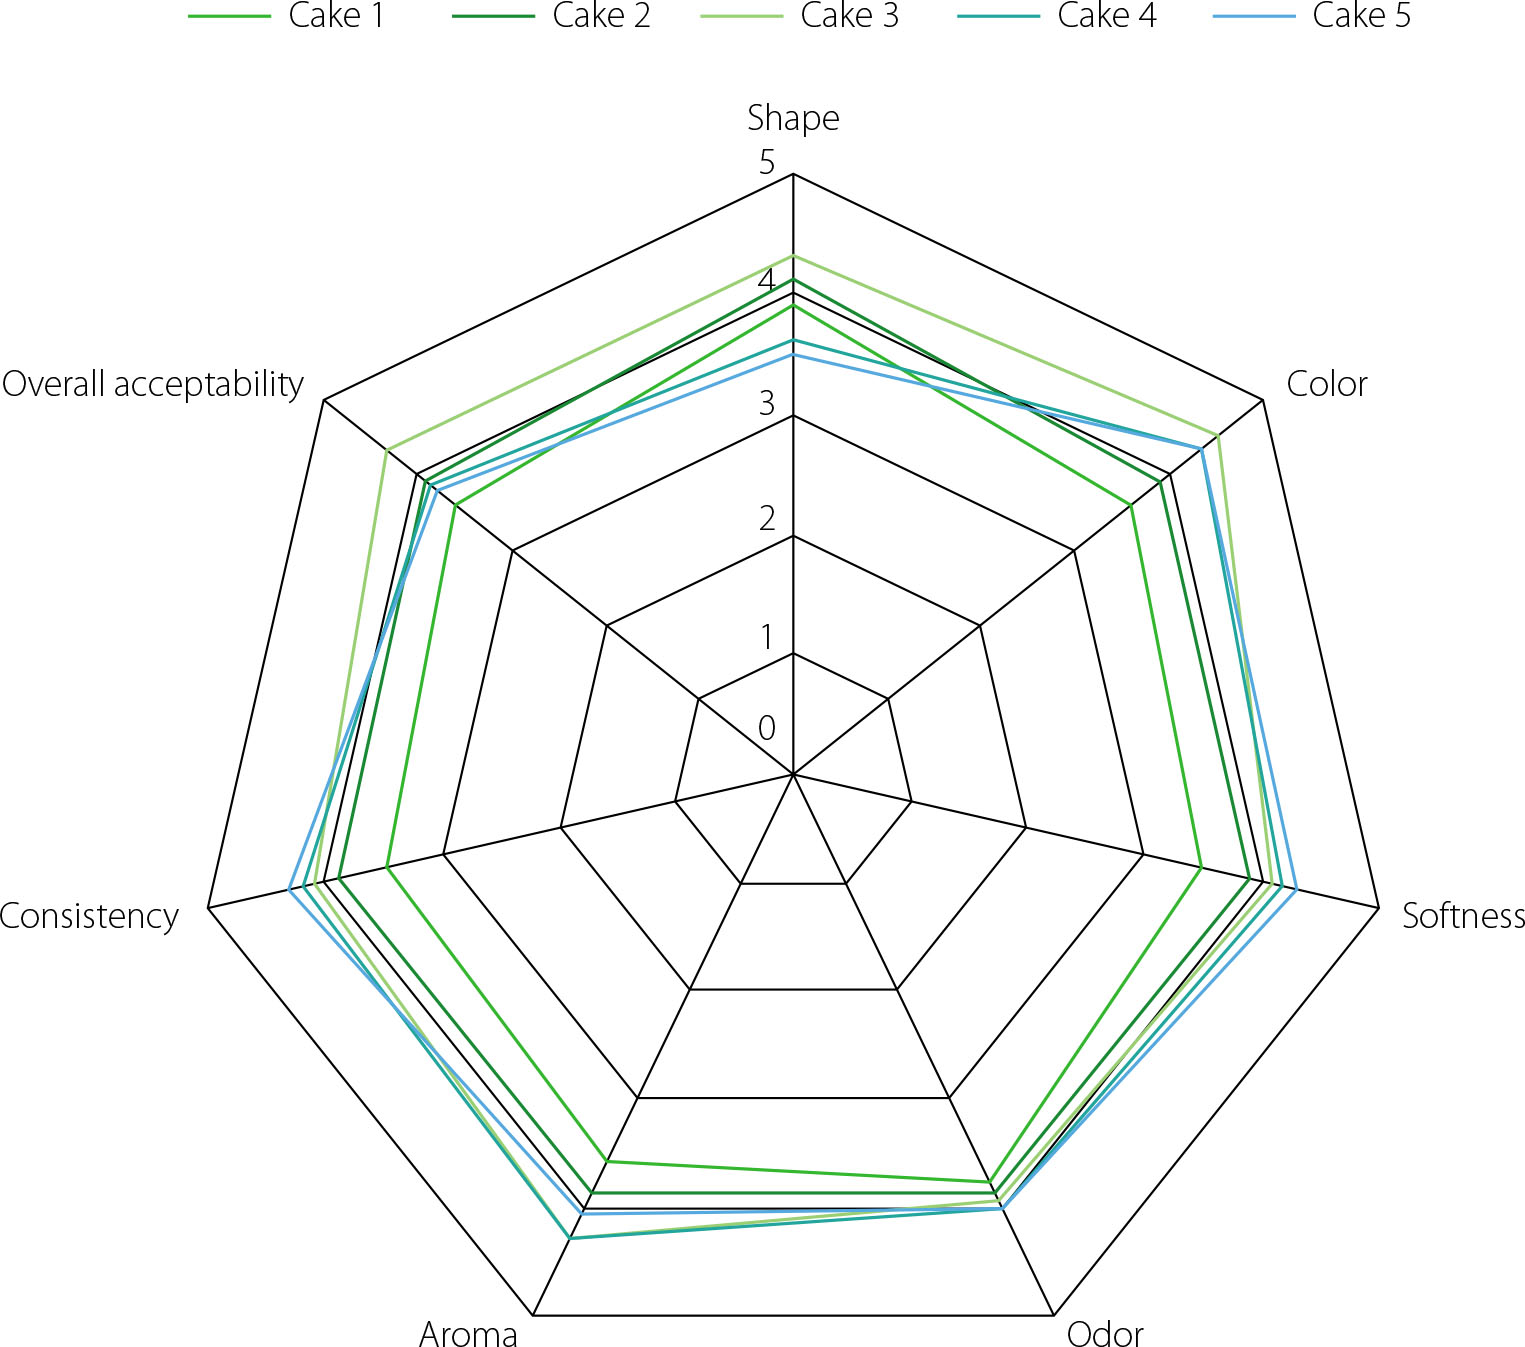
My study results suggest that the substitution of corn flour with carob flour in the cake recipe was optimal at 20% (w/w) considering the panelists’s scores although other properties were superior at higher carob flour substitution, such as volume and contents of total dietary fiber, phosphorus, calcium, potassium, α-tocopherol, caffeic acid, p-coumaric acid, trans-ferulic acid, o-coumaric acid, cinnamic acid, rosmarinic acid, catechin, rutin, resveratrol, quercetin, naringenin, stearic acid, linoleic acid, and linolenic acid.
CONCLUSIONS
Carob flour was generally used in gluten-free cakes made from rice flour. Corn flour and carob flour were used in gluten-free cake production for the first time ever. There are also no studies on the use of buffalo cream in cake products. Carob flour addition to the cake formula caused brown color, increased the volume, nutritional value, and contents of antioxidants as well as improved texture properties of the gluten-free cakes.
This study has shown the feasibility of manufacturing healthy and high-quality gluten-free products by blending corn flour and carob flour in the cake formula. The findings obtained from this study show that the gluten-free cakes produced have a good texture, high volume, sensory properties, and nutritional quality and will be preferred not only by celiac patients but also by healthy persons.