INTRODUCTION
Due to growing levels of consumer awareness about nutrition and an increased demand for food products with a high nutritional value, foods are enhanced with functional additives that influence their sensory attributes and deliver health benefits. Such additives include probiotic cultures that are used in the production of ripened cheeses [Aljewicz & Cichosz, 2015] and fresh cheeses [Guneser & Aydin, 2022; Kadiya et al., 2014; Soltanzadeh et al., 2019]. Probiotic cultures with confirmed health benefits are applied in cheesemaking to increase the selection of functional dairy products. The popularity of high-protein dairy products with an optimal amino acid profile and functional properties is also on the rise [Suthar et al., 2017]. High-protein dairy products are abundant in minerals. Casein is the major protein component in milk. It is a phosphoprotein and contains phosphoric acid esterified with serine and threonine residues that bind bivalent ions, including calcium. Milk contains mostly colloidal calcium; therefore, casein, its αs1, αs2, β, and κ fractions, and colloidal calcium phosphate are the structural components of casein micelles. The colloidal properties of milk are determined by the proportions of casein, whey proteins, and mineral salts, in particular calcium, phosphorus, and citrates [Huppertz, 2013; McMahon & Oommen, 2013].
Milk protein concentrates are used in the production of various dairy foods [Suthar et al., 2017]. Micellar casein concentrate (MCC) is a protein concentrate obtained by microfiltration. Intact casein and whey proteins account for more than 90% and up to 10% of total protein, respectively [Salunke et al., 2021]. A high content of calcium promotes the formation of gel networks in MCC powder, which decreases its solubility. Various physical (e.g., microfluidisation, homogenisation or pressurisation) and chemical (e.g., calcium-binding agents, enzymatic or chemical modifications of protein) techniques are applied to modify the composition of MCC powder and decrease calcium levels to improve its rehydration properties as dispersibility and solubility [Kommineni et al., 2022; McSweeney et al., 2021].
Fresh cheeses constitute a large and highly diverse group of dairy products. During acid coagulation in fresh cheese production, the micronutrients bound to casein micelles, including calcium, are dissolved, released into the soluble phase [Gaucheron, 2005], and partly transferred to whey, thus decreasing the content of minerals, including calcium, in acid curd. Various strategies for enriching dairy products with calcium have been proposed over the years, and milk products appear to be a highly suitable, natural source of calcium in dairy production. Milk proteins and milk powder are abundant in minerals and characterised by a natural taste and aroma. In addition, milk protein concentrates increase the protein content of dairy products, improve the bioavailability of mineral compounds, and enhance the nutritional value of the products [Aljewicz et al., 2018; Kowalska et al., 2012]. Milk proteins are natural ingredients with functional properties, including gelling, emulsifying, and foaming properties, and they can minimise the use of non-protein additives in dairy production [Suthar et al., 2017]. Due to its high nutritional value (high calcium content) and functional properties (thermal stability, gel formation), MCC can be used as an ingredient or an additive in the production of value-added foods [Carter et al., 2021; Kiełczewska et al., 2022]. To modify the composition and properties of fresh cheeses, further research is needed to determine the applicability of protein concentrates and probiotic bacteria in their production. Lactobacillus acidophilus LA5 is an example of a probiotic culture that converts lactose to lactic acid by homofermentation and can be applied in the production of acid-coagulated fresh cheeses.
The aim of this study was to determine the importance of the content and composition of milk proteins in the raw material used in the production of fresh cheeses on the counts of probiotic bacteria, content of minerals (calcium, phosphorus, and magnesium), rheological properties, color parameters, and sensory attributes of the product.
MATERIALS AND METHODS
Preparation of dairy raw materials
Raw milk (ca. 100 L, acquired from the Research and Education Station in Bałdy, which is a part of the University of Warmia and Mazury in Olsztyn, Poland) was centrifuged at a temperature of 45°C (Spomasz LWG-20 centrifuge, Gniezno, Poland) to obtain skimmed milk. Sweet buttermilk for retentate production was supplied by a dairy plant (ca. 100 L, Mlekovita, Poland). Skimmed milk was pasteurised at 72°C for 15 s (Alfa Laval P20-HB plate heat exchanger, Sweden). Skimmed milk and buttermilk were separated by membrane filtration, and the following products were obtained: micellar casein concentrate (MCC), i.e. the retentate obtained by microfiltration of skimmed milk which the next was subjected to diafiltration; buttermilk protein concentrate (RMFB), i.e. the retentate obtained by microfiltration of buttermilk; and buttermilk serum protein and micellar casein concentrate (RUFP), i.e. the retentate obtained by ultrafiltration of a mixture of micellar casein and buttermilk serum proteins (this method has been reported to the Polish Patent Office as: Method of producing a high-protein preparation containing milk serum proteins and buttermilk retentate proteins. P450274 [WIPO ST 10/C PL450274]).
Microfiltration and ultrafiltration were carried out with the use of Membralox ceramic membranes (EP1940GL, AGP1020, 0.1 µ alumina, Pall Corp., East Hills, NY, USA) and Koch membrane systems (3838 HFK-131, Koch Industries, Wichita, KS, USA), respectively, at 50°C, concentration factor (CF) ×3, according to the procedure described by Evans et al. [2009]. The concentrates were divided into two portions. One portion was cooled to 4°C, and the other portion was spray dried at an inlet temperature of 185°C (Niro Atomizer, GEA, Søborg, Denmark) according to the procedure described by Dec et al. [2023]. The liquid concentrates and powders were used in the production of fresh cheeses.
Production of fresh cheeses
Fresh cheeses were produced from two types of raw materials with the use of: 1) liquid products separated by membrane filtration, and 2) drinking milk with 2% fat content from a dairy plant (Piątnica, Poland) and powdered products separated by membrane filtration (5 g/100 mL). The following raw materials were used: liquid micellar casein concentrate (MCC_F), liquid buttermilk protein concentrate (RMFB_F), a mixture of liquid milk micellar casein concentrate and liquid buttermilk serum protein concentrate (RUFP_F), milk with the addition of micellar casein powder (M_MCC), milk with the addition of buttermilk protein powder (M_RMFB), and milk with the addition of a mixture of milk micellar casein and buttermilk serum protein powder (M_RUFP). The fresh cheeses produced from the above raw materials are marked with the same symbols. Drinking milk with 2% fat content with the addition of skimmed milk powder (5 g/100 mL) was the control sample.
Milk with the addition of milk powders and liquid products separated by membrane filtration, inoculated with the Lb. acidophilus LA-5 probiotic culture (NU-TRISH, Chr. Hansen, Hørsholm, Denmark) at log 5 cfu/mL, were incubated (Memmert ICP500, Schwabach, Germany) in 3 L glass laboratory bottles (Schott, Wolverhampton, UK) at 37°C for 24 h. The obtained curd was separated from whey and left to drain at 4°C for 24 h. Fresh cheeses were packaged and stored at 4°C for 21 days.
Determination of protein and dry matter content
The dry matter content of raw materials and fresh cheeses was evaluated according to AOAC International method no. 990.20 [AOAC, 2007] and the protein content was determined by the AOAC International method no. 991.20 (Kjeldahl method) [AOAC, 2007].
Protein profile analysis by reducing-sodium dodecyl sulphate polyacrylamide gel electrophoresis
The protein profile of the raw materials and fresh cheeses was determined by reducing-sodium dodecyl sulphate polyacrylamide gel electrophoresis (SDS-PAGE) [Laemmli, 1970]. Prior to analysis, raw milk samples were defatted by centrifugation at 4,000×g for 10 min at 4°C, and the fat layer was carefully removed. Fresh cheese samples were homogenised in ultrapure water at a 1:5 (w/v) ratio. The protein fractions were then diluted in Laemmli 2× sample buffer (S3401, Sigma Aldrich, St. Louis, MO, USA) containing 5% β-mercaptoethanol and heated at 95°C for 5 min to denature the proteins. After cooling to room temperature, the samples were centrifuged at 13,000×g for 15 min at 21°C to remove insoluble particles. Electrophoresis was conducted on a 4–20% polyacrylamide gel (Mini-PROTEAN® TGX™, Bio-Rad Laboratories Inc., Hercules, CA, USA) in 15-well plates. A Tris-glycine-SDS buffer system (10×, Sigma Aldrich) was used for protein migration. Samples were loaded alongside Precision Plus Protein Dual Colour Standard (Bio-Rad Laboratories Inc.), covering a molecular weight range of 10–250 kDa. The gel was placed in the electrophoresis chamber and initially run at 80 V, with the voltage gradually increased to 120–150 V. Separation was performed using a BIO-RAD Mini-PROTEAN II cell system (Bio-Rad Laboratories Inc). Following electrophoresis, the gels were stained with Coomassie Brilliant Blue R-250, destained, and imaged using the CCD LumiBis imaging system (DNR Bio-Imaging Systems, Modi’in-Maccabim-Re’ut, Israel). Quantification of casein and whey proteins was performed by densitometric analysis using TotalLab Quant 1.0 software (TotalLab, Gosforth, UK). The relative band intensities corresponding to major casein (αs1-casein, αs2-casein, β-casein, κ-casein) and whey protein fractions (β-lactoglobulin, α-lactalbumin) were compared across samples. The results were expressed as the relative percentage of casein and whey proteins in total proteins.
Determination of calcium, magnesium and phosphorus content
The calcium and magnesium content of raw materials and fresh cheeses was determined by flame atomic absorption spectrometry, according to standard method [ISO 8070:2007]. Determinations were performed using the iCE 3000 atomic absorption spectrometer (Thermo-Scientific, Hemel Hempstead, UK) equipped with a deuterium lamp for background correction and cathode lamps for each element. Samples were atomised in an air-acetylene flame at the wavelength of 285.2 and 422.7 nm for Mg and Ca, respectively. The content of phosphorus was determined colourimetrically with ammonium molybdate, sodium sulphate and hydroquinone (Merck, Darmstadt, Germany) according to the method by Pulliainen & Wallin [1994]. Absorbance readings were taken using the Cary 60 UV-VIS spectrophotometer (Agilent, Mississauga, Canada) at a wavelength of 610 nm. Results of analyses were expressed as mg of element per 100 g of raw material or fresh cheese. The Ca to P ratio was also calculated. In addition, the coverage of the recommended daily intake (RDI) of Ca, Mg and P by the consumption of 100 g of fresh cheese was estimated based on the dietary guidelines for the Polish population [Wojtasik et al., 2020].
pH value determination
The pH value of fresh cheeses was determined directly after production using a Schott Lab 850 pH meter (SI Analytics GmbH, Mainz, Germany).
Microbiological analysis
Bacterial counts in fresh cheeses were determined by streaking. Cheese samples were diluted with a saline solution (1:10; Maximum Recovery Diluent, Merck, Darmstadt, Germany), homogenised (BagMixer 400, Interscience, ST Nom, Saint-Nom-laBretèche, France), and plated on De Man-Rogosa-Sharpe (MRS) agar (Merck) for the proliferation, culture, isolation and enumeration of lactic acid bacteria of the genus Lactobacillus. Incubation was carried out in Anaerocult C mini bags with a low-oxygen atmosphere (Merck) at 37°C for 48 h. Lactobacillus counts in fresh cheeses (expressed as log cfu/g) were determined directly after production and after 7, 14, and 21 days of refrigerated storage.
Colour parameter analysis
The colour parameters of fresh cheeses were measured in the CIELab colour space using the CM-3500d spectrophotometer (Konica Minolta Sensing, Osaka, Japan), which was calibrated using white (CM A120) and black (CM A124) calibration plates. Measurements of L*, a* and b* coordinates were performed with d/8 geometry, 8 mm aperture size, 10° observer angle and D65 illuminant [Kiełczewska et al., 2022]. Coordinate L* described colour lightness (L* = 0 for black and L* = 100 for white colour). Chromaticity was expressed by coordinates a* (−a* – greenness and +a* – redness) and b* (−b* – blueness and +b* – yellowness). In addition, the saturation (C) was calculated from Equation (1) [Pathare et al., 2013]:
The total difference in colour between the control cheese and other experimental products was calculated with the use of Equation (2):
Rheological properties analysis
The rheological properties of fresh cheeses were determined using an MCR 102 rheometer (Anton Paar, Graz, Austria) equipped with temperature control units, including fluid circulators and a Peltier hood, as described by Aljewicz et al. [2021]. A parallel plate measuring system (PP25/S-SN73131) was employed for the tests. Rheological data were recorded using RheoCompass software v. 1.31 (Anton Paar). The linear viscoelastic region (LVER) was determined at 10°C using a strain sweep ranging from 0.001% to 100% strain at a fixed angular frequency of 1 Hz. A logarithmic ramp with six measurement points per decade was applied. The sample recovery and temperature stabilization time were set to 60 s. Storage modulus (G′) and loss modulus (G″) were measured at 10°C using a dynamic frequency sweep within an angular frequency range of 0.1–10 Hz, with a constant strain of 0.1%. A logarithmic ramp with ten measurement points per decade was applied. Shear rate, shear stress, and apparent viscosity were calculated using RheoCompass software v. 1.31 (Anton Paar). The flow curve data were fitted to rheological models, including the power law model, described using Equation (3):
where: τ is the shear stress (Pa), κ is the consistency index (Pa×sn), γ is the shear rate (1/s), n is the flow behaviour index.G′ and G″ were utilised by the instrument’s software to calculate the complex viscosity (η*). The complex viscosity was computed by means of Equation (4):
where: ω represents the angular frequency [Mezger, 2012].Stress and strain at fracture were determined as the actual stress and strain recorded at the fracture point on the stress-strain curve, corresponding to the point where the cheese cracked [ISO/TS 17996, 2006]. Based on prior studies [ISO/TS 17996, 2006], the strain at fracture was assumed to correspond to 10% of the LVER. Using the determined strain at fracture, the corresponding stress value (Pa) was subsequently read from the stress-strain curve.
Texture analysis
The textural properties of fresh cheeses were determined with the use of the TA.XT.plus texture analyser (Stable Micro Systems, Godalming, UK). Firmness and penetration force were determined in a penetration test with the use of an SMS P/25 aluminium cylindrical probe (25 mm). Penetration depth was 20 mm, probe speed was 1.5 mm/s, and the applied load was 0.049 N. The measurements were conducted at a temperature of 6±1°C [Lis et al., 2021].
Microstructure and fractal analysis
Fresh cheese samples were prepared according to the method described by Smoczyński & Baranowska [2014]. Samples of the tested cheeses were placed in holders and immediately frozen in a microscopic chamber using a Peltier cooler at −18°C. The specimens were then examined under a Quanta 200 scanning microscope (FEI Company, Eindhoven, Netherlands) at 200× magnification. The original microphotographs were analysed with the use of Nis-Elements software (Nikon, Tokyo, Japan). They were first converted into high-contrast images based on the defined contrast parameters (high – 75, low – 74). The perimeter (P) and area (A) of approximately 200 small, medium, and large objects were measured. The analysed objects were self-similar, and their “surface” fractal dimension (D) was calculated from the slope of the log A = f (log P) line [Dziuba et al., 1997], with the use of Equation (5):
where: A is surface area, P is perimeter, and D is fractal dimension of the contour. Straight lines with the slope of a = 2/D were obtained, which were used to compute the fractal dimensions of the analysed samples [Smoczyński, 2020].Sensory analysis
The sensory analysis of fresh cheeses was conducted in a sensory laboratory with the use of a standard profiling method [EN ISO 13299:2016-05E] and a five-point descriptive scale. The intensity of 22 sensory attributes (including appearance, aroma, texture, mouthfeel, and taste) was rated, where 1 point denoted the absence of the analysed attribute, and 5 points denoted very high intensity of the analysed attribute. The overall acceptability of fresh cheeses was also evaluated. The sensory panel comprised ten panellists who had been trained to evaluate dairy products and whose sensory sensitivity had been validated according to ISO method [EN ISO 8586:2014–03].
Statistical analysis
The results were verified for normal distribution and homogeneity of variance. Significant differences in the physicochemical properties and sensory attributes of fresh cheeses were determined by one-way analysis of variance (ANOVA) and Fisher’s least significant difference (LSD) test. In the rheological analysis, the significance of differences between means was estimated by Duncan’s test. Data were presented as means ± standard deviation. All results were processed in Statistica 13.5 PL software (Statsoft 2017, Krakow, Poland) at a significance level of 0.05. The experiment was conducted in duplicate.
RESULTS AND DISCUSSION
Protein and mineral content of raw materials and fresh cheeses
Protein content in membrane separation products of skimmed milk and buttermilk and in milk with their addition was significantly higher (p≤0.05) compared to the control sample (Table 1). Among the liquid fractions used for the production of probiotic cheeses, the highest protein content was found in MCC_F, which accounted for 92% of its dry matter. Protein content in RMFB_F and RUFP_F was lower and accounted for more than half of the dry matter. Milks with the addition of milk protein concentrates in powder were characterised by a significantly lower (p≤0.05) protein content compared to the analogous fractions of liquid protein concentrates. The use of micellar casein concentrate resulted in a higher protein content compared to the milk with the addition of other high-protein powders. Smaller variations in dry matter content were found between milks with the addition of high-protein powders than in the case of liquid protein fractions. This was reflected in a less varied, although lower, protein content in dry matter, ranging from 45 to 37 g/100 g dry matter depending on the type of high-protein powder added to the milk.
Table 1
Protein and dry matter content of raw materials and fresh cheeses.
[i] The presented values are means with standard deviation. Mean values marked with different letters (a–f) in columns differ significantly at p≤0.05. Raw materials and fresh cheeses produced from: C, milk with the addition of skimmed milk powder (control sample); MCC_F, liquid micellar casein concentrate; RMFB_F, liquid buttermilk protein concentrate; RUFP_F, mixture of liquid milk micellar casein concentrate and liquid buttermilk serum protein concentrate; M_MCC, milk with the addition of micellar casein powder; M_RMFB, milk with the addition of buttermilk protein powder; M_RUFP, milk with the addition of a mixture of milk micellar casein and buttermilk serum protein powder.
The use of milk protein concentrates, both as a liquid fraction and in the powder form, contributed to the differentiation of the protein content in fresh probiotic cheese in the descending order MCC > RUFP > RMFB (Table 1). The highest (p≤0.05) protein content was achieved in the cheeses produced from MCC_F, which accounted for almost 90% of the dry matter of the product. The use of RUFP also contributed to the increase in the protein content in the cheese, although to a lesser extent compared to the cheese produced from MCC without the addition of other proteins. The protein content in fresh probiotic cheeses produced from M_RMFB did not differ significantly (p>0.05) from the control sample, and in the case of RMFB_F it was lower compared to the control sample. The dry matter content in cheeses produced from MCC_F, M_MCC or M_RUFP was higher compared to the control sample. The dry matter content in the remaining fresh cheese was lower compared to the control sample.
In addition to variations in protein content across the analysed products, distinct protein profiles were observed (Figure 1). The electropherograms of the raw material proteins revealed bands corresponding to the major milk proteins, with casein fractions exhibiting molecular weights ranging from 19 to 35 kDa, β-lactoglobulin at ~18.5 kDa, and α-lactalbumin at ~14.5 kDa [Lee & Hong, 2003; Zhang et al., 2022]. Additionally, protein bands around ~80 kDa suggest the presence of milk fat globule membrane (MFGM) proteins, particularly given that these samples were derived from buttermilk subjected to microfiltration. This interpretation aligns with previous research indicating that MFGM proteins, including butyrophilin and PAS6/PAS7, are among the primary proteins in buttermilk and typically appear in this molecular weight range [Miocinovic et al., 2014; Spitsberg, 2005]. These proteins were the most abundant in milk from RMFB_F and in all milk samples with the addition of highprotein powders, including the control sample (Figure 1A). In the electropherograms of fresh cheeses, the most distinctive band denoting the presence of a protein with a molecular weight of ≥70 kDa was observed in RMFB_F (Figure 1B).
Figure 1
SDS-PAGE electropherograms of raw materials (A) and fresh cheeses (B) and relative content of casein and whey proteins in total proteins determined based on a densitometric analysis of electrophoretic patterns in raw materials (C) and fresh cheeses (D) produced from: C, milk with the addition of skimmed milk powder – control sample; MCC_F, liquid micellar casein concentrate; RMFB_F, liquid buttermilk protein concentrate; RUFP_F, mixture of liquid milk micellar casein concentrate and liquid buttermilk serum protein concentrate; M_MCC, milk with the addition of micellar casein powder; M_RMFB, milk with the addition of buttermilk protein powder; M_RUFP, milk with the addition of a mixture of milk micellar casein and buttermilk serum protein powder.
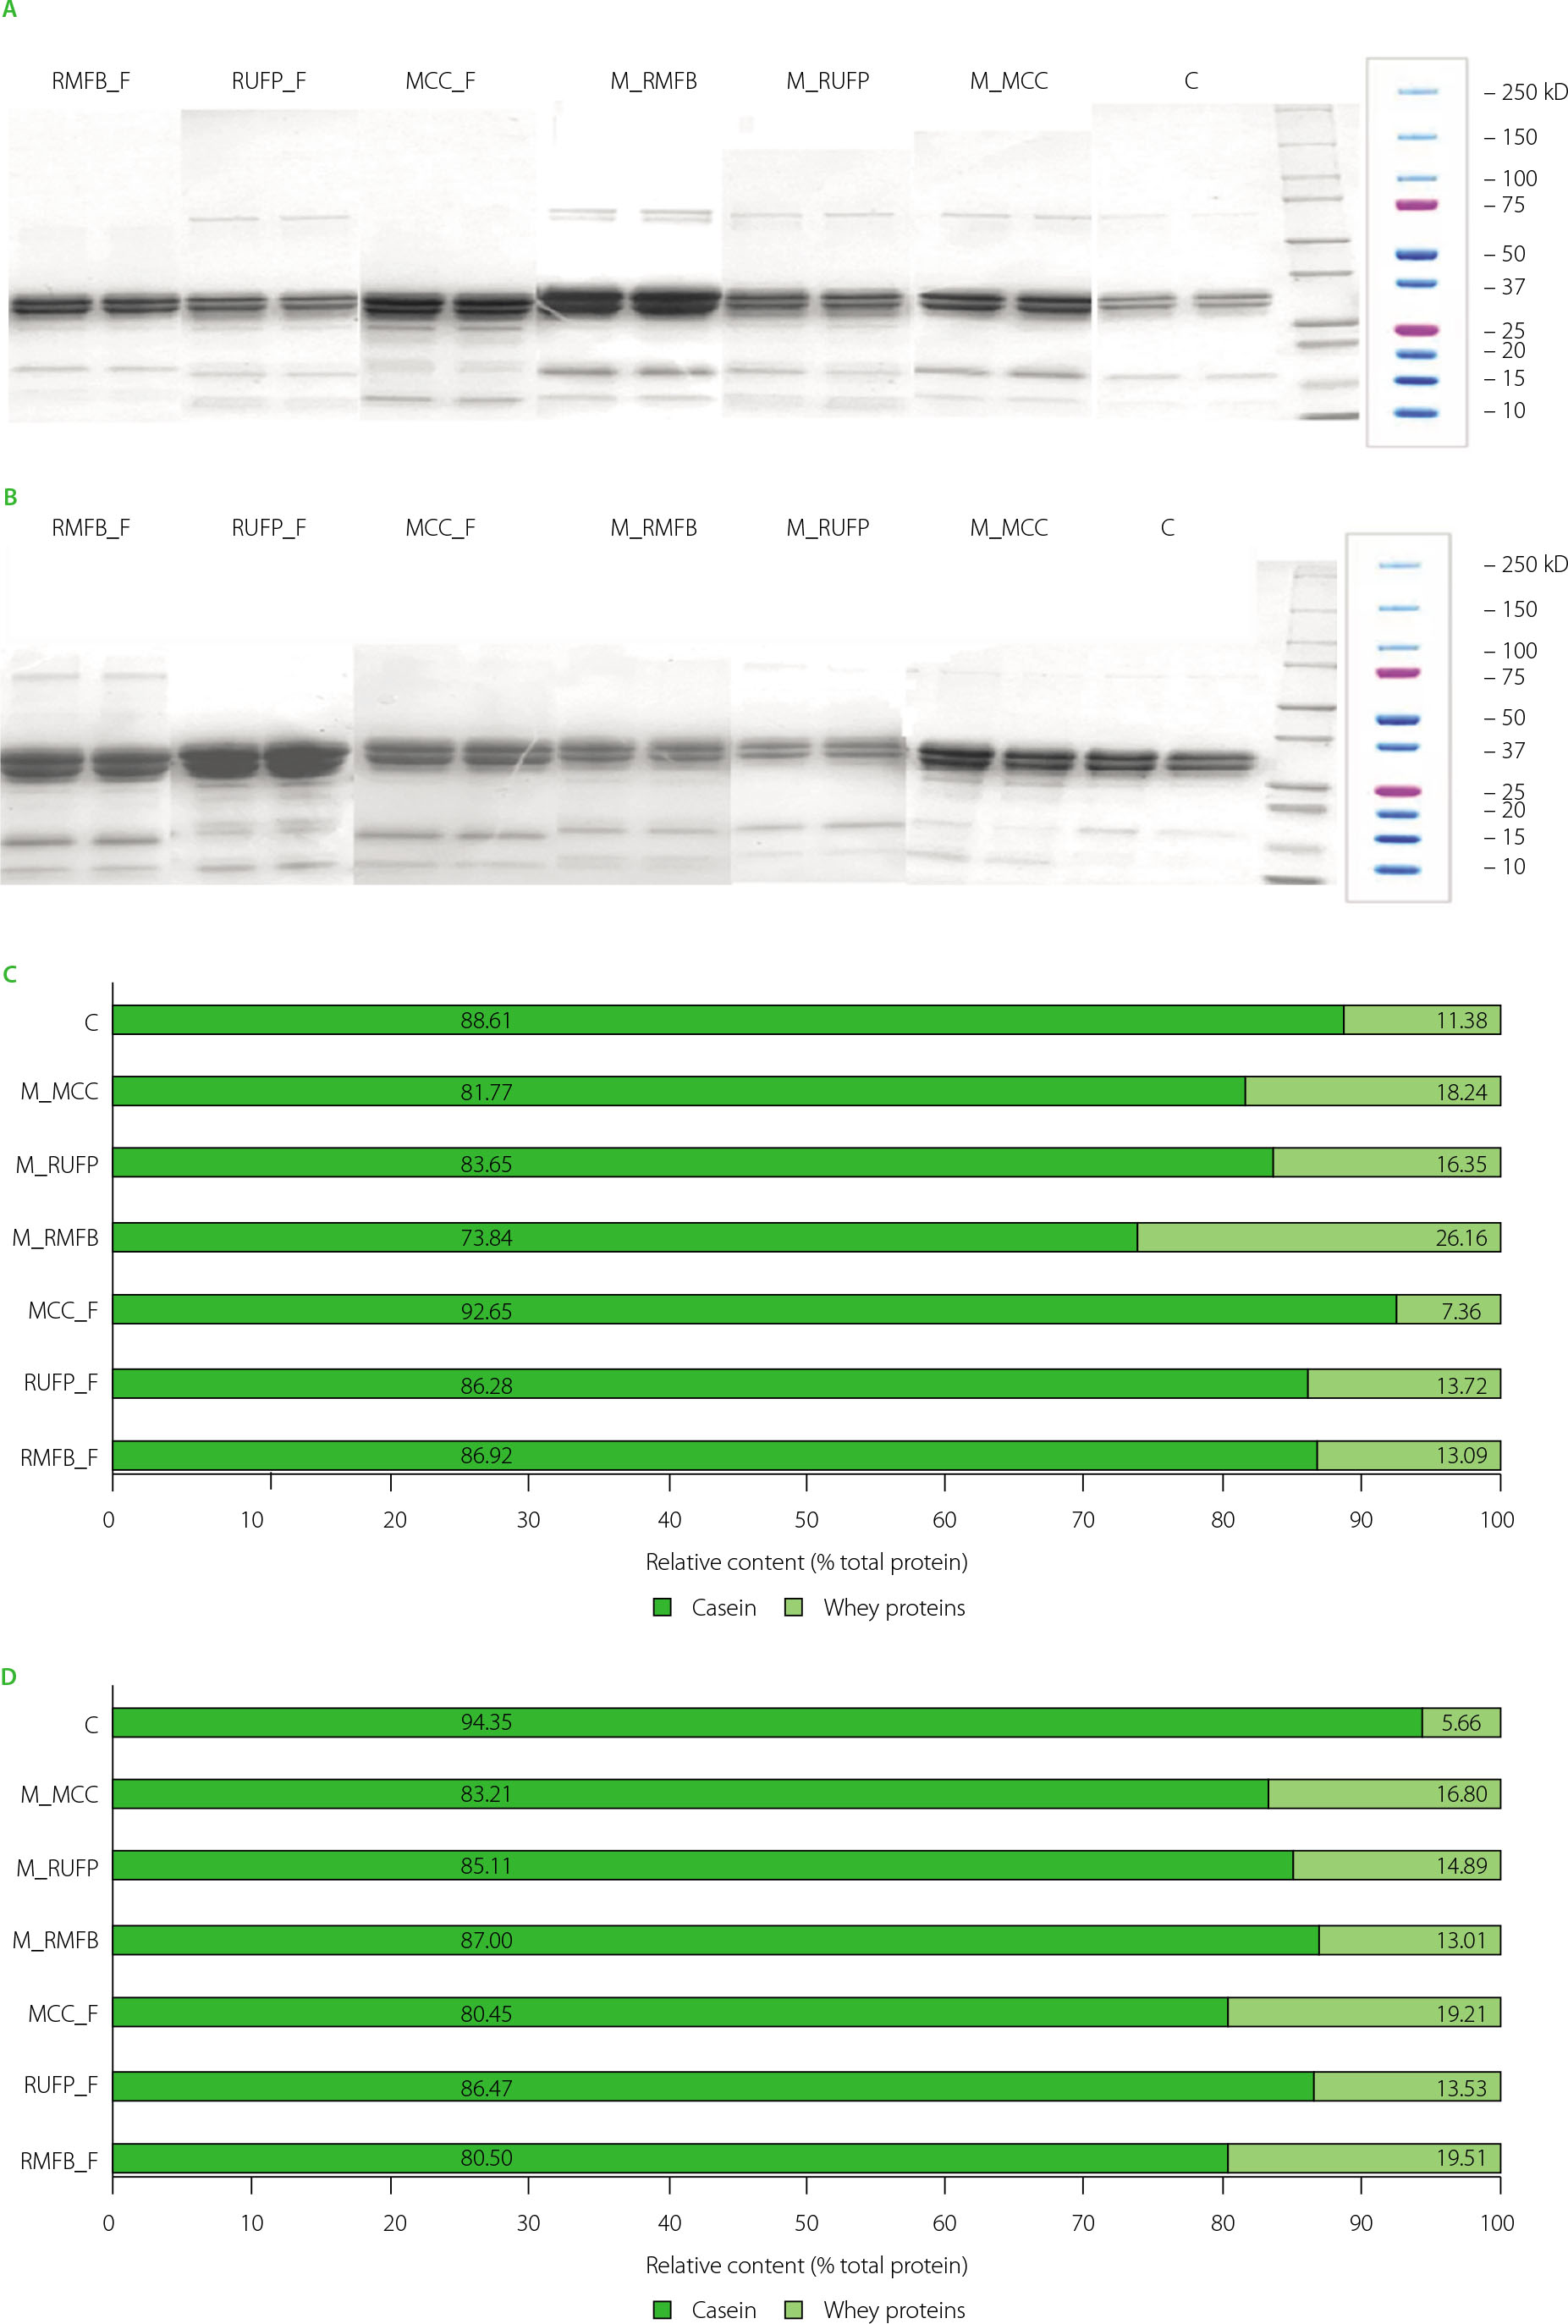
The protein bands in the electropherograms of raw materials and fresh cheeses were subjected to a densitometric analysis, and the results were used to calculate the relative content of casein and whey proteins. The analysis showed that the casein content was the highest in MCC_F (Figure 1C). In contrast, the casein content in the other two liquid raw materials, obtained through membrane filtration of milk and buttermilk, was lower. In the case of fresh cheeses produced from these raw materials, the casein content was the lowest in MCC_F, as compared to the other cheeses obtained with the use of two liquid membrane materials (Figure 1D). These results suggest that processing conditions, including coagulation properties and whey drainage, may have influenced the final protein distribution. The membrane concentration process used in MCC may have altered the protein composition, specifically affecting the efficiency of casein retention in the cheese matrix. This highlights the importance of processing parameters in shaping the protein profile of fresh cheeses.
The tested raw materials differed in the content of calcium, phosphorus, and magnesium (Table 2). In the analysed group of liquid fractions, calcium and phosphorus content was highest in MCC_F, where the Ca to P ratio was determined at 1.46. The remaining liquid fractions contained less calcium and more phosphorus than the control sample, and the Ca to P ratio ranged from 1.56 in RMFB_F to 2.23 in RUFP_F. Phosphorus content was significantly (p≤0.05) lower in the milk with the addition of high-protein powders than in high-protein liquid preparations, which increased the Ca to P ratio. In the milk samples with the addition of high-protein powders, phosphorus content was highest in M_MCC. Calcium and phosphorus levels were higher in raw materials with the addition of casein than in the other high-protein raw materials due to the presence of colloidal calcium phosphate in casein micelles. Magnesium content was lower (p≤0.05) in the liquid products separated by membrane filtration than in the control sample, but it was higher (p≤0.05) in the milk with the addition of high-protein powders.
Table 2
Content of calcium, phosphorus and magnesium, and the calcium to phosphorus ratio in raw materials and fresh cheeses.
[i] The presented values are means with standard deviation. Mean values marked with different letters (a–g) in columns differ significantly at p ≤0.05. Raw materials and fresh cheeses produced from: C, milk with the addition of skimmed milk powder (control sample); MCC_F, liquid micellar casein concentrate; RMFB_F, liquid buttermilk protein concentrate; RUFP_F, mixture of liquid milk micellar casein concentrate and liquid buttermilk serum protein concentrate; M_MCC, milk with the addition of micellar casein powder; M_RMFB, milk with the addition of buttermilk protein powder; M_RUFP, milk with the addition of a mixture of milk micellar casein and buttermilk serum protein powder.
The calcium, phosphorus, and magnesium content of fresh cheeses varied depending on the raw materials applied in the production process (Table 2). The phosphorus content in RMFB_F and M_MCC cheeses was significantly (p≤0.05) higher than in the control cheese. Fresh cheeses produced from the remaining raw materials were characterised by a lower and varied content of calcium and phosphorus in comparison with the control sample. The addition of high-protein powders to milk increased the Ca to P ratio of the resulting cheeses relative to the control sample. Magnesium content was lower (p≤0.05) in M_RMFB and M_RUFP cheeses than in the control sample. The content of magnesium was significantly (p≤0.05) higher in the cheeses made from liquid and powdered MCC, as well as in those produced from liquid RMFB and RUFP fractions.
Based on the content of calcium, phosphorus and magnesium in the products, it was calculated how much of them will cover the recommended daily allowance (RDA) of individual groups of consumers [Wojtasik et al., 2020]. In all analysed age groups, the RDA of calcium was best satisfied by a 100 g serving of MCC_F cheese, followed by M_MCC cheese (Table 3). In the cheeses produced from milk with the addition of the RUFP powders, the RDA of calcium was similar to that noted in the control sample. The RDA of calcium per 100 g of the cheeses produced from liquid buttermilk protein concentrate was similar to that produced from milk with the addition buttermilk protein powder. The RDA of both cheeses produced on the basis of buttermilk protein concentrate was lower relative to the control sample. In all analysed age groups, the RDA of phosphorus was best satisfied by a 100 g serving of MCC_F cheese, followed by RMFB_F cheese, and the values noted in MCC_F were twice higher than in the control sample. In all age groups, the RDA of phosphorus was lower in 100 g of the remaining cheeses than in the control sample. The analysed products were most effective in satisfying the magnesium RDA of children aged 4-6 years due to lower magnesium requirements in this age group. The type of raw material applied in the production process did not differentiate the target magnesium intake from fresh cheeses in the remaining age groups.
Table 3
Daily nutrient intake per 100 g of fresh cheese (percentage).
[i] Source: own elaboration based on Wojtasik et al. [2020]. RDA, recommended dietary allowance based on the dietary guidelines for the Polish population. Fresh cheeses produced from: C, milk with the addition of skimmed milk powder (control sample); MCC_F, liquid micellar casein concentrate; RMFB_F, liquid buttermilk protein concentrate; RUFP_F, mixture of liquid milk micellar casein concentrate and liquid buttermilk serum protein concentrate; M_MCC, milk with the addition of micellar casein powder; M_RMFB, milk with the addition of buttermilk protein powder; M_RUFP, milk with the addition of a mixture of milk micellar casein and buttermilk serum protein powder.
Microbiological quality and pH of fresh cheeses
The pH of fresh cheeses was differentiated by the type of raw material (Table 4). This parameter was significantly (p≤0.05) higher in MCC_F cheese compared to the remaining products for which it ranged from 4.06 to 4.50. The higher pH of MCC_F cheese can probably be attributed to the high buffering capacity of the high-protein matrix. In the production of such fresh cheeses, acid coagulation is accompanied by protein gelation. A decrease in milk pH leads to the solubilisation of calcium [Gaucheron, 2005], therefore the higher pH of fresh cheese is more desirable because it prevents calcium loss during production.
Table 4
pH value and count of Lactobacillus acidophilus LA5 in fresh cheeses during storage.
[i] The presented values are means with standard deviation. Mean values marked with different letters (a–d) in rows differ significantly at p ≤0.05. Fresh cheeses produced from: C, milk with the addition of skimmed milk powder (control sample); MCC_F, liquid micellar casein concentrate; RMFB_F, liquid buttermilk protein concentrate; RUFP_F, mixture of liquid milk micellar casein concentrate and liquid buttermilk serum protein concentrate; M_MCC, milk with the addition of micellar casein powder; M_RMFB, milk with the addition of buttermilk protein powder; M_RUFP, milk with the addition of a mixture of milk micellar casein and buttermilk serum protein powder.
Directly after cheese production and whey separation, Lb. acidophilus LA5 counts were higher in the analysed cheeses than in the inoculum. In most products, Lb. acidophilus LA5 counts increased on the first day of storage (Table 4). In addition, Lb. acidophilus LA5 counts continued to increase up to day 7 of storage in the control cheese and in RUFP_F and RMFB_F cheeses. In the remaining cheeses, the abundance of probiotic bacteria decreased on successive days of storage. In all cheeses, Lb. acidophilus LA5 counts exceeded log 6 cfu/g on the last day of storage (day 21), thus satisfying the criteria for probiotic products [Szajewska et al., 2023]. These results indicate that the analysed cheeses contained substrates that are essential for the growth of lactic acid bacteria. Lactobacillus acidophilus LA5 cells do not require substrates that are highly abundant in nutrients, and they can utilise milk proteins in fresh cheeses [Bolivar-Jacobo et al., 2023].
The rate of lactic acid fermentation and lactic acid levels determine the physicochemical (curd formation, syneresis, curd decalcification) and microbiological (autolysis of starter cultures, proliferation of secondary microflora) properties of food products and, consequently, affect their sensory attributes (colour, texture, taste).
Colour parameters of fresh cheeses
The use of membrane filtration products in the production of fresh cheeses induced a minor, but statistically significant changes in colour. The lightness (L*) of all cheeses remained within a narrow range of 89.76 to 92.92 (Table 5). Fresh cheeses were characterised by a light green (−3.29 ≤ a* ≤ −1.42) and yellow (6.89 ≤ b* ≤ 12.12) hue. The differences in the colour parameters of fresh cheeses produced from various raw materials were confirmed by the values of the total colour difference (ΔE) relative to the control sample. The values of ΔE were higher when fresh cheeses were produced with the use of liquid protein fractions than milk with the addition of high-protein powders. The highest values of ΔE were noted in MCC_F cheese (4.04), followed by M_MCC cheese (2.56). The detection of colour difference could be easily possible even by an inexperienced observer if the ΔE = 2.0–3.5 [Dobrzańska & Cais-Sokolińska, 2014]. The application of buttermilk proteins, alone (RUFP_F) or in combination with micellar casein (RMFB_F), decreased the total colour difference in fresh cheeses (1 < ΔE < 2) to a level that was discernible only to highly trained panellists. Despite the low ΔE values of cheeses produced from M_RMFB (0.58) and M_ RUFP (0.93), differences in colour were statistically significant (p≤0.05) (Table 5).
Table 5
Colour parameters of fresh cheeses.
[i] The presented values are means with standard deviation. Mean values marked with different letters (a–f) in columns differ significantly at p≤0.05. L*, lightness; a*, value between green (−) and red (+); b*, value between blue (−) and yellow (+); C, colour intensity; ΔE, total colour difference compared to control. Fresh cheeses produced from: C, milk with the addition of skimmed milk powder (control sample); MCC_F, liquid micellar casein concentrate; RMFB_F, liquid buttermilk protein concentrate; RUFP_F, mixture of liquid milk micellar casein concentrate and liquid buttermilk serum protein concentrate; M_MCC, milk with the addition of micellar casein powder; M_RMFB, milk with the addition of buttermilk protein powder; M_RUFP, milk with the addition of a mixture of milk micellar casein and buttermilk serum protein powder.
Rheological parameters of fresh cheeses
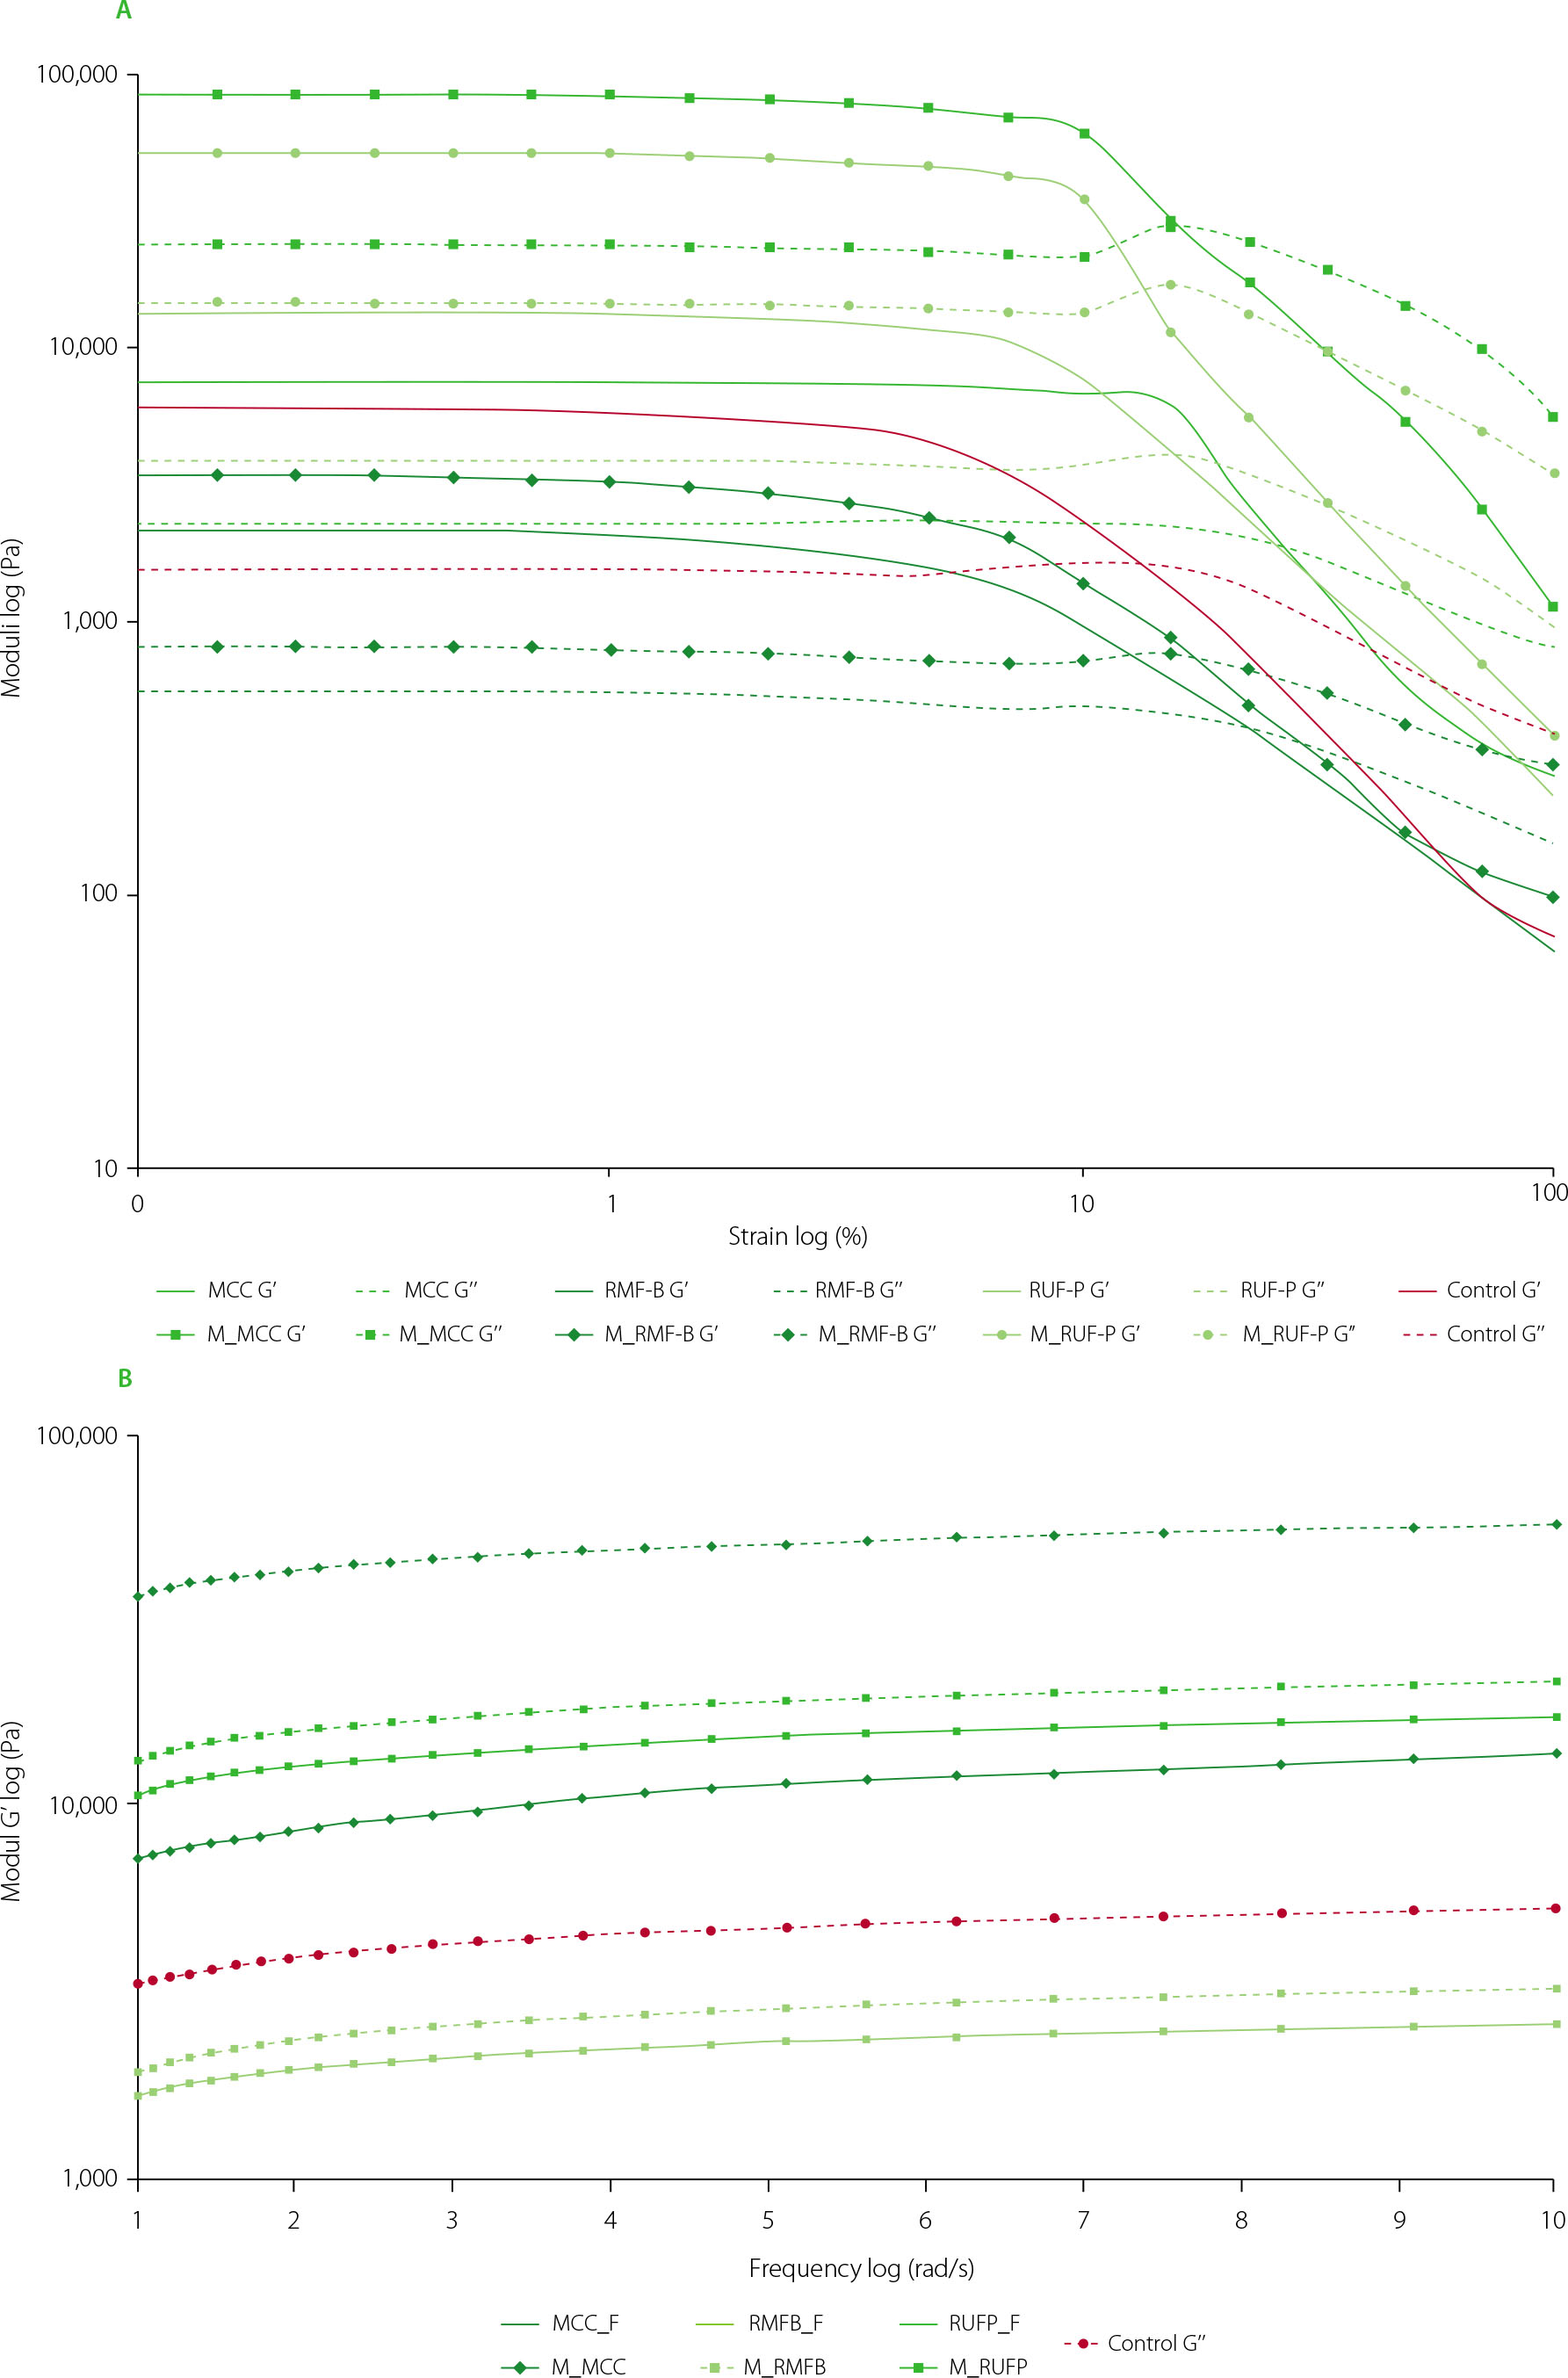
The pseudoplastic flow behaviour of fresh cheeses was influenced by the type of high-protein preparation used in the production process. The rheological analysis revealed that all products were characterised by pseudoplastic flow behaviour, and that their storage modulus (G′) was higher than the loss modulus (G″) (Figure 2A). In the cheeses made solely from high-protein preparations, G′ ranged from 2,147 Pa (RMFB_F) to 13,001 Pa (RUFP_F). The value of G′ was significantly higher in the cheeses produced from high-protein preparations with the addition of milk. The increase in G′ values was smallest (approx. 50%) in M_RMFB cheese and highest in M_RUFP (312%) and M_MCC (1076%) cheeses.
Figure 2
Rheological characteristics of fresh cheeses. (A) Strain sweep of modulus in fresh cheeses. The solid line represents the storage modulus component (G′) and the dashed line represents the loss modulus component (G″) of cheeses. (B) Frequency sweep test showing variation in G′ of cheeses. Fresh cheeses produced from: C, milk with the addition of skimmed milk powder – control sample; MCC_F, liquid micellar casein concentrate; RMFB_F, liquid buttermilk protein concentrate; RUFP_F, mixture of liquid milk micellar casein concentrate and liquid buttermilk serum protein concentrate; M_MCC, milk with the addition of micellar casein powder; M_RMFB, milk with the addition of buttermilk protein powder; M_RUFP, milk with the addition of a mixture of milk micellar casein and buttermilk serum protein powder.
Cheeses produced from buttermilk protein concentrate were characterised by the lowest value of stress at fracture, which was determined at 622 Pa in RMFB_F and 878 Pa in M_RMFB (Table 6). In comparison with the fresh cheeses produced from liquid protein concentrates only, the addition of high-protein powders to milk led to a significant (p≤0.05) increase in the analysed parameter, by 1,127% in M_MCC and by 830% in M_RUFP. The flow behaviour index of these cheeses was also significantly reduced (Table 6). In these products, stress at fracture increased significantly due to the use of milk and the resulting changes in the proportions of different milk proteins. Protein composition is an important factor which affects the spatial structure of the casein gel formed during acidification. Madadlou et al. [2006] and Esteves et al. [2003] found that the values of stress and strain at fracture were significantly influenced by a product’s microstructure and the distribution of casein fibres in caseingel. The significant increase in the values of stress at fracture was attributed to the formation of larger and less porous casein aggregates and, consequently, a more compact and less elastic casein matrix [Madadlou et al., 2006]. However, a significant increase in the number of bonds between casein molecules not only increases a product’s firmness (higher value of G′), but also significantly decreases elasticity and increases susceptibility to damage under exposure to increasing strain [Wium & Qvist, 1998], as demonstrated by the present findings.
Table 6
Textural and rheological parameters of fresh cheeses.
[i] The presented values are means with standard deviation. Mean values marked with different letters (a–f) in columns differ significantly at p≤0.05. Fresh cheeses produced from: C, milk with the addition of skimmed milk powder (control sample); MCC_F, liquid micellar casein concentrate; RMFB_F, liquid buttermilk protein concentrate; RUFP_F, mixture of liquid milk micellar casein concentrate and liquid buttermilk serum protein concentrate; M_MCC, milk with the addition of micellar casein powder; M_RMFB, milk with the addition of buttermilk protein powder; M_RUFP, milk with the addition of a mixture of milk micellar casein and buttermilk serum protein powder.
The storage moduli (G′) of the examined cheeses are compared in Figure 2B. In all products, G′ values were not highly influenced by frequency, and the curves were characterised by similar shapes and trends. Similar trends were also found for G″ values (data not shown). At each tested frequency, the value of G′ was higher than the value of G″, which implies that all samples had a well-organised, elastic gel structure, where both G′ and G″ were nearly independent of frequency. These results may point to the high stability of products during storage and packaging [Lucey, 2002].
The results of the rheological analysis were highly accurately predicted (R2>0.999) by the power law model, which is widely used to describe the rheological properties of foods that are non-Newtonian fluids [Saleh et al., 2020; Zhu et al., 2015]. The flow behaviour index (n) of all products was below 1 (0.70–0.83), which indicates that the tested samples had a stable and elastic structure and were moderately susceptible to shear thinning (Table 6). The lowest n value, with an average of 0.71, was found in samples C, MCC_F and RUFP_F, which could point to the low stability of the protein matrix and susceptibility to internal regrouping that can lead to curd shrinkage and gradual separation of whey during prolonged storage. The consistency index (κ) was significantly influenced by both the type of protein formulation and the form in which it was added. As expected, in general the flow consistency index was high in the products containing micellar casein concentrate (MCC), as shown in Table 6. This can be attributed to the strong water-binding capacity of micellar casein and its ability to form a robust and interconnected protein network, which enhances the viscosity and structural stability of dairy products [Lucey & Singh, 1997]. In contrast, the addition of buttermilk protein concentrate in RMFB products resulted in a significant reduction (p≤0.05) in κ, with decreases of approximately 75% and 95% for RMFB_F and M_RMFB, respectively. This reduction in κ is likely due to the lower water-binding capacity and weaker network-forming properties of buttermilk proteins compared to micellar casein. Such a reduction may be advantageous for products where a creamier and less viscous texture is desired, improving consumer acceptability, particularly for dessert applications. Interestingly, RUFP products, which included a combination of micellar casein and buttermilk proteins, exhibited a significantly higher κ than RMFB products. This suggests the presence of synergistic interactions between micellar casein and buttermilk proteins, which contribute to the formation of a denser and more cohesive protein network. These interactions may arise from the complementarity of micellar casein’s network-forming ability and buttermilk proteins’ emulsifying properties, resulting in enhanced rheological performance.
The values of firmness and penetration force were highest in fresh cheeses produced from liquid micellar casein concentrate (MCC_F) or milk with the addition of micellar casein powder (M_ MCC) (Table 6). Cheeses made from milk micellar casein powder combined with buttermilk serum protein powder (M_RUFP) were characterised by lower firmness (21.96 N) and lower penetration force (91.59 N×s). The values of these texture parameters were lowest in fresh cheeses produced from buttermilk proteins (RMFB_F and M_RMFB). The high values of firmness and penetration force in the fresh cheeses produced from raw materials with a high content of MCC indicate that micellar casein positively affects cheese texture by increasing the strength of the acid curd. The high values of texture parameters in MCC_F cheese confirm the previous hypothesis that gelation and a decrease in pH occur naturally during the production of fresh cheeses.
Microstructure and fractal analysis of fresh cheeses
Fresh cheeses have an irregular and porous surface which is influenced by the raw materials used in the production process. In the image analysis, similarities were observed in the microstructure of cheeses produced from sweet buttermilk proteins (RMFB_F and M_RMFB) or casein concentrate combined with buttermilk serum proteins (RUFP_F and M_RUFP). The micrographs revealed clear differences between MCC_F and M_MCC (Figure S1 in Supplementary Materials). The fractal dimension was calculated to accurately and objectively describe the microstructure of cheese samples and compare the irregularity and porosity of cheese sample surfaces [Dziuba et al., 1997]. Image analysis is becoming a common methodology in research. Self-similarity, namely the similarity of the observed structure regardless of the scale of magnification (or reduction), may be indicative of its fractal nature. The fractal dimension (D) is calculated to evaluate the degree of structural disorder. The value of D indicates the degree to which space is filled with matter; it describes a product’s spatial structure, and enables a comparison of the studied samples [Barrett & Peleg, 1995; Smoczyński & Baranowska, 2014]. In the present study, the fractal dimension of the tested cheeses was calculated based on the results of the image analysis. The values of D were relatively high in the range of 1.40 to 1.65. The coefficient of determination (R2) ranged from 0.88 to 0.93 (Table 7). An exemplary log-log plot for calculating the fractal dimension is presented in Figure S2 in Supplementary Materials. The fractal dimension was smallest in the cheeses produced from liquid or powdered MCC. Cheese samples M_RMFB and M_RUFP were characterised by similar values of D (1.48–1.50) despite differences in their microstructure. Much greater differences in D values were observed in cheeses made from liquid high-protein fractions, and the analysed parameter was highest in RUFP_F cheese. In addition, the fractal dimension was higher in cheeses produced from liquid high-protein fractions than from milk with the addition of the corresponding high-protein powders. A high value of D is indicative of a rough surface and a complex microstructure. The observed differences in the fractal dimension affected the texture, creaminess, hardness, fluffiness and sensory acceptability of the analysed cheeses.
Table 7
Fractal dimensions of the fresh cheeses determined in the image analysis.
| Fresh cheese | Coefficient of determination | Fractal dimension |
|---|---|---|
| C | 0.90 | 1.49 |
| MCC_F | 0.88 | 1.44 |
| RMFB_F | 0.92 | 1.53 |
| RUFP_F | 0.90 | 1.65 |
| M_MCC | 0.93 | 1.40 |
| M_RMFB | 0.92 | 1.48 |
| M_RUFP | 0.93 | 1.50 |
[i] Fresh cheeses produced from: C, milk with the addition of skimmed milk powder (control sample); MCC_F, liquid micellar casein concentrate; RMFB_F, liquid buttermilk protein concentrate; RUFP_F, mixture of liquid milk micellar casein concentrate and liquid buttermilk serum protein concentrate; M_MCC, milk with the addition of micellar casein powder; M_RMFB, milk with the addition of buttermilk protein powder; M_RUFP, milk with the addition of a mixture of milk micellar casein and buttermilk serum protein powder.
Sensory analysis of fresh cheeses
Fresh cheeses produced from high-protein milk and buttermilk preparations were evaluated for five groups of attributes: appearance, aroma, texture, mouthfeel, taste, and overall acceptability, in the sensory analysis. The results are presented in Table 8. In terms of appearance, all fresh cheeses were characterised by intensively uniform colour, regardless of the applied high-protein preparations (p>0.05). The examined cheeses differed in creamy colour (p≤0.05), and the cheese made from M_RUFP was characterised by the creamiest colour. The authors’ previous study investigating the enrichment of non-fermented milk with protein preparations revealed that the addition of serum protein concentrate led to a minor increase in the intensity of the creamy colour [Kiełczewska et al., 2022]. Minor whey leakage was observed in the cheeses made from RUFP_F, M_RMFB, and RMFB_F, but not in the remaining products (p≤0.05). A high degree of granularity was noted in the cheeses made from MCC, regardless of whether it was added in liquid or powdered form during the production process. In turn, granularity was not at all visible in M_RMFB cheese (p<0.05).
Table 8
Mean values of the sensory attributes of fresh cheeses.
[i] Mean values marked with different letters (a–e) in rows differ significantly at p≤0.05. Fresh cheeses produced from: C, milk with the addition of skimmed milk powder (control sample); MCC_F, liquid micellar casein concentrate; RMFB_F, liquid buttermilk protein concentrate; RUFP_F, mixture of liquid milk micellar casein concentrate and liquid buttermilk serum protein concentrate; M_MCC, milk with the addition of micellar casein powder; M_RMFB, milk with the addition of buttermilk protein powder; M_RUFP, milk with the addition of a mixture of milk micellar casein and buttermilk serum protein powder.
Fresh cheeses differed in the overall aroma intensity and also in milky, sour, and atypical aromas (p≤0.05). The highest overall aroma intensity was noted in M_MCC, followed by RMFB_F and RUFP_F. The overall aroma intensity was lowest (but still moderate) in MCC_F cheese. This cheese was also characterised by the least smellable milky and sour aromas. In turn, the sour aroma was most pronounced in M_MCC cheese. These observations indicate that the form of MCC (liquid or powder) used in the production process affected the aroma of the end products. Most cheeses were also characterised by a weak atypical aroma which, according to the panellists, resembled the aroma of boiled milk. The atypical aroma was most distinctive (but moderate) in RUFP_F cheese. A rancid aroma was also detected in this product.
Statistical differences were also observed in texture attributes (p≤0.05). M_RMFB cheese was characterised by the highest mean scores of uniformity, viscosity, spreadability (with mean scores over 4), and minimal firmness. The distribution of textural attributes was similar in the control cheese and in the cheeses produced from RMFB_F and RUFP_F. However, the cheeses with the addition of both liquid and powdered RMFB were characterised by the lowest firmness. In turn, the cheese with the addition of liquid MCC was characterised by higher firmness and lower viscosity than the remaining products. Moreover, both MCC cheeses were characterised by the lowest spreadability. According to Suthar et al. [2017] and Simov et al. [2005], micellar casein influences the textural attributes of cheese, in particular firmness. Cheese produced from M_RUFP was rated slightly different in terms of textural attributes. Its uniformity of texture, firmness, viscosity, and spreadability were evaluated as moderate.
Fresh cheeses differed in mouthfeel-associated attributes (p≤0.05), i.e., wateriness, mealiness, creaminess, and adhesiveness. The control sample and the cheeses produced from M_RMFB and RMFB_F were characterised by moderate wateriness (mean scores between 2.1–2.4), whereas the remaining samples were evaluated as less watery (with mean scores less than 2.0). Cheeses produced from liquid or powdered MCC were characterised by moderate mealiness. Creaminess was most distinctive in the cheese produced from M_RMFB, and least distinctive in the samples produced from liquid or powdered MCC. Adhesiveness was most detectable in the control sample and in M_RMFB cheese, and least detectable in the cheese produced from MCC_F cheese.
Differences were also detected in taste attributes such as overall intensity, milky, sour, bitter, atypical tastes, and overall acceptability (p≤0.05). Cheeses produced from M_RMFB and RMFB_F were characterised by a very high intensity of the overall taste, with a predominance of a strong sour taste. The overall taste intensity was also very high in the control sample, but a sour taste was moderate. Milky taste was weakly detectable in most cheeses, excluding the control sample, RMFB_F, and RUFP_F samples which had a moderately milky taste. Bitter taste was most intense in RMFB_F sample, and atypical taste was most intense in the cheeses produced from M_RMFB and RUFP_F, where it was described as rancid. Sweet taste intensity was evaluated as low in all analysed products (p>0.05). Thus, sweet taste was not enhanced, which is typical of dairy products enriched with whey preparations [Królczyk et al., 2016]. Sample M_RUFP received the highest mean score for overall acceptability (just before the control sample), whereas sample MCC_F received the lowest score due to the highest firmness, lowest spreadability, and lowest overall taste intensity.
CONCLUSIONS
Skimmed milk and buttermilk fractions separated by membrane filtration and the Lb. acidophilus LA-5 culture can be used in the production of probiotic fresh cheeses. In the examined cheeses, Lb. acidophilus LA-5 counts exceeded log 6 cfu/g on the 21st day of storage. Therefore, the analysed fresh cheeses met the requirements for probiotic products and could be classified as functional foods. In turn, raw materials with a varied content and composition of skimmed milk and buttermilk proteins can be applied to produce fresh cheeses with different physicochemical, rheological, and sensory properties. The examined cheeses differed in pH, which affected their calcium and phosphorus content. Fresh cheeses produced from raw materials with a high content of micellar casein were characterised by the highest pH and the highest retention of calcium and phosphorus. In comparison with the remaining products, these cheeses were also characterised by the highest firmness and the lowest fractal dimension in the microstructure analysis. Regardless of the type of high-protein preparations used in the production process, all cheeses exhibited pseudoplastic flow behaviour characteristic of shear-thinned fluids in the power law model. The rheological analysis revealed that curd quality should not deteriorate during storage and packaging. The flow behaviour index was lowest in the fresh cheese produced from raw material rich in micellar casein, which could suggest that the resulting protein matrix was less stable than in the remaining products.
The sensory analysis revealed significant differences in relation to most of the tested attributes, but the fresh cheese produced from milk with the addition of micellar casein combined with buttermilk serum proteins achieved the highest score for these attributes. The use of only the liquid fraction of micellar casein combined with buttermilk serum proteins resulted in the rejection of the product mainly due to its atypical aroma. The cheeses produced from raw materials rich in milk micellar casein were least spreadable, most granular and mealy. In turn, the products made from buttermilk protein preparations were excessively viscous and sour in taste.
The use of protein concentrates, in particular micellar casein, in the production of fresh cheeses could be an effective strategy for increasing calcium content and improving the Ca to P ratio, which enhances calcium bioavailability. In summary, the present study provides valuable insights for optimising the production of high-protein probiotic foods, enhancing their sensory attributes and health-promoting properties. Special attention should be paid to the changes induced by protein gelation during acid coagulation above the isoelectric point of casein. The resulting knowledge can be used to develop food products that not only meet consumer preferences regarding taste and texture but also deliver health benefits.