INTRODUCTION
Satiety is the feeling of fullness occurring after a meal which suppresses hunger and prevents further eating, measured by the satiety index [Gerstein et al., 2004]. It is affected by multiple factors, such as consumer beliefs about the food, food sensory characteristics, macronutrients composition, volume, and weight [Yeomans, 2020]. Different macronutrients have different effects on satiety and its intensity. Previous studies showed that the macronutrients that provide the highest and most persistent satiety were protein and fiber, respectively [Ahmed et al., 2014; Akhlaghi, 2024; Drozdowska et al., 2020; Palupi et al., 2024].
The Indonesian dietary pattern is high in carbohydrate but low in protein, fiber, and vitamin. A previous study [Khusun et al., 2023] found that the median intake of fiber among Indonesian adult was 6.2 g/day, not even half of the national dietary recommendation for adult, which was 29.0–37.0 g/day [Ministry of Health of the Republic of Indonesia, 2019]. The macronutrient intake in Indonesia was dominated by carbohydrates, especially from white rice, with its consumption reaching 81.1 kg/cap/year in 2022 [Central Statistics Agency of the Republic of Indonesia, 2024]. Beside white rice, the carbohydrate food commodity that was consumed majorly was wheat flour, reaching 24.1 kg/cap/year in 2022 [UNICEF, 2023]. Wheat flour was utilized into many types of food. However, it was very poor in dietary fiber, the content of which was only 0.3 g/100 g [Ministry of Health of the Republic of Indonesia, 2017]. Other than that, wheat was not native to Indonesia and was imported from other countries, including Canada, Australia, and the United States [Anugraheni et al., 2024]. In 2022, Indonesia imported 9.5 million ton to meet the wheat flour demand [UNICEF, 2023]. To overcome the dependence of wheat flour while also overcoming the problem of fiber deficiency, a substitution using local food with a high dietary fiber content can be implemented.
Indonesia has many indigenous foods with a high fiber content that are underutilized. One of them is Bogor taro (Colocasia esculenta), which has a fiber content of 0.9 g/100 g [Ministry of Health of the Republic of Indonesia, 2017]. However, Bogor taro production has been decreasing since 2008, from 57.0 thousand ton to 11.2 thousand ton in 2019 [Central Statistics Agency of the Republic of Indonesia, 2020]. Bogor taro has low growing demand due to its high calcium oxalate content. It appears in the form of a needle, which can penetrate skin and cause irritation and itching sensation when eaten [Rashmi et al., 2018]. A new variety of Bogor taro with 90% lower oxalate content has been registered under the name Febi521 (hereafter, non-itchy taro) by the Ministry of Agriculture of The Republic of Indonesia [Nurilmala et al., 2024]. The reduction in oxalate content made the taro not cause itchiness. The water content of this taro variety is 72.4 g/100 g, which was categorized as high, hence reducing the shelf-life. To overcome the short shelf-life, in our previous study, non-itchy taro was processed into flour, and utilized along with modified cassava flour to develop egg roll cookies [Nurilmala et al., 2024]. Cookies are a popular snack among Indonesian, with the consumption of 24.3 kg/cap/year and increasing each year [Central Statistics Agency of the Republic of Indonesia, 2022]. Incorporating non-itchy taro into egg roll cookies could enable reducing wheat flour use, while also utilizing available local food.
Our previous study showed that the egg rolls made from the blends of non-itchy taro flour and modified cassava flour in different proportions had varied macronutrients content and all of them produced a low glycemic index [Nurilmala et al., 2024]. However, the satiety index of non-itchy taro-based egg roll is still unknown. Therefore, the objective of this study was to determine the satiety indices of egg roll cookies from non-itchy taro flour and its blends with modified cassava flour and compare them with wheat egg roll cookies and white bread.
MATERIALS AND METHODS
This research has obtained permission from the Commission on Research Ethics Involving Human Subjects, IPB University Number: 1227/IT3.KEPMSM-IPB/SK/2024.
Subjects recruitment
Fourteen subjects (8 women and 6 men) were recruited using purposive sampling. The subjects would be eligible if they (1) were between 19 to 23 years old, (2) had normal body mass index (BMI) (18.5–22.9 kg/m2), and (3) had normal fasting blood glucose (FBG) (70–99 mg/dL). The subjects would be excluded if they (1) were allergic to egg and/or taro, (2) had history of diabetes (including parents and grandparents), (3) were on a specific diet, (4) were undergoing a medical treatment, (5) were suffering from chronic diseases or complications, (6) were having indigestion, (7) were pregnant or lactating, (8) were an active smoker, and (9) were not willing to be interviewed and have their nutritional status measured. Informed consent was obtained from each subject before the test. All subjects completed the test; however, 3 subjects were eliminated due to human error in questionnaire filling, making the satiety score abnormally shifting up and down and the satiety index abnormally higher than the rest of the subjects. A sample size of 11 was still considered acceptable for satiety index study [Holt et al., 1995]. While a larger sample size would increase the statistical power and generalizability, the current sample size can still provide valuable insights.
Test foods
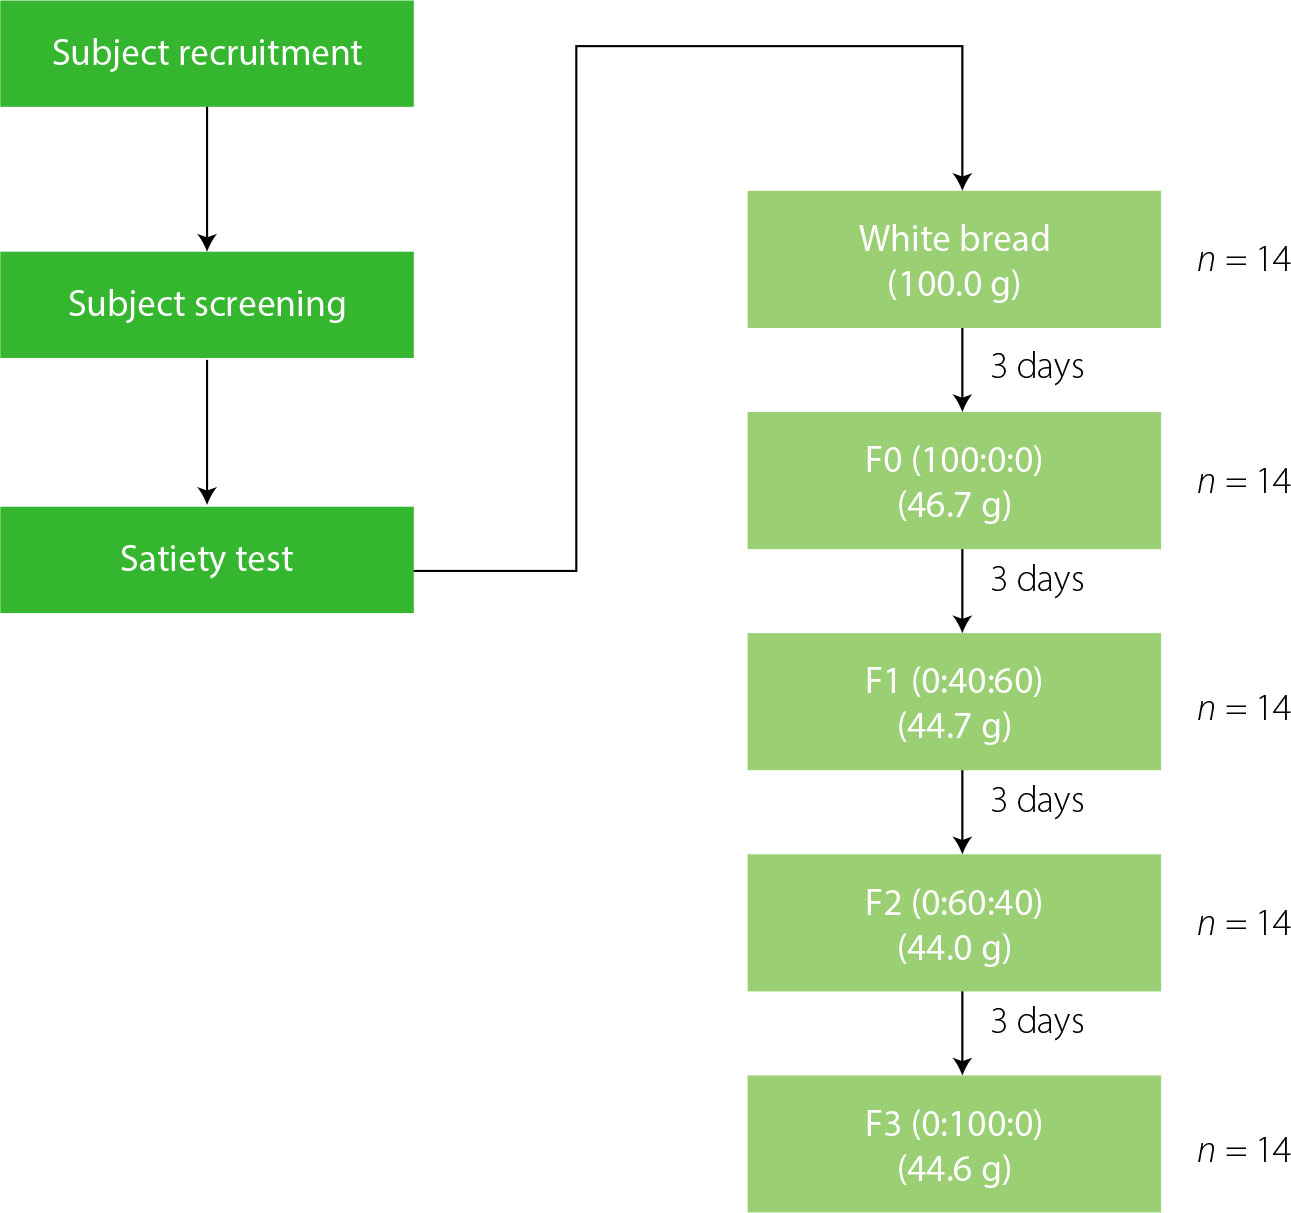
Four formulas of egg roll cookies with different flour composition were used in this study. The formulas contained wheat flour (WF), taro flour (TF), and blends of TF with modified cassava flour (MF): F0 (100% WF), F1 (40% TF:60% MF, w/w), F2 (60% TF: 40% MF, w/w), and F3 (100% TF) [Nurilmala et al., 2024]. WF and MF were commercially bought from a market. The TF was made from Febi521 (non-itchy) taro, which was developed through in vitro somaclonal induction, resulting in a new taro variety with a 90% lower oxalate content. The taro was subsequently processed into flour [Nurilmala et al, 2024; Nurilmala & Mardiana, 2019]. White bread was used as a standard for satiety index calculation according to Holt et al. [1995], and F0 was used to produce standard egg roll cookies. The white bread was made using a recipe from the US Dairy Export Council [US Dairy Council, 2014], which consisted of medium-protein wheat flour 12.7 g/100 g (70.4%), water (10%), granulated sugar (6.3%), yeast (0.8%), and whole milk powder (0.8%). The egg roll cookies were produced from WF, MF, and TF with the respective composition (20.2%), egg (42.1%), margarine (6.7%), butter (13.5%), sugar (16.8%), and powdered milk (0.7%) [Nurilmala et al., 2024]. Each food product was provided isocalorically in 1,000 kJ (240 kcal). According to the energy content, F0 was given 46.7 g, F1 was given 44.7 g, F2 was given 44.0 g, F3 was given 44.6 g, and white bread was given 100.0 g. One cup of water (220 mL) was also provided to aid the ingesting process.
Test procedure
Prior to the first session, subjects’ nutritional status was measured, including body weight and body height, followed by BMI calculation. The night before the session, the subjects were asked to fast for 8–10 h and to keep their physical activity as usual. This study used a semi-crossover design. On the first session, the subjects were given white bread. They were asked to eat the white bread in 10 min and fill the satiety visual analogue scale (VAS) questionnaire consisting of four indicators: (1) hunger score, (2) satiety score, (3) desire to eat score, and (4) prospective food consumption score. The subjects were told to draw a vertical line between a 100-mm horizontal scale, with the left end indicating least hungry/satiated/desire to eat/prospective food consumed, while the right end indicating the opposites. The satiety VAS questionnaire was filled 7 times with 30 min interval: 0, 30, 60, 90, 120, 150, and 180 min.
After the session, a 3-day washout was conducted to ensure that the physiological condition had returned to normal. The order of the test food products offered were egg roll cookies from F0, F1, F2, and F3. The flow diagram of the test procedure is shown in Figure 1.
Data processing and statistical analysis
The results of this study were processed using Microsoft Excel (Microsoft Corporation, Redmond, WA, USA) and analyzed using IBM SPSS version 26.0 for Windows (IBM, Armonk, NY, USA). The homogeneity of subject characteristics was analyzed using the coefficient of variation percentage (%CV). The data of subject characteristics was considered homogenous if the %CV for BMI was equal to or less than 5% [Jamaiyah et al., 2010] and %CV for fasting blood glucose was less than 33% [Mo et al., 2021]. The %CV was calculated using Equation (1) [Ulijaszek & Kerr, 1999]:
The satiety score (SS) was obtained by measuring the distance between the left point and the vertical line drawn by the subject. The result was plotted into a line chart, and the area under the curve (AUC) was calculated to determine the total score. Then, the satiety index was calculated using Equation (2) based on Holt et al. [1995]:
For food product with the highest SS at 180 min, the SS was later used together with the regression equation of curve SS vs. time for WB to determine the satiety prolonging effect of the tested food product compared to WB as a reference [Palupi et al., 2024]
The scores of the other indicators, including desire to eat score (DES), hunger score (HS) and prospective consumption score (PCS), were obtained using the same way mentioned before. Then, appetite scores were calculated using scores of the four indicators according to Equation (3) [Anderson et al., 2002]:
The satiety score and appetite score were analyzed using one-way analysis of variance (ANOVA) and repeated two-way ANOVA, while the satiety index was analyzed using one-way ANOVA. If there were significant differences, the data were further analyzed using post-hoc Duncan’s test. The results were considered significantly different if the p-value was lower than the α (p<0.05). Correlation between macronutrients and satiety index was analyzed using a Spearman correlation test.
RESULTS AND DISCUSSION
Subjec ts characteristics
The characteristics of the subjects of this study are presented in Table 1. Subjects were 11 adults (6 women and 5 men) with the age ranging from 19 to 23 years (the average age was 21.55 years). The age range was taken from the regulation of the Ministry of Health of the Republic of Indonesia number 28, year 2019 [Ministry of Health of the Republic of Indonesia, 2019]. It was assumed that the subjects in the age range of 19–23 years would have similar nutritional needs. The average BMI of the subjects was 21.40 kg/m2, while the average FBG of the subjects was 89.36 mg/dL. The inclusion criteria of normal BMI and FBG were determined to prevent bias.
Table 1
Characteristics of subjects.
Based on the calculation of %CV, all characteristics were considered homogenous. This meant that the result of this study could represent the satiety index of egg roll cookies.
Nutrient content per portion
Holt et al. [1995] stated that there was an effect of the type of macronutrients on the level of satiety of the consumer. The egg roll cookies, given to the subjects in our study, varied in the flour composition in the formula and, therefore, also in their nutrient profile. The nutrient contents of egg roll cookies from wheat flour, non-itchy taro flour and blends of non-itchy taro and modified cassava flours per 100 g were reported in our previous study [Nurilmala et al., 2024]. Table 2 shows nutrient contents per portion (1,000 kJ or 240 kcal). The substitution of wheat flour with non-itchy taro flour and modified cassava flour increased the contents of fat and dietary fiber, but also decreased the content of protein. The F1, F2 and F3 portions had a lower protein content than F0, but their protein content successively increased as the contribution of non-itchy taro flour in the cookie formula increased. Conversely, both the total carbohydrates and available carbohydrates decreased with the increase in taro flour content. These results were due to the nature of wheat flour, with a higher protein and carbohydrate content, but also a lower dietary fiber content compared to modified cassava flour and taro flour [Ministry of Health of the Republic of Indonesia, 2017]. Meanwhile, the portion of white bread made with wheat flour and entirely different recipe had the highest contents of protein, total carbohydrates, available carbohydrates, and dietary fiber.
Table 2
Nutrient content per serving (240 kcal) of white bread (WB) and egg roll cookies from wheat flour (F0), non-itchy taro flour (F3) and blends of non-itchy taro and modified cassava flours (F1 and F2)*.
* Based on nutrient composition determined in our previous study [Nurilmala et al., 2024]. Fn (x:y:z) – the combination of x% wheat flour, y% non-itchy taro flour, and z% modified cassava flour (w/w/w). Numbers followed by different letters in the same row mean that the results are significantly different (p<0.05) according to the analysis of variance with the Duncan’s post hoc test.
According to previous studies [Chambers et al., 2015; Daly et al., 2020; Santo-Hernandez et al., 2018], the protein was known to elicit the highest satiety effect, while the effect of carbohydrates and fat on the satiety level was still up to debate [Chambers et al., 2015]. Beside protein, fiber was also known to affect satiety [Munekata et al., 2021]. Based on the known fact, it was expected that WB would produce the highest satiety index.
Appetite score, satiety score, and satiety index
Appetite score was calculated using four indicators including hunger, satiety, desire to eat, and prospective consumption score. These indicators for white bread and egg roll cookies at different times after consumption are shown in Tables S1–S3 in Supplementary Materials. The hunger score for non-itchy taro egg roll cookies (F3) was significantly (p<0.05) lower than these for WB, wheat flour egg roll cookies (F0), and egg roll cookies with larger contribution of modified cassava flour (F1) at the 180th min after consumption. Sample F3 experienced a significant increase of hunger score the latest, from the 150th min after consumption. There were no significant (p≥0.05) differences in both the desire to eat score and the prospective consumption score across all tested food products at any time point. For both WB and sample F3, desire to eat score increased significantly starting from the 120th min after consumption, while for the rest of the egg roll cookies, it significantly increased from the 90th min after consumption. Meanwhile, no clear pattern was observed regarding the timing of significant prospective consumption score increases.
The appetite score was significantly affected by both the tested food product (p=0.002) and the time after consumption (p=0.000), but the interaction of food product and time after consumption did not significantly affect its value (p=1.000). Consumption of WB and F3 caused a significant appetite score increase at the 90th min, while in the case of the rest of the food products the increase occurred earlier, at the 60th min. Besides that, there was no significant difference in the appetite score detected between all food products each time (p≥0.05) (Table 3).
Table 3
Appetite score (mm) after the consumption of white bread (WB) and egg roll cookies from wheat flour (F0), non-itchy taro flour (F3) and blends of taro and modified cassava flour (F1 and F2).
[i] Fn (x:y:z) – the combination of x% wheat flour, y% non-itchy taro flour, and z% modified cassava flour (w/w/w). Superscripts with lowercase indicate significant differences (p<0.05) between columns, superscripts with uppercase indicate significant differences between rows according to one-way analysis of variance (ANOVA) with Duncan’s post hoc test. Food product effect: p=0.000, time effect: p=0.000, formula-by-time effect: p=1.000 according two-way ANOVA.
The same effects were found for the satiety score, e.g., the tested food product (p=0.000) and the time after consumption (p=0.000) significantly affected its value, but the interaction of food product and time after consumption did not (p=1.000). All samples experienced a significant decrease of the satiety score at the same time, from the 90th min (Table 4). However, it was found that the egg roll cookies from non-itchy taro flour (sample F3) produced a significantly higher satiety score compared to WB and wheat egg roll cookies on the last minutes (p<0.05). Then, we compared the ability of WB (as the standard) and egg roll cookies with the highest satiety score at the 180th min after consumption (sample F3) on prolonging satiety. To do that, the satiety score of sample F3 at the 180th min after consumption (41.91) was applied alongside the regression equation established using white bread as a reference (Equation 4), with the axis y as the satiety score and the axis x as the time after consumption:
Table 4
Satiety score (mm) after the consumption of white bread (WB) and egg roll cookies from wheat flour (F0), non-itchy taro flour (F3) and blends of non-itchy taro and modified cassava flour (F1 and F2).
[i] Fn (x:y:z) – the combination of x% wheat flour, y% non-itchy taro flour, and z% modified cassava flour (w/w/w). Superscripts with lowercase indicate significant differences (p<0.05) between columns, superscripts with uppercase indicate significant differences between rows according to one-way analysis of variance (ANOVA) with Duncan’s post hoc test. Food product effect: p=0.000, time effect: p=0.000, formula-by-time effect: p=1.000 according two-way ANOVA.
It was found that WB produced the same satiety score as non-itchy taro egg roll cookies 85 min earlier. As a result, it can be concluded that consuming non-itchy taro egg roll cookies prolonged the feeling of fullness by 85 min compared to WB.
The egg roll cookies, from the lowest to the highest satiety index, were produced from F0 (103.92), F2 (119.44), F1 (121.32), and F3 (131.18). A significant (p<0.05) difference was found between the wheat egg roll cookies (F0) and the non-itchy taro egg roll cookies (F3). Even though numerically each sample produced a higher satiety index than the white bread (100), statistically only the egg roll cookies produced from F3 produced a significantly higher satiety index (p<0.05) (Figure 2).
Figure 2
Satiety index of wheat bread (WB) and egg roll cookies from different flours: Fn (x:y:z), the combination of x% wheat flour, y% non-itchy taro flour, and z% modified cassava flour (w/w/w). The different lowercase letters above the bar indicating significant differences (p<0.05).
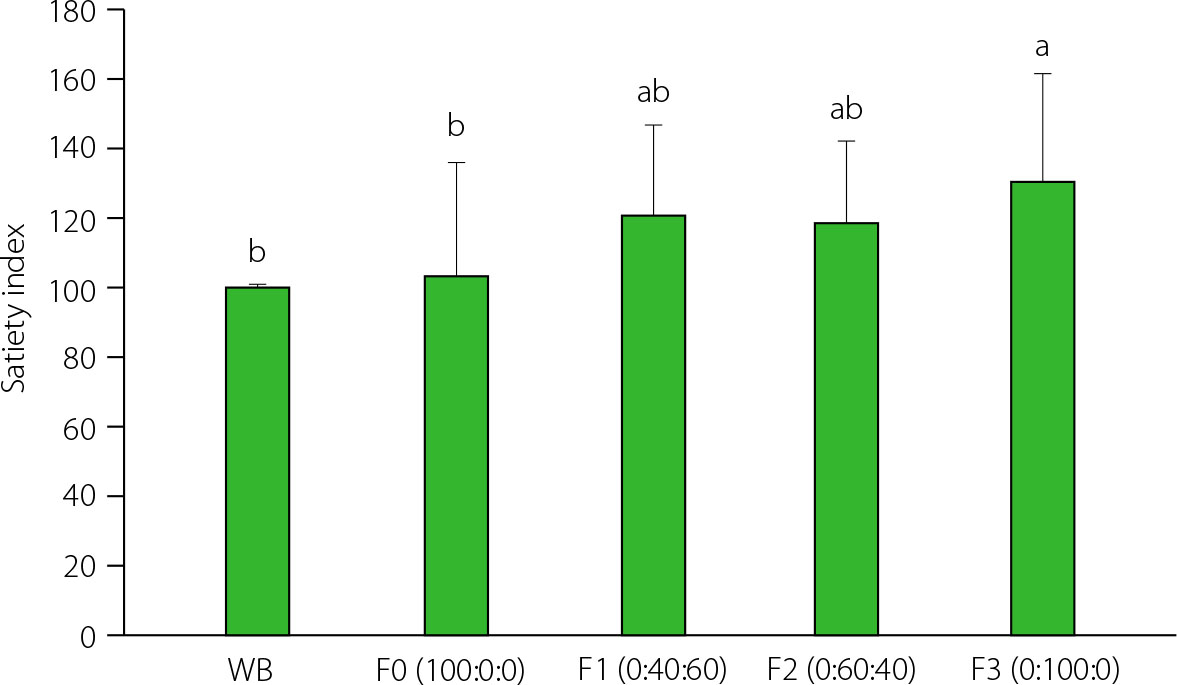
As mentioned above, based on the nutrient composition, it was expected that WB would produce the highest satiety index. Instead, the satiety index of WB was the lowest, while the highest satiety index was produced by the non-itchy taro flour egg roll cookies. In contrast with this result, Santaliestra-Pasías et al. [2016] and Daliani et al. [2019] stated that white bread enrichment with fiber increased fullness and satiety perception, and decreased hunger compared to conventional white bread, indicating that fiber increases satiety. The several factors might explain the differences in our findings and the literature data: the available carbohydrates, types of fiber, types of protein, and types of fat [Chandler-Laney et al., 2019; Granger et al., 2018; Salleh et al., 2019; Szutowska, 2020].
Sensory characteristics and palatability of a product also affect both satiety and appetite [Abeywickrema et al., 2022]. The sensory evaluation of non-itchy taro egg rolls had been conducted previously [Nurilmala et al., 2024]. According to those studies, egg roll cookies from non-itchy taro flour achieved the best total acceptability scores and their characteristics were not significantly different compared to those of wheat egg roll cookies.
Correlation between macronutrient content and satiety index
The results of correlation analysis between macronutrient content per portion and satiety index of the egg roll cookies are shown in Table 5. There was a significant correlation between fat content and satiety index (p=0.042) with a positive correlation coefficient (r=0.307) as well as between carbohydrates and satiety index (p=0.049) with a negative correlation coefficient (r=–0.299). Moreover, the satiety index significantly, positively correlated with the total dietary fiber content (p=0.024, r=0.340) and with the insoluble fiber content (p=0.028, r=0.332). Unexpectedly, the correlation of the satiety index with protein was insignificant (p=0.085). These results were not completely in accordance with a previous study by Holt et al. [1995] about the satiety index of several types of food, who stated that an increased fat content was correlated with a lower satiety index, while carbohydrate content was not significantly correlated with the satiety index. Meanwhile, Chandler-Laney et al. [2014] stated that carbohydrates caused rapid hunger.
Table 5
Correlation between satiety index and contents of individual macronutrients per portion of egg roll cookies.
| Macronutrient | r | p-Value |
|---|---|---|
| Protein | −0.263 | 0.085 |
| Fat | 0.307 | 0.042* |
| Carbohydrates | −0.299 | 0.049* |
| Total dietary fiber | 0.340 | 0.024* |
| Soluble fiber | 0.200 | 0.193 |
| Insoluble fiber | 0.332 | 0.028* |
Available carbohydrates are related to the glycemic index (GI), where food with a high content of available carbohydrates tends to have a high GI [Afandi et al., 2019]. High GI foods cause a spike in blood glucose, which triggers rapid hunger [Al-Sowayan et al., 2023; Chandler-Laney et al., 2014]. A previously published study from our project demonstrated that each egg roll cookie, regardless of the type of flour used, had low GI [Nurilmala et al. 2024]. The egg roll cookies from lowest to highest GI were produced according formulas F3 (39), F0 (47), F1 (49), and F2 (50). This was in contrast with white bread, whose GI was 70 and made it categorized as high GI [Vardhan et al., 2024].
As for fiber, the type of fiber (soluble and insoluble) affects satiety through different mechanisms. Soluble fiber affects satiety through the slowing of the gastric emptying rate and fermentation by gut-microbiota, which triggers the hormone glucose-like-peptide 1 and peptide tyrosine-tyrosine, while insoluble fiber affects satiety through stomach distensing [Granger et al., 2018; Salleh et al., 2019; Szutowska, 2020]. Previous study considered soluble fiber, which was found to preserve satiety better than insoluble fiber [Alhabeeb et al., 2021].
Numerous studies have examined the relationship between satiety and various macronutrients, yielding diverse results [Akhlagi, 2024; Luhovyy et al., 2014; Munekata et al., 2021; Warrilow et al., 2019]. A consensus exists, however, regarding the hierarchy of macronutrients in influencing satiety, with protein being the most satiating, followed by carbohydrates and fats, although their effects remain inconclusive (protein > carbohydrates = fat). Meanwhile, fiber was thought to preserve satiety [Akhlagi, 2024]. However, prior researches proved that fiber affected satiety differently depending on its medium [Munekata et al., 2021]. Research by Luhovyy et al. [2014] found that there was no effect of consumption of resistant starch-enriched cookies on subjective appetite. Further investigations into satiety have proposed that, similarly to fiber, the type of fat, depending on its saturation, affects satiety in varying degrees. Polyunsaturated fatty acids are the most satiating, followed by monounsaturated fatty acids, and saturated fatty acids [Monnard & Dulloo, 2021]. In our study, the egg roll cookies produced from F3, with significantly higher contents of insoluble fiber and fat per portion than WB produced a higher satiety index (despite their soluble fiber content was significantly lower). Additionally, research by Warrilow et al. [2019] suggested that there was no significant effect of the fat-fiber interaction on satiety. These findings, along with the result of this study, suggest that the role of fat in satiety may be more significant than previously recognized, and hence further investigation into the interaction between macronutrients on satiety is needed.
Implications and limitations
Indonesia is a country with diverse foods, although lots of local foods have not been widely utilized. Through this study and a previous one [Nurilmala et al., 2024], we found that the substitution of wheat flour with non-itchy taro flour in egg roll cookies resulted in products with a lower glycemic index and a higher satiety index, and potentially gluten-free. Diverse nutrient contents of the local foods can be used to help overcome nutritional problem. Besides, utilizing local foods is one way to empower local community and contribute to rural development [Stein & Santini, 2022]. Thus, researchers and food manufacturers should feel encouraged to explore other local foods.
This research has several limitations that may impact the generalizability of its findings. Firstly, the sample size was small, reducing the statistical power and potentially limiting the ability to detect significant effects. Additionally, the age range of the subjects was narrow, which means the results may not be applicable to broader, more diverse populations. The method used to measure satiety relied on a subjective questionnaire, which could introduce biases related to selfreporting and individuals’ interpretations of their feelings of fullness. Finally, the complexity of satiety was not fully explored in this study. Further research is, therefore, needed to investigate the various factors affecting satiety.
CONCLUSIONS
In conclusion, this study showed that among the egg roll cookies with different flour compositions, those made from non-itchy taro flour (F3) produced a higher satiety index compared to white bread (WB) and wheat-based egg roll cookies (F0) in healthy, normal-weight adults. Furthermore, the F3 egg roll cookies prolonged satiety by 85 min compared to white bread. The portion of F3 egg roll cookies (240 kcal) was high in fat and fiber while being low in available carbohydrates. A positive correlation was observed between the satiety index and fat, total dietary fiber, and insoluble fiber, whereas the carbohydrate content was negatively correlated with satiety. Unexpectedly, the correlation between the satiety index and the protein content was not significant. These findings suggest that substituting wheat flour with taro flour in egg roll cookies may enhance satiety, highlighting the potential role of fat and fiber in satiety regulation. However, further research is needed to investigate the effect of interaction between macronutrients on satiety.