INTRODUCTION
Epidemiological studies have demonstrated that the consumption of whole grain foods and their derivatives can reduce the risk of development of non-degenerative diseases, such as type II diabetes, cardiovascular diseases, cancer, and obesity [Benisi-Kohansal et al., 2016; Khan et al., 2022; Ye et al., 2012]. Unpolished rice is classified as a whole grain because its post-harvest processing involves only the removal of the rice husk, leaving the bran layer attached to the endosperm. It is recognized for its health benefits as it contains higher levels of nutrients and bioactive phytochemicals than polished rice [Munarko et al., 2020; Ukpong et al., 2024; Yan et al., 2020]. Meanwhile, the global organic rice market is projected to grow at an annual rate of 8%, driven by consumer preferences for healthier, environmentally friendly, and convenient food choices [Bergman & Pandhi, 2023; Hazra et al., 2018]. This trend underscores the strong market potential of unpolished organic rice in the future. There are various types of unpolished rice available, but the most commonly found in the market are brown rice and some pigmented rice varieties, such as red and black rice [Pengkumsri et al., 2015]. Brown rice is an important source of phytochemicals including phenolic acids, γ-oryzanol and γ-aminobutyric acid [Munarko et al., 2020; Shao et al., 2018], while red rice and black rice, in addition, are rich in anthocyanins and proanthocyanins, respectively, which ensures their greater antioxidant capacity [Jantasee et al., 2014; Shao et al., 2018]. In Indonesia, these rice varieties are commercially available and widely distributed through both physical stores and online platforms. Interestingly, some producers offer blended varieties, such as brown rice mixed with red rice, red rice with black rice, and brown rice with black rice. The physical differences between unpolished rice varieties and their blends can influence sensory attributes of the finished products, potentially affecting consumer acceptance.
Previous studies have involved the sensory profiling of cooked rice, and thus several attributes, including color, glossiness, integrity, stickiness, elasticity, and hardness, as well as various taste, flavor, and aroma attributes, were identified using the quantitative descriptive analysis (QDA) method [Choi & Lee, 2021; Juemanee et al., 2018b; Kim & Kim, 2007]. On the other hand, consumer-based sensory science has increasingly driven the development of sensory profiling techniques utilizing direct consumer input. Methods such as check-all-that-apply (CATA), rate-all-that-apply (RATA), polarized sensory positioning (PSP), and projective mapping have been introduced in recent years [Ares & Varela, 2018; Ervina et al., 2023; Jariyah et al., 2024]. These approaches require no prior training, making them straightforward and adaptable alternatives to traditional sensory characterization methods like QDA [Ares & Varela, 2018; Jariyah et al., 2024].
RATA is a rapid sensory profiling method derived from the CATA technique. In this approach, participants identify terms relevant to the sample from a predefined list and subsequently rate the intensity or applicability of each selected term [Ares et al., 2014; Jariyah et al., 2024]. In the case of cooked rice, sensory profiling using the CATA method has been conducted to investigate the rice profile at different serving temperatures [Pramudya & Seo, 2018]. Interestingly, to date, no research has been conducted on the sensory profiling of unpolished rice products by using RATA method, specifically in organic rice varieties.
Beyond sensory attributes, consumer emotions play a crucial role in product selection. The emotions experienced during interaction with the product can provide valuable insights for the food industry, helping to design attributes that evoke positive or negative feelings [Jariyah et al., 2024]. The emotional sensory mapping (ESM) method is used to assess the emotional responses of panelists or consumers and their relationship with a product’s sensory attributes [de Melo et al., 2021; Jariyah et al., 2024; Mora et al., 2018; Schouteten et al., 2016]. ESM can explore emotions, environmental conditions, and need-states linked to sensory characteristics, all of which are interconnected and perceivable during the consumption of the product.
To date, several researchers have conducted studies evaluating the nutritional value and sensory profile of rice samples from various varieties across the world [Choi & Lee, 2021; Gondal et al., 2021; Juemanee et al., 2018a; Shobana et al., 2011]. However, investigating the physicochemical and sensory attributes of unpolished cooked rice using the RATA method, combined with ESM to capture emotional responses, presents an intriguing research opportunity. Therefore, this study aimed to evaluate the physicochemical properties, sensory profiles and emotional perspectives of unpolished organic rice.
MATERIALS AND METHODS
Materials
This study employed three types of unpolished organic rice, i.e., brown rice var. Berlian, red rice var. A3, and black rice var. Pekat. The rice was purchased from Sirtanio Organics in Banyuwangi, Indonesia. The varieties were selected because they are quite popular in East Java Province, Indonesia, and are available in both offline and online stores. All samples were harvested in 2024.
Determination of the nutritional composition of unpolished rice
The nutritional composition of three samples of each unpolished organic rice variety was determined in duplicate, including moisture, ash, total lipid, protein, total carbohydrate, total energy value and energy value from lipids. Prior to analysis, each rice variety was milled and sieved trough an 80-mesh sieve.
Moisture content was analyzed by the oven method according to the Indonesian National Standard (SNI 01-2891-1992) [BSN, 1992]. Ash content was determined by the dry ashing method, following the procedure described in the SNI 3549:2009 [BSN, 2009]. Total lipid content was analyzed using the Weibull method, with a Soxhlet apparatus [BSN, 1992]. Protein content was measured using the Kjeldahl method, based on the nitrogen content obtained through titration, with a conversion factor of 5.95 [BSN, 1992]. Total carbohydrate content was calculated by difference, subtracting the values of moisture, ash, protein, and total lipid from the total sample weight. The total energy value was calculated as the sum of: (CP × 4) + (TL × 9) + (CHO × 4) [Osborne & Voogt, 1978], while the energy derived from lipids was determined as TL × 9, where CP, TL, and CHO represent g of crude protein, total lipid, and carbohydrate per 100 g of rice, respectively.
Determination of pasting properties of unpolished rice flour
Pasting properties of three samples of each type of rice were measured in duplicate by using a Rapid Visco-Analyzer (RVA TecMaster, PerkinElmer Inc., Waltham, MA, USA). Pasting profiles were determined by evaluating changes in paste viscosity during cooking, cooling, and stirring [Munarko et al., 2020]. The main parameters measured included peak viscosity (cP), trough viscosity (cP), breakdown (cP), final viscosity (cP), setback (cP), and pasting temperature (oC). Approximately 3 g of a flour sample and 25 mL of distilled water were placed into the RVA chamber and equilibrated at 50oC for 60 s. Within 4 min, the temperature was increased to 95oC and maintained for 2 min, then cooled down to 50oC within 4 min and held for 2 min. The paddle speed was set at 160 rpm during the measurement [AACC, 1999].
Measurement of texture parameters of cooked rice
The texture profile analysis (TPA) of cooked rice was conducted using a texture analyzer following the procedure of Tao et al. [2020] with a modification. A rice sample (50 g) was cooked with 150 mL of distilled water in an automatic rice cooker (Cosmos CRJ-1031 0.3L, Jakarta, Indonesia) for approximately 45–60 min and then left in the warm mode for 10 min. Subsequently, the upper layer of rice was removed, and the remaining rice was gently mixed. Once the sample had cooled to room temperature, three rice grains were placed directly under the probe on the base plate. The TPA was operated using a TX 700 texture analyzer (Lamy Rheology, Champagne au Mont d’Or, France), which was equipped with a 25 mm cylindrical probe. The analysis was conducted using a two-cycle force-versus-distance compression program. The TPA settings were as follows: down speed, 0.5 mm/s; force to start, 0.05 N; delay, 5 s; distance, 2 mm; wait position, 5 mm; and up speed, 0.5 mm/s. The parameters of TPA, namely hardness, cohesiveness, springiness, chewiness, and resilience, were calculated using the software provided with the instrument. Twelve texture measurements were tested for each rice sample.
Sensory profile characterization of cooked rice
Cooked rice preparation
Sensory profile and emotional sensory mapping analysis were conducted in six samples, including three samples of individual rice (brown rice: Br, red rice: Re, and black rice: Bl) and three samples of rice blends in a 50:50 (w/w) ratio (brown and red rice: Br-Re, brown and black rice: Br-Bl, and red and black rice: Re-Bl). Rice samples (130 g) were cooked using a rice-to-water ratio of 1:3 (w/v), following the procedure previously described in the texture measurement. After rice had been cooked, it was then transferred to a container and cooled to room temperature. Once cooled, the samples were prepared for sensory analysis.
Development of sensory attributes
The terms related to sensory, emotional, need-state, and environmental-state profiles were collected from previous research on cooked rice and other products. To identify the attributes for product testing, a total of nine panelists comprising rice researchers and general consumers from the Food Technology Department, Universitas Pembangunan Nasional Veteran Jawa Timur, who were familiar with the product, participated in focus group discussions (FGDs). The FGDs were conducted over three sessions, adopted from Jariyah et al. [2024] procedure with modification. In the first and second sessions, panelists were prompted to identify attributes present in the samples open-ended question. The third session focused on determining the sensory, emotional, need-state, and environmental-state attributes based on the responses gathered in the previous sessions.
Based on the findings from literature reviews and discussions of the panelists during the FGDs, 29 sensory attributes were identified, comprising 7 attributes related to appearance, 10 to aroma, 6 to texture, and 6 to taste/flavor. Additionally, 15 emotional attributes, 11 need-state attributes, and 10 environmentalstate attributes were established. The complete list of attributes state in the sensory testing is presented in Table 1.
Table 1
Sensory, emotional, need-state and environmental-state attributes established by panelists during focus group discussions for unpolished organic cooked rice.
Sample test
A total of 70 panelists were recruited from the Department of Food Technology database to participate in the sensory evaluation. Before testing, all participants provided informed consent and completed a pre-selection questionnaire via Google Forms. Eligibility criteria required participants to be at least 18 years old, in good health, and able to consume rice without restrictions.
Initially, panelists were asked to complete a questionnaire containing ideal attributes according to their perceptions. Subsequently, they were provided with samples (approximately 20 g for each sample) labelled with three randomly assigned codes, served sequentially. The panelists tested the samples using RATA and ESM with a list of sensory attributes previously determined in FGDs (Table 1). In the RATA test, the panelists indicated whether an attribute was absent by selecting “0” and rated the intensity of the attribute on a 5-point scale (very low to very high) [Ares et al., 2014a; Meyners et al., 2016]. For the ESM method, the panelists were first instructed to check all terms they found suitable for describing the tested products. Subsequently, they were asked to identify the terms that best represented the emotions, need-states, and environmental-states associated with their ideal product [Jariyah et al., 2024]. For hedonic testing, a 7-point scale was used, ranging from “very dislike” to “very like”. Hedonic testing was necessary to gain insight into consumer preferences for the product being tested [Ares et al., 2014b; Meyners et al., 2016]. Mineral water was used to neutralize the mouth prior to testing and at each sample change.
Data analysis
Nutritional, pasting, and texture parameters
The means and standard deviation for results of proximate composition, pasting properties and texture parameters were calculated by SPSS 22.0 statistical software (Statistical Graphics Corp., Princeton, NJ, USA). Significant differences among the samples were evaluated using analysis of variance (ANOVA) with Duncan’s multiple range tests (p<0.05).
Overall liking and acceptance
Hedonic data was expressed as means and analyzed using XLSTAT software (version 2019, Addinsoft, New York, NY, USA). A non-parametric statistical method, the Kruskal-Wallis test,
Table 1. Sensory, emotional, need-state and environmental-state attributes established by panelists during focus group discussions for unpolished organic cooked rice. was employed to determine significant differences between the samples (p<0.05). When significant effects at a confidence level of 95% were observed, multiple pairwise comparisons were conducted using Dunn’s procedure.
Rate-all-that-apply and emotional sensory mapping
The RATA data was analyzed using a non-parametric Kruskal-Wallis test followed by Dunn’s test to determine the differences between the samples with 95% confidence level. Principal component analysis (PCA) was applied to evaluate the distribution of panelists’ responses to sensory attributes. PCA transforms the original variables into a new coordinate system through linear combinations, facilitating the interpretation of complex data matrices from sensory evaluations. This analysis was utilized to assess the mean values of appearance, aroma, flavor, and texture attributes [Jariyah et al., 2024; Yang & Lee, 2020]. All of the analyses were conducted by XLSTAT software (version 2019, Addinsoft).
ESM data was analyzed using the Cochran’s Q test, correspondence analysis (CA), principal coordinate analysis (PCoA), and penalty analysis. The Cochran’s Q test was applied to assess significant differences between the samples at a 95% confidence level [Ares & Jaeger, 2015; Jariyah et al., 2024]. CA and PCoA were employed to visualize the relationships between attributes and samples, as well as between attributes and the ideal point [Ares & Jaeger, 2015; Jariyah et al., 2024]. A chi-square analysis was performed to examine the association between the samples and sensory attributes in CA analysis. Penalty analysis was used to evaluate consumer responses by quantifying the reduction in overall liking (hedonic) associated with deviations from ideal product attributes. This analysis compared consumers’ perceptions of the samples with those of the ideal product to assess their impact on liking scores [Ares et al., 2014b; Hunaefi et al., 2022; Meyners et al., 2016].
RESULTS AND DISCUSSION
Nutritional characteristics of unpolished organic rice
Table 2 presents, the proximate composition and energy values of brown, red and black organic rice, including moisture, ash, total lipid, protein, total carbohydrate, total energy value, and energy from lipid.
Table 2
Nutritional composition of unpolished organic rice.
The moisture content of cereal commodities is a critical determinant of their optimal storage period. Moisture content greater than 12 g/100 g is widely recognized as a primary factor contributing to insect infestation and microbial growth, which compromise the suitability of cereals for long-term storage [Nath et al., 2022]. In this study, the moisture content of rice ranged from 10.72 g/100 g in brown rice to 12.56 g/100 g in red rice (Table 2). The higher moisture level in red rice may reduce its suitability for long-term storage. Ash content, indicative of the mineral content in rice, was significantly (p<0.05) higher in brown rice (3.57 g/100 g) than in black rice and white rice showing ash contents of 2.88 and 2.94 g/100 g, respectively. The bran layer in unpolished rice is typically rich in minerals, contributing to higher ash content. Moreover, unpolished rice was reported to contain ash levels three to four times greater than polished rice, a characteristic observed in pigmented rice varieties [Reddy et al., 2017].
Among the unpolished rice samples, brown rice exhibited significantly (p<0.05) higher total lipid content (6.69 g/100 g) than red rice (5.48 g/100 g) (Table 2). Black rice contained 6.02 g lipid/100 g. The total lipid content in the samples in our study was higher compared to that previously reported in Thai organic rice, Southeastern Nigerian rice, and Indian rice varieties [Kraithong et al., 2018; Nath et al., 2022; Oko & Ugwu, 2011; Reddy et al., 2017; Verma & Srivastav, 2017]. In turn, protein content of the samples ranged from 9.66 to 12.06 g/100 g (Table 2), with the highest content determined in red rice, followed by brown rice and black rice. These values are notably higher than those reported for several other varieties, which typically exhibit protein levels below 9 g/100 g [Kraithong et al., 2018; Oko & Ugwu, 2011; Reddy et al., 2017]. Variations in lipid and protein contents among rice varieties are largely influenced by factors such as plant genotype, agronomic practices, and environmental conditions [Nath et al., 2022; Verma & Srivastav, 2017]. Additionally, post-harvest processes like polishing are known to significantly reduce the lipid and protein content of rice grains [Reddy et al., 2017].
Rice also serves as the primary carbohydrate source for the global population. The total carbohydrate content in the samples ranged from 67.03 to 69.73 g/100 g, with black rice showing significantly (p<0.05) higher total carbohydrate level than red rice (Table 2). Total energy values revealed slight but statistically significant differences (p<0.05) among the brown and red unpolished organic rice samples. Brown rice demonstrated total energy value of 376.3 kcal/100 g and energy derived from lipids of 60.2 kcal/100 g, and for red rice these values were 365.7 and 49.3 kcal/100 g, respectively. The concept of “food energy” refers to the energy available from food through cellular respiration [Nath et al., 2022].
Pasting properties of unpolished rice flour
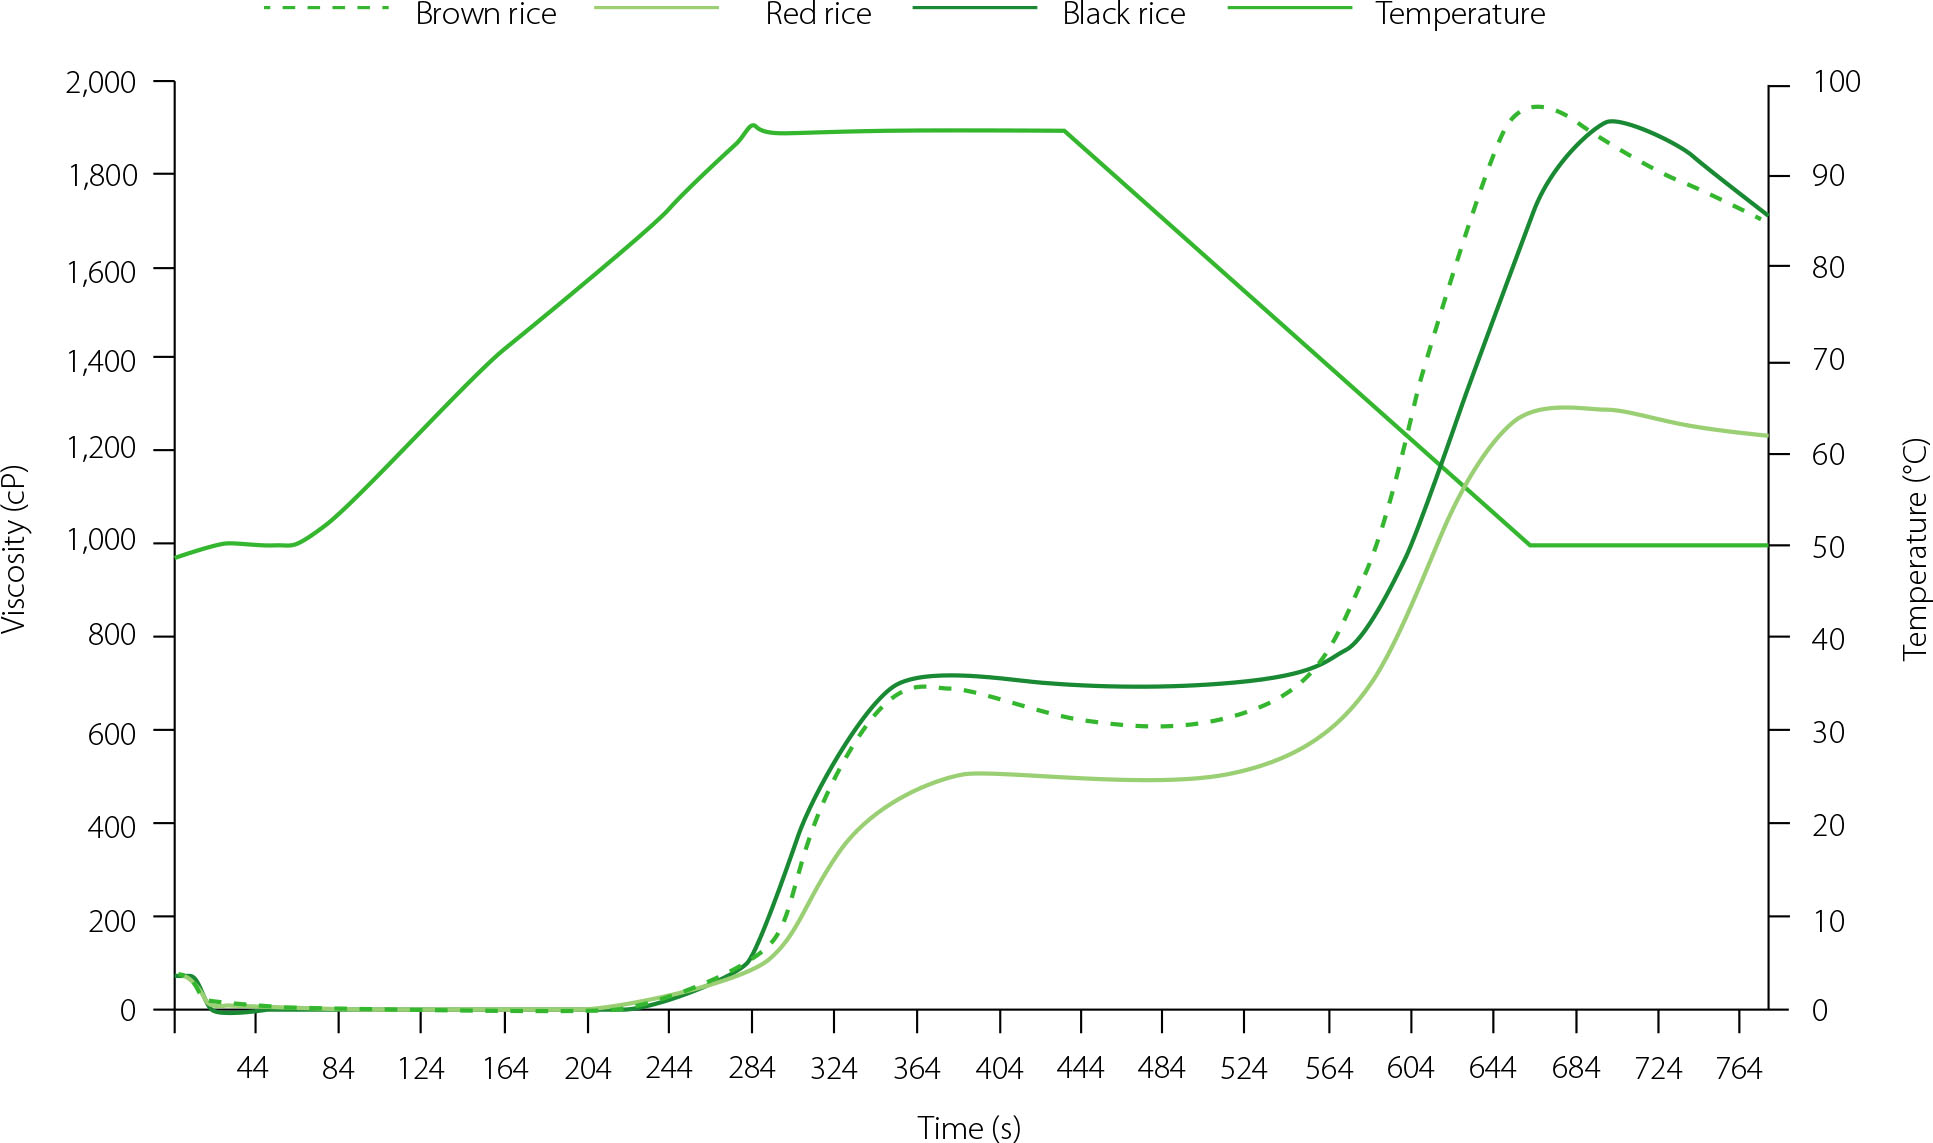
The pasting profiles of unpolished organic brown rice, red rice, and black rice are presented in Figure 1. Pasting temperature demonstrates the temperature at which starch granules undergo gelatinization, a critical process influencing the functional properties of starch-based foods. In this study, the pasting temperatures of the three samples showed no significant differences (p≥0.05), ranging from 94.8°C to 94.9°C. The gelatinized starch paste was swollen until it reached its peak viscosity. Among the samples, organic black rice and brown rice exhibited the peak viscosities of 725 cP and 702 cP, respectively. Red rice showed significantly (p<0.05) lower peak viscosity (510 cP). Peak viscosity reflects the ability of starch granules to absorb and bind water [Kraithong et al., 2018].
After complete gelatinization, starch granules break down under constant temperature, resulting in a decrease in viscosity known as trough viscosity. Organic red rice demonstrated a significantly lower trough viscosity (p<0.05) compared to brown and black rice. The difference between peak viscosity and trough viscosity, referred to as the breakdown value, indicates the stability of the starch paste during cooking [Munarko et al., 2020; Thiranusornkij et al., 2018]. The breakdown values for organic brown rice, red rice, and black rice were 85 cP, 28 cP, and 38 cP, respectively, with no statistically significant differences (p≥0.05) observed among the samples. Although brown rice and black rice exhibited higher peak viscosity, their trough viscosities were also relatively high, resulting in breakdown values that were not significantly different (p≥0.05) from those of red rice.
During the measurement of the pasting profile, the cooling process following paste heating caused an increase in viscosity, which can be attributed to the reformation of starch bonds. The final viscosity values for all three samples were not significantly different (p≥0.05), ranging from 1,240 to 1,731 cP. Similarly, the setback values, indicative of paste retrogradation, showed no significant differences (p≥0.05), with values ranging from 758 to 1,114 cP. The final viscosity parameter is commonly used as an indicator of starch gel formation during the cooling phase, while the setback value measures the extent of paste retrogradation [Munarko et al., 2020]. These parameters provide valuable insights into the functional properties of rice starch, which are critical for understanding its performance in various food applications.
Textural properties of cooked organic rice
The texture and visual appeal of cooked rice are crucial factors in determining its acceptability to consumers. The results of texture profile analysis of cooked rice are shown in Table 3. Hardness represents the force required to compress rice grains during mastication and is a critical textural property influencing the palatability of cooked rice. Among the samples, red rice exhibited the highest hardness (25.2 N), followed by brown rice (19.9 N) and black rice (9.5 N), with a significant (p<0.05) difference observed between samples. Chewiness measures the energy needed to chew rice grains until they reach a consistency suitable for swallowing. Springiness, on the other hand, refers to how much the rice grains stretch or rebound when in contact with surfaces, such as a plunger or teeth, before being pulled away. For both parameters there was no significant (p≥0.05) difference between brown, red and black rice. Resilience indicates the ability of rice grains to recover their shape after being deformed during biting. Brown rice and red rice displayed similar resilience, with no significant (p≥0.05) difference between them. However, black rice demonstrated a significantly (p<0.05) higher value of this parameter (0.20).
Table 3
Texture parameters of cooked organic rice.
The textural variation may be attributed to differences in chemical composition between rice varieties. Huang et al. [2021] compared white and brown rice varieties and showed that cooked grains with a higher protein content had greater hardness. This finding was consistent with our study results. In addition to protein, a higher amylose content contributes to greater hardness and reduced springiness, which directly affect the overall eating experience [Bhat & Riar, 2017; Huang et al., 2021]. Previous studies reported that red rice had an amylose content 1.6 times higher than that of black rice [Devi & Badwaik, 2022], with its hardness being three times greater. Additionally, Mogoginta et al. [2024] found that black rice cultivated on Java Island, Indonesia, contained lower amylose levels than red rice. Besides protein and amylose, fiber also affects texture. Wholegrain rice contains nearly twice the total dietary fiber (TDF) of white rice, as most fiber is concentrated in the bran [Carcea, 2021]. These variations in fiber content among rice varieties may further influence textural properties.
Hedonic perception of cooked organic rice
The non-parametric Kruskal-Wallis test indicated no significant (p≥0.05) differences in the overall liking between the different samples. The panelists’ preferences for unpolished rice varieties ranged from slight dislike to slight like, with mean scores of 4.63 for brown rice, 4.40 for red rice, 4.26 for black rice, 4.68 for the brown–red rice blend, 4.27 for the brown–black rice blend, and 4.47 for the red–black rice blend, as evaluated on a 7-point hedonic scale. Comparable findings were reported by Juemanee et al. [2018b], where various Thai unpolished pigmented rice samples achieved an acceptance score of 7 on a 9-point scale. Consumers tend to dislike unpolished rice due to its firm texture and the perception of hay-like and cardboard-like notes, which are regarded as undesirable characteristics [Charoenthaikij et al., 2021].
Rate-all-that-apply evaluation
Data of the intensity of sensory attributes of cooked rice are shown in Table 4. Based on the evaluation of 29 sensory attributes, nine attributes exhibited significant differences (p<0.05), comprising six appearance attributes, two aroma attributes, and one texture attribute.
Among the appearance attributes, lightness, yellowish white, purplish black, brownish red, uniformity, and roughness showed notable differences across the samples. Brown rice typically exhibited higher lightness, a yellowish white color, and lower roughness. In contrast, red and black rice demonstrated distinctive brownish red and purplish black colors, respectively, with higher roughness and lower lightness. These findings are consistent with previous studies indicating that color parameters of brown rice tend to have higher L* (lightness) and b* (yellow-blue) values [Pramai & Jiamyangyuen, 2016]. Color of red rice showed the highest a* (red-green) values, while black rice had the lowest L* values [Pramai & Jiamyangyuen, 2016]. The differences in appearance among rice samples are influenced by the accumulation of phenolic compounds in the bran layer [Kaur et al., 2018; Shao et al., 2018]. Moreover, the abundant anthocyanin content in red and black rice strongly correlates with their distinct coloration [Shao et al., 2018]. Meanwhile, the appearance characteristics of cooked rice blends consisting of two rice types reflected traits similar to the individual rice types, although with lower uniformity than the single-cooked rice samples.
The intensity of aroma attributes of floral and cooked rice and texture attribute of roughness exhibited significant (p<0.05) differences between the rice samples. Brown rice showed significantly stronger cooked aroma than black rice and red-black rice blends. Floral aroma intensity was identified as the significantly more pronounced in the red-black rice blend than the brown rice and brown-red rice blend. For the rice texture attributes, red rice, black rice, and their blends demonstrated higher roughness levels. The red-black rice blend exhibited the highest roughness, perhaps due to the panelists’ perception of its non-uniform appearance.
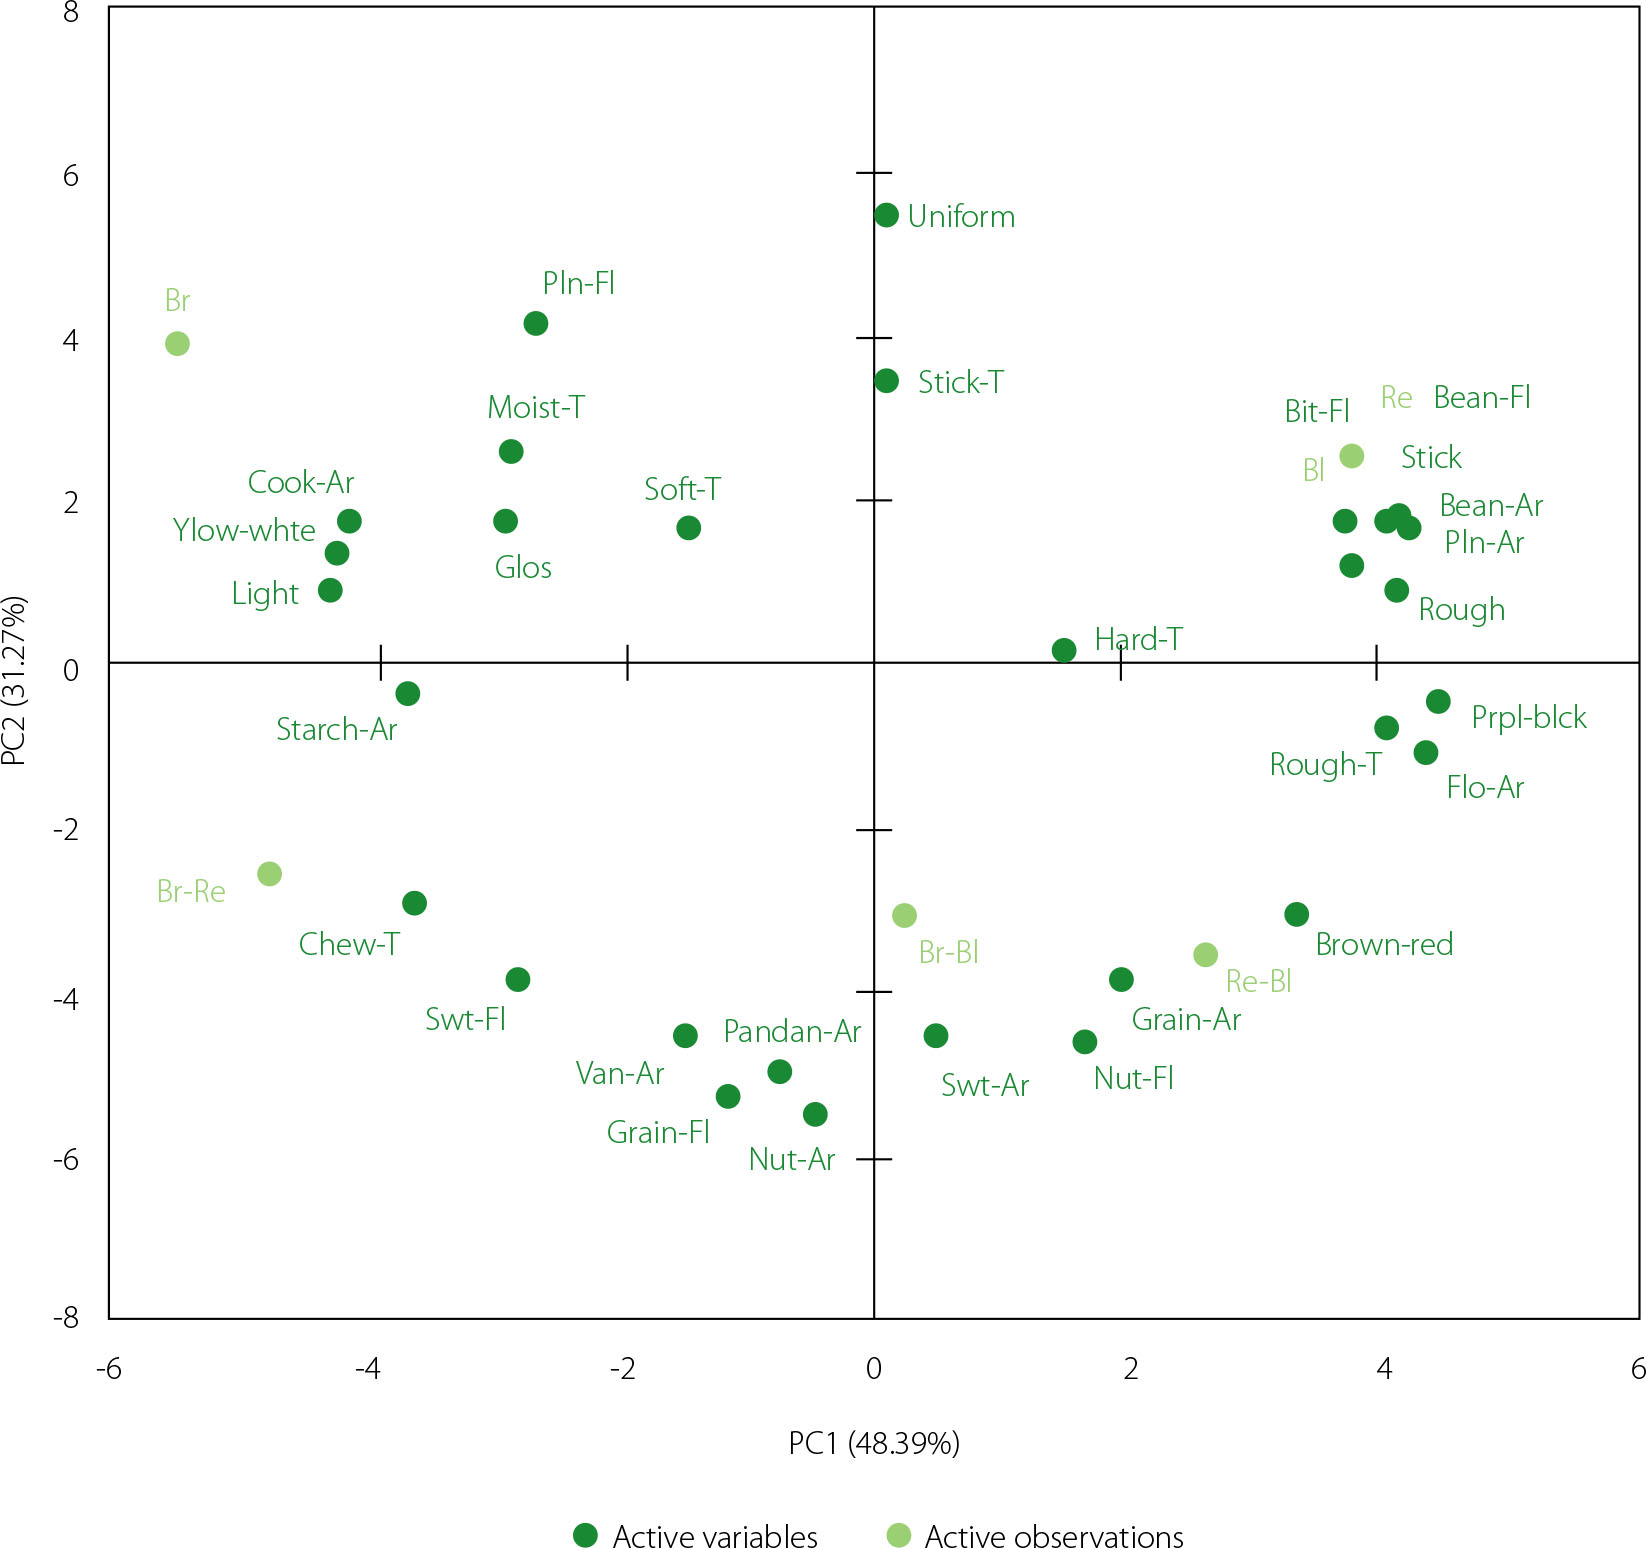
In the rate-all-that-apply method, PCA was used to see correlations between samples and their attributes. As shown in Figure 2, the cooked rice samples were grouped into clusters based on identical sensory attributes. Brown rice tended to exhibit attributes such as lightness, yellowish-white color, glossiness, cooked aroma, moisture absorption, smooth texture, and typically a plain flavor with floral notes. Meanwhile, cooked red rice and black rice showed the same sensory profile in roughness appearance and stickiness appearance, beany aroma and flavor, and had a planty aroma. Otherwise, the cooked rice from the blends indicated a different sensory profile than that in the single cooked rice. A blend of brown and red rice showed more chewy, sweet in flavor and typically starchy aroma, while the brown and black rice, and red and black rice blend had typical attributes especially in the grainy aroma and nutty flavor.
Figure 2
Principal component analysis (PCA) biplot showing the association between cooked rice samples and their sensory attributes. Br, brown rice; Re, red rice; Bl, black rice; Br-Re, brown and red rice blend; Br-Bl, brown and black rice blend; Re-Bl, red and black rice blend. Attribute abbreviations correspond to the full names shown in Table 1.
The sensory profile of cooked rice can be influenced by several factors, such as rice type and variety, physicochemical properties, and post-harvest processing technologies. Juemanee et al. [2018b] reported sensory differences between 12 samples of Thai unpolished pigmented rice (black rice, red rice, and glutinous red rice). In their study, consumers generally preferred unpolished rice types with lower hardness, texture and lower glossiness, plumpiness, and bursting appearance. Gondal et al. [2021] also emphasized that texture is the most critical sensory attribute in determining the sensory acceptance of cooked rice. Differences in the color of pigmented rice play a less significant role in consumer acceptance, although darker colors are often associated with health-promoting effects [Juemanee et al., 2018b]. These findings align with the results of the present study. Although the six rice samples exhibited distinct sensory profiles, particularly in terms of appearance, no significant differences were observed in their hedonic acceptance. This is perhaps due to all six samples having similar hardness intensity as perceived by the panelists (Table 4). Therefore, improving the texture quality of unpolished rice is crucial for enhancing its overall consumer acceptance in the future.
Table 4
Intensity of sensory attributes of organic cooked rice.
Emotional attribute profiles of unpolished organic cooked rice
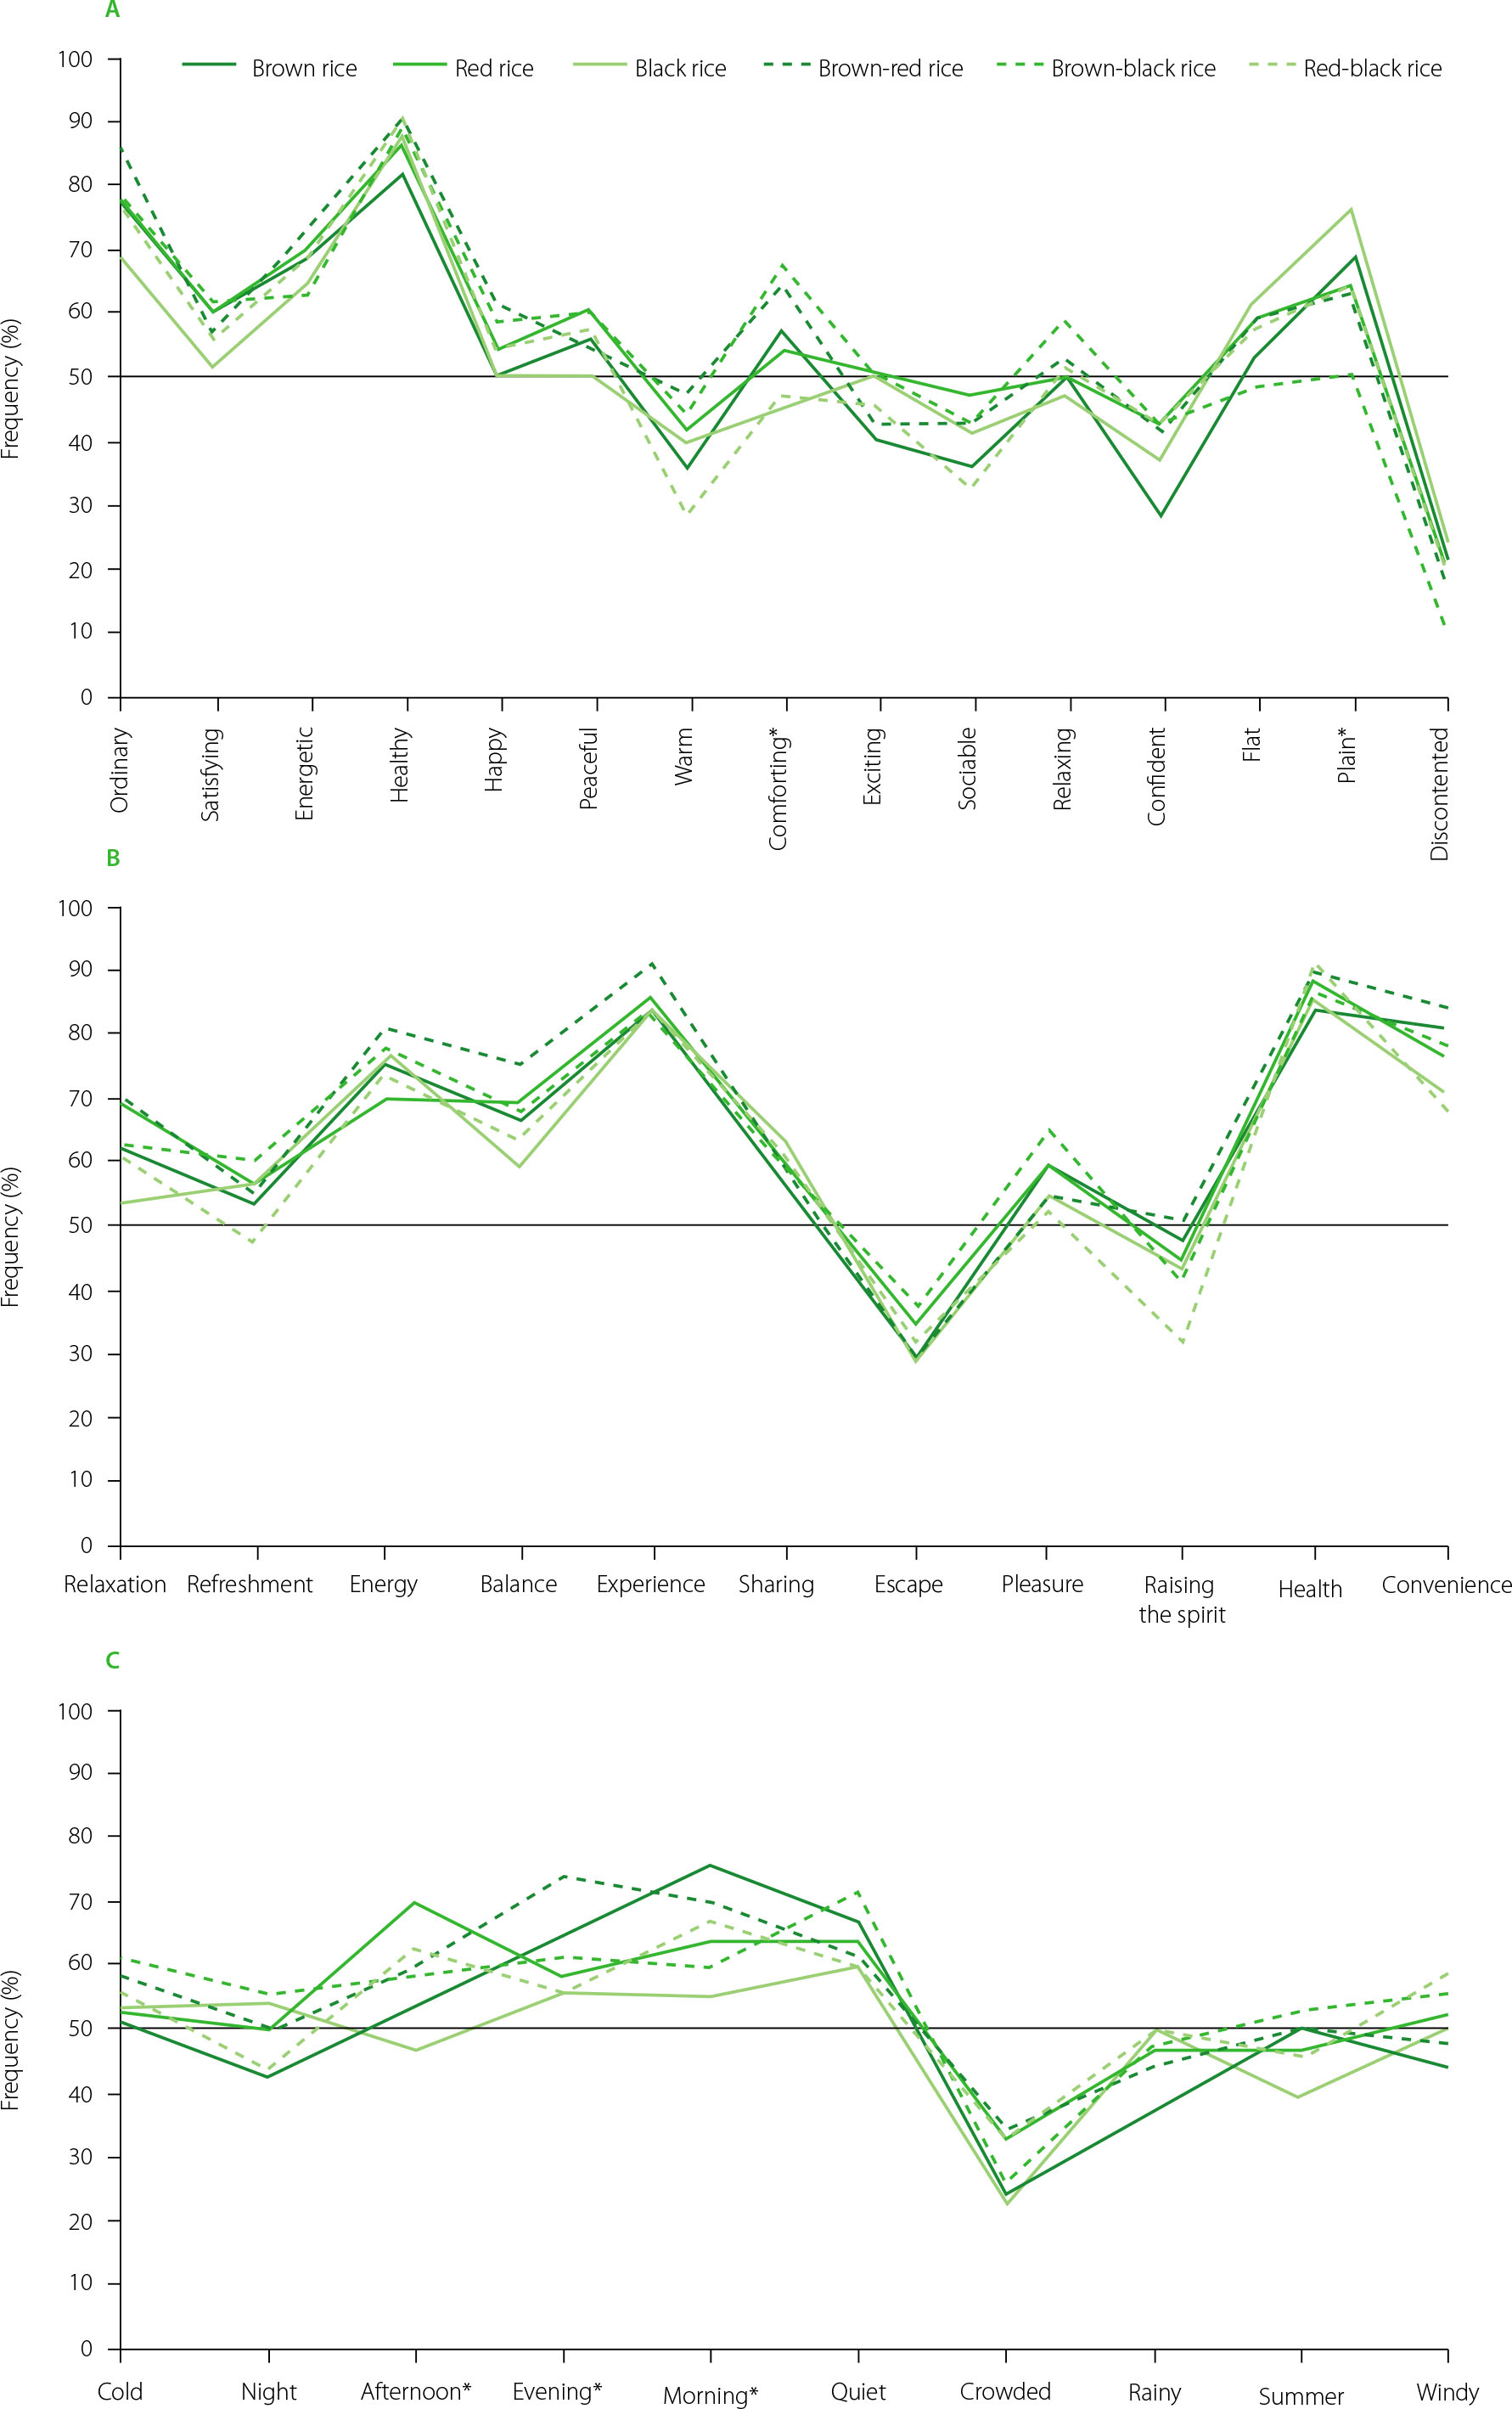
The results of the emotional sensory mapping analysis for six unpolished organic cooked rice samples included 15 emotional attributes, 11 need-state attributes, and 10 environmental-state attributes (Figure 3). Overall, both individual cooked rice samples and their blends exhibited similar patterns. The panelists predominantly selected emotional attributes such as: ordinary, satisfying, energetic, healthy, happy, peaceful, and plain; need-state attributes including relaxation, energy, balance, sharing, and health; and environmental-state attributes such as evening, morning, and quiet, each chosen by more than 50% of the panelists. The testing using Cochran’s Q test showed that the samples differed significantly (p<0.05) in two emotional attributes (comforting and plain) and three environmental-state attributes (afternoon, evening, and morning). However, no significant differences (p≥0.05) were observed in the need-state profiles across the samples.
Figure 3
Frequency (%) of panelists’ evaluations for emotion (A), need-state (B), and environmental-state (C) attributes across organic cooked rice samples. For attributes labeled with (*), significant differences between rice samples were determined at p<0.05.
Plots of correspondence analysis (CA) and principal coordinate analysis (PCoA), which were performed to explore the correlation between products, measured attributes, liking points, and the ideal product are shown in Figure 4. The results of the chi-square significance test between the products and attributes indicated that the profiles of emotion, need-state, and environmental-state showed no significant associations (p≥0.05). This suggested the absence of strong correlations between the tested products and the evaluated attributes. From the CA and PCoA graphs, it was evident that none of the products closely aligned with the ideal product or the desired liking based on the tested emotional, need-state, and environmental-state profiles.
Figure 4
Plots of correspondence analysis (CA) and principal coordinate analysis (PCoA) of cooked rice. (A) CA of emotion attributes, (B) PCoA of emotion attributes, (C) CA of need-state attributes, (D) PCoA of need-state attributes, (E) CA of environmental-state attributes, (F) PCoA of environmental-state attributes. Br, brown rice; Re, red rice; Bl, black rice; Br-Re, brown and red rice blend; Br-Bl, brown and black rice blend; Re-Bl, red and black rice blend.
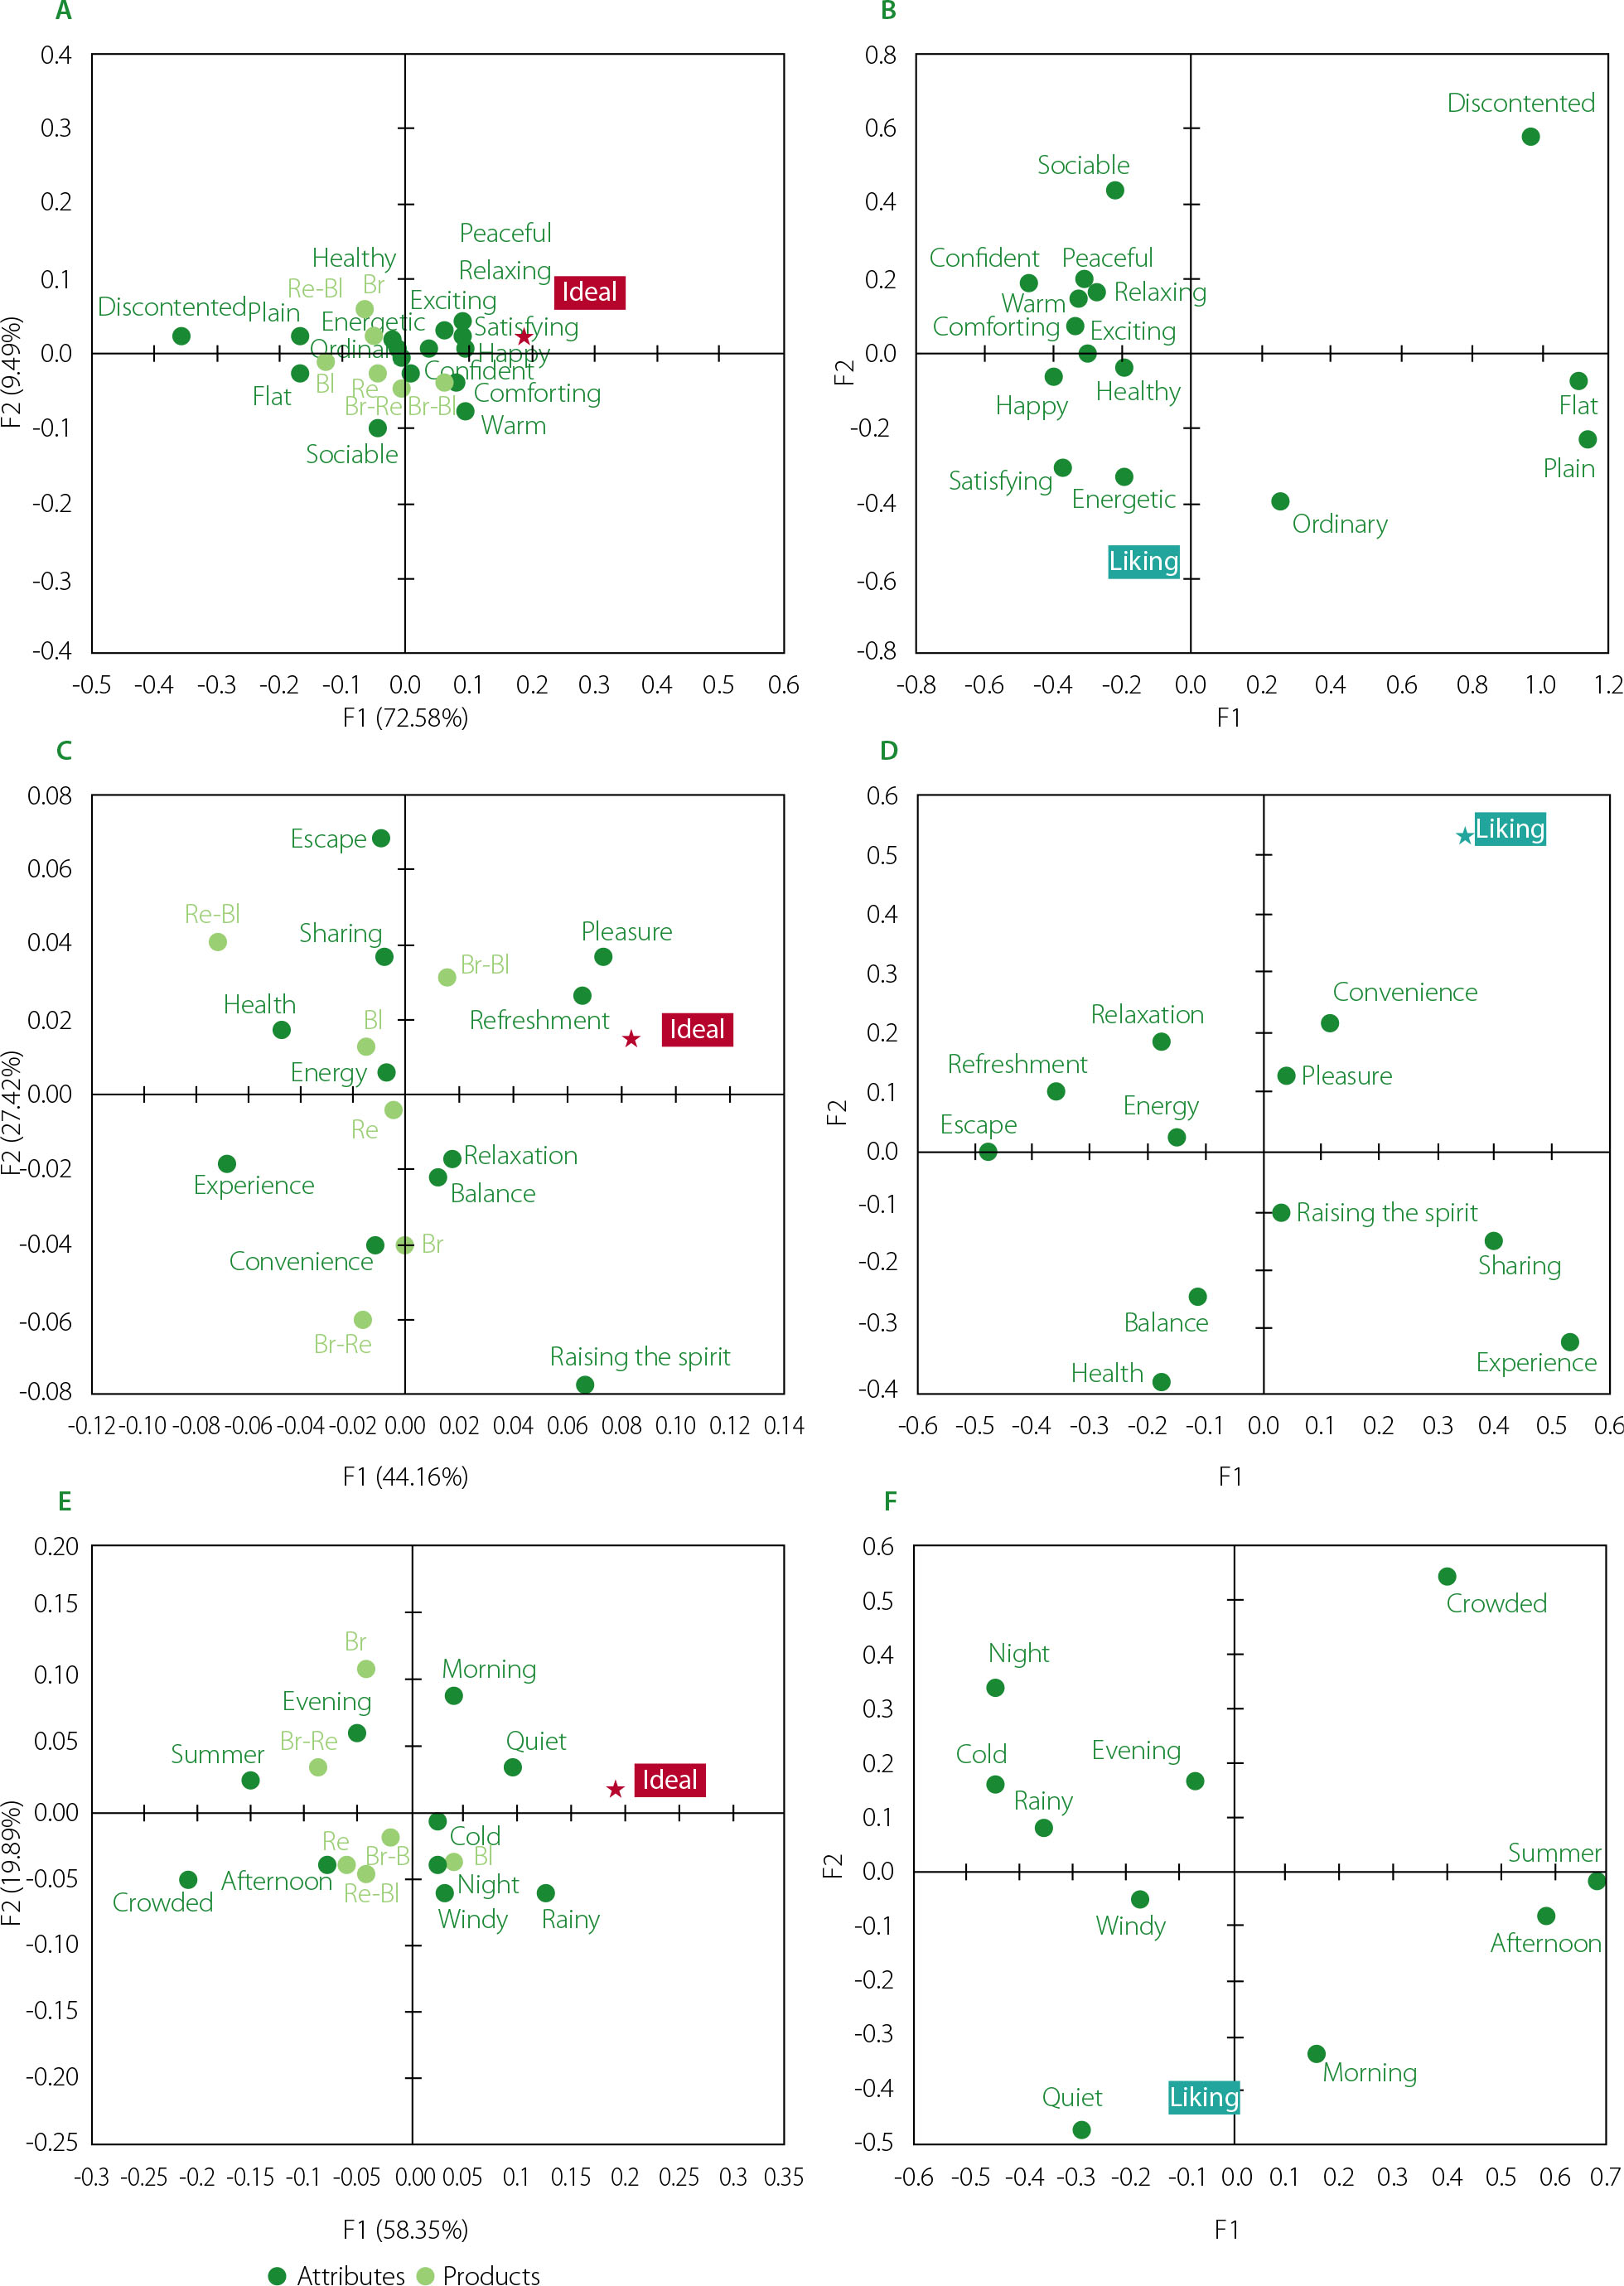
According to the CA analysis for emotional profiles (Figure 4A), an ideal product was characterized by attributes such as happy, satisfying, and relaxing However, none of the cooked rice samples exhibited an emotional profile similar to the ideal product. All products were positioned relatively close to one another, although in different quadrants. The brown-black rice blend was associated with emotional attributes such as exciting, comforting, confident and warm. Cooked rice samples of red, black, and brown-red blend were linked to flat and sociable emotions, whereas black and red-black cooked rice were associated with energetic, healthy and ordinary emotions.
The CA analysis for need-state profiles also showed no strong associations between the ideal profile and the tested products (Figure 4C). Consumers tended to prefer an ideal product that provided pleasure and refreshment over one associated with health benefits. While the six products exhibited diverse need-state attributes, none was positioned close to the ideal product. A similar trend was observed in the environmental-state profiles, where no ideal environmental profile was identified by panelists (Figure 4E). All samples were distant from the ideal product and clustered into three distinct groups.
The first two dimensions of PCoA were sufficient to interpret the relationships among attributes. The PCoA results showed no association between liking and the attributes in the emotion, need-state, and environmental-state profiles (Figure 4). This interpretation was supported by the lack of proximity between liking and the attributes within each profile.
Analyzing the emotional, need-state, and environmental-state profiles of food products provides valuable insights. Emotion is a critical factor influencing consumers’ purchasing decisions [de Melo et al., 2021; Hunaefi et al., 2023]. Need-states represent psychological needs and self-perceptions, forming the basis for marketing strategies that align products with consumers’ needs [Clark et al., 2021; Hunaefi et al., 2023]. Additionally, environmental factors serve as external influencers that shape the context of consumer behavior, eliciting specific experiential feelings [Jariyah et al., 2024].
This study on organic cooked rice products presents intriguing findings, indicating that the ideal product and liking levels for cooked unpolished rice were not strongly dependent on emotional profiles. Nevertheless, the analysis provided valuable insights into the types of emotional, need-state, and environmental-state attributes that influence product liking, which can be further explored through penalty analysis.
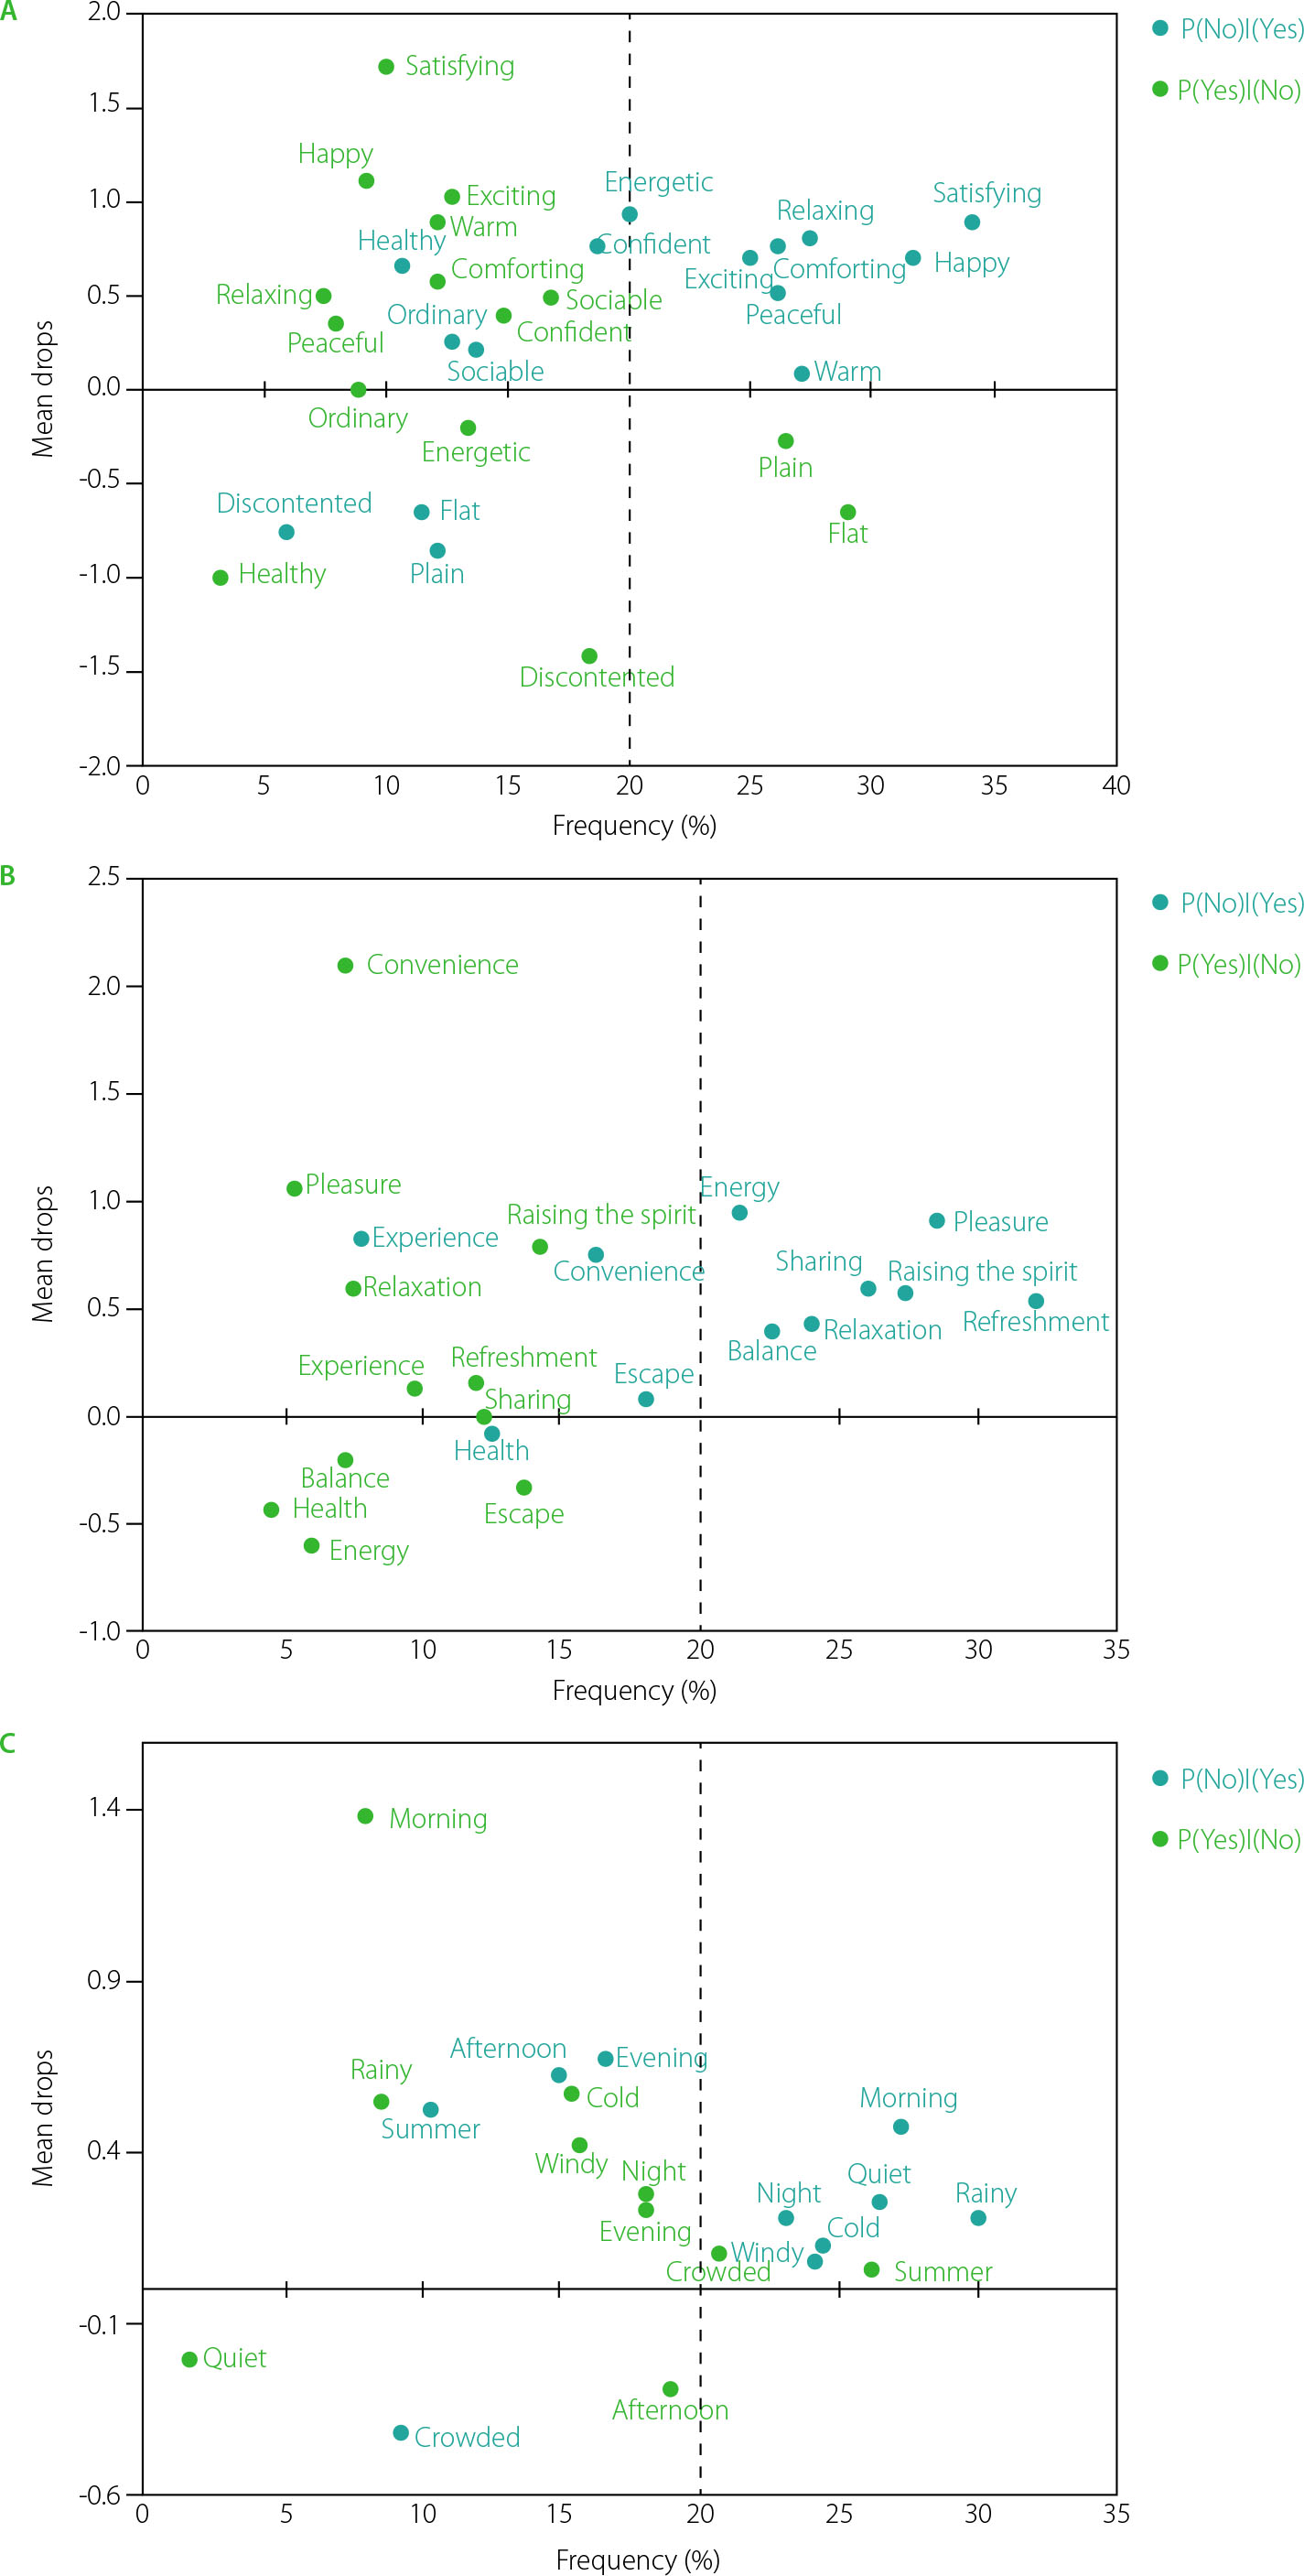
Penalty analysis identifies sensory attributes that may decrease or increase consumer preference. The classification results of penalty analysis are divided into five groups: must-have, nice-to-have, does not influence, does not harm, and must-not-have. The must-have and nice-to-have attributes based on the penalty analysis are shown in Figure 5. It is evident that the attributes represented by P(No)/(Yes), a condition in which the attributes are absent in the product but desired in the rice sample, are located in the upper-right quadrant, indicating that these must-have attributes should be present in the product but are currently missing. Penalty analysis identified “must-have” attributes that enhance liking, including emotional attributes such as satisfying, happy, peaceful, comforting, exciting and relaxing; need-state attributes such as relaxation, refreshment, energy, balance, sharing, pleasure, and raising the spirit; and the morning environmental-state attribute.
Figure 5
Mean drop in (A) emotion attributes, (B) need-state attributes, (C) environmental-state attributes as a function of the frequency of panelists’ evaluations that checked an attribute differently than for the ideal products. P(No)/(Yes) refers to a condition in which a sensory attribute is absent in the tested product but is desired in the ideal product; P(Yes)/(No) represents a condition in which a sensory attribute is present in the tested product but absent in the ideal product.
The findings of this study provide valuable insights for the development of unpolished rice products, particularly in enhancing consumer acceptance and improving some sensory attributes. Technological approaches such as germination, pre-gelatinization, and partial milling could be considered to refine the texture and taste of unpolished rice. Additionally, blending unpolished rice with polished rice at specific ratios may serve as an alternative strategy to enhance sensory properties while retaining its functional benefits. Furthermore, consuming unpolished cooked rice in combination with various condiments and side dishes may positively influence both sensory acceptance and emotional perception.
CONCLUSIONS
The variations in types of unpolished organic rice were associated with differences in proximate characteristics, pasting properties, and texture profiles. Hedonic perceptions of consuming unpolished organic cooked rice, whether as individual types (brown, red, or black rice) or as blends (brown-red, brown-black, and red-black), did not show significant differences. However, sensory profiling revealed some variations in attributes such as color, uniformity, roughness, floral and cooked aroma, and rough texture. Additionally, the findings highlighted that consumer preference for unpolished organic cooked rice was not strongly influenced by its emotional profile. These findings provide a valuable foundation for the future development of unpolished rice products. Optimizing unpolished rice processing technologies is essential to enhance sensory attributes, improve consumer acceptability, and influence both sensory perception and emotional response to unpolished rice.