INTRODUCTION
Human milk (HM) is widely recognized as the optimal source of nutrition for newborns and infants, particularly for preterm babies, facilitating a critical transition from intrauterine to extrauterine life. HM provides unique nutritional, immunological, and trophic properties vital during life’s early stages. As a result, global child health and nutrition organizations advocate exclusive breastfeeding for the first six months of life [Perrella et al., 2021; WHO, 2022]. Although initiation of breastfeeding is relatively high in many European countries, the prevalence of exclusive breastfeeding in the first six months of life remains below international recommendations. According to data from the WHO European Region, the prevalence of exclusive breastfeeding up to six months of age is lower than in most other WHO regions worldwide. In many European countries, the proportion of infants exclusively breastfed during the first six months of life ranges from approximately 13% to 39% [Theurich et al., 2019]. In Poland, although nearly all mothers initiate breastfeeding after birth, national data from the PITNUTS 2016 study indicate that only 5.9% of the infants were exclusively breastfed at six months of age [Weker et al., 2017].
The composition of HM is dynamically tailored to meet the evolving needs of the infant. This adaptive nature ensures that dietary requirements are met through precisely-designed contents of energy, macronutrients, and micronutrients, along with a diverse array of biologically-active compounds, such as enzymes, hormones, growth factors, anti-infective factors, and blood cells [Andreas et al., 2015; Demmelmair & Koletzko, 2022]. The contents of these components can vary significantly depending on maternal physiology, environmental influences, and other factors [Fields et al., 2016].
HM is pivotal in regulating hunger and satiety, driven by hormones and growth factors such as leptin and adiponectin, ghrelin, resistin, obestatin, and insulin-like growth factor [Savino et al., 2012]. These bioactive components mediate the interaction between the gastrointestinal system and hypothalamic centers responsible for energy homeostasis. Recent studies have emphasized the significance of early-life nutrition, including breastfeeding, in reducing the risk of overweight and obesity later in life [Carrello et al., 2025; Ma et al., 2020; Sun et al., 2024; Yan et al., 2014].
Polypeptide hormones in HM regulate energy balance and are thought to originate from two primary sources: local synthesis and secretion by mammary epithelial cells and transfer from maternal plasma [Savino et al., 2012]. Among these, leptin plays a key role in energy homeostasis. Synthesized primarily by adipose tissue and the intestinal mucosa, leptin interacts with hypothalamic receptors to suppress hunger and promote energy expenditure [Palou & Pico, 2009]. Leptin in HM has been implicated in appetite suppression and enhanced energy expenditure in breastfed infants. It is suggested that leptin in HM may enter the systemic circulation of newborns and infants through leptin receptors located on epithelial cells of the stomach and small intestine, potentially influencing early energy balance and metabolism [Cannon et al., 2015; Flier & Maratos-Flier, 2017]. It is worth noting that leptin concentrations in HM exhibit circadian variation, with levels declining in the afternoon and rising overnight, peaking at around 05:00 h. Notably, higher concentrations have been reported between 22:00 and 04:00 h [Suwaydi et al., 2023], which is consistent with the nocturnal rise in circulating leptin observed in humans [Saad et al., 1998].
Ghrelin, often called the “hunger hormone”, is present in HM and produced by the mammary gland, mammary epithelial cells, and the placenta. It is crucial in regulating an infant’s appetite [Fields et al., 2016]. During feeding, ghrelin levels increase, stimulating hunger and ensuring that the infant consumes the necessary nutrients and energy for optimal growth [Karatas et al., 2011]. Although diurnal fluctuations of ghrelin have been documented in saliva [Aydin et al., 2006], there is currently no evidence demonstrating circadian variation of ghrelin concentrations in HM, and studies addressing this issue are lacking.
Leptin and ghrelin concentrations are closely linked to lactation. Several longitudinal studies have shown that leptin levels are highest in colostrum and generally decrease over the first months of lactation [Ilcol et al., 2006; Schuster et al., 2011; Yu et al., 2018], while ghrelin levels tend to remain stable or increase in mature milk [de Fluiter et al., 2021; Kon et al., 2014]. Leptin concentrations are initially higher in term than in preterm colostrum, but they decline more rapidly, leading to comparable levels in both groups by six weeks postpartum [Bielicki et al., 2004]. Other investigations, however, have reported lower leptin concentrations in mature term milk, likely reflecting differences in the postpartum interval before sample collection [Vass et al., 2020].
Both hormones are thought to contribute to regulating growth and development during neonatal and infancy periods and to likely play a role in protecting infants from the development of obesity. Additionally, previous studies have suggested that leptin and ghrelin are involved in metabolic programming [Fields et al., 2016; Flier & Maratos-Flier, 2011; Savino et al., 2010], a process where prenatal and early postnatal conditions significantly influence the development and function of tissues and organs, potentially shaping long-term metabolic regulation.
Building on the understanding of the dynamic composition of HM and the pivotal roles of leptin and ghrelin in energy balance and infant development, this study aimed to investigate these hormones in the context of lactation and early growth. Specifically, it sought to examine the variability in leptin and ghrelin concentrations in HM over the first six months of lactation and to identify the maternal factors, e.g., age, body mass index (BMI), that may affect their levels. This research has the potential to deepen our understanding of the interplay between maternal factors, hormonal regulation, and infant growth, ultimately contributing to the development of strategies for optimizing early-life nutrition and long-term health outcomes.
MATERIALS AND METHODS
Participants’ recruitment
Participants were recruited at the University Hospital of Białystok, Poland, between January and September 2022. During the initial screening, 35 breastfeeding mothers were evaluated for eligibility. Nine individuals did not meet the inclusion criteria, which required participants to be at least 18 years old, in good health with no chronic illnesses, non-smokers during and after pregnancy, exclusively breastfeeding, and producing an adequate milk supply. Additionally, six more participants were unable to complete the study due to circumstances such as transitioning to formula feeding, subsequent pregnancy, or relocation. Notably, no participants withdrew from the study due to health complications, as mothers and infants remained in good health throughout the observation period. Ultimately, complete datasets and human milk samples from 20 participants were included in the final analysis.
The study adhered to rigorous ethical standards, consistent with the Declaration of Helsinki. The protocol was approved by the Bioethics Committee of the Medical University of Białystok, Poland (approval no. AKP.002.501.2021). All participants were informed about the research objectives and provided written informed consent before enrollment. Furthermore, they voluntarily contributed milk samples for analysis, ensuring that the study met its goals while upholding ethical integrity.
Anthropometric measurements
Maternal anthropometric data included pre-pregnancy weight and height, which were self-reported at enrollment and used to calculate pre-pregnancy BMI. Maternal weight at delivery was obtained from medical records, and gestational weight gain was calculated as the difference between pre-pregnancy and delivery weight.
Infant anthropometric data comprised birth weight, collected from hospital records, and subsequent monthly body weights, which were recorded during routine pediatric visits and verified at study appointments. Infant body weights were expressed in kilograms and converted to age- and sex-specific weight-for-age z-scores (WAZ) using WHO Child Growth Standards with the anthro package, version 1.0.1 (WHO, Geneva, Switzerland).
Human milk collection and nutrient concentration analysis
Milk samples were collected between 7:00 and 9:00 AM, with a minimum interval of one hour since the last breastfeeding session. Participants were provided with sterilized collection tubes. To maintain hygiene, mothers were advised to wash their hands and clean the chest area before collection. Approximately 20 mL of milk were collected as a composite sample, consisting of equal volumes of pre-feed (foremilk) and post-feed (hindmilk) milk. These fractions were pooled prior to centrifugation and hormone analysis to obtain a representative mixed milk sample for each feeding. After collection, the milk samples were stored at 4°C for a few hours, but no longer than five, before being transported to the laboratory. Then, each sample was divided into two equal portions, processed on the day of collection, frozen within 24 h, and stored at −20°C until analysis. To ensure consistency, all samples were analyzed after a standardized storage period of three to four months, and each sample was subjected to a single freeze–thaw cycle to minimize peptide degradation.
Milk samples were collected at six specific postpartum time points: 3–4 weeks, 7–8 weeks, 11–12 weeks, 15–16 weeks, 19–20 weeks, and 23–24 weeks, resulting in a total of 120 samples. At the first collection time point (3–4 weeks postpartum), additional data on maternal and infant characteristics were gathered for further analysis.
The energy, lactose, fat, and protein concentrations of HM were measured using the MIRIS human milk analyzer (HMA) (Miris, Uppsala, Sweden), following a validated protocol. The analysis utilized mid-infrared (MIR) transmission technology, with wavelengths specific to different macronutrient bonds: lactose (C–OH stretch at 9.61 µm), fat (C=O at 5.73 µm and C–H at 3.48 µm), and protein (CO–N stretch at 6.46 µm). The energy value of HM was calculated per 100 mL based on the measured concentrations of lactose, protein, and fat, which were conventionally expressed per 100 mL of human milk. Energy value was estimated using specific Atwater conversion factors for human milk: 4.0 kcal/g for lactose, 4.4 kcal/g for protein, and 9.25 kcal/g for fat. In addition to macronutrient concentrations, the MIRIS HMA also provided a measurement of dry mass. This parameter reflects the proportion of solid components in milk (fat, protein, and carbohydrates) after subtraction of the water content and was automatically generated during mid-infrared analysis.
The total protein content was determined by the MIRIS HMA based on the total nitrogen (N) content and calculated using a nitrogen-to-protein conversion factor of 6.38, as specified by the manufacturer. Because total protein includes non-protein nitrogen (NPN) compounds, which account for approximately 20–25% of the total nitrogen in HM, true protein values were estimated by applying a correction factor of 0.8, according to the MIRIS methodology, using Equation (1):
For each sample, three aliquots (~12 mL in total) were analyzed for macronutrient concentrations, and the final value was calculated as the mean of three measurements.
Analysis of leptin and ghrelin concentrations in human milk samples
For hormonal analysis, the HM samples were thawed at room temperature and centrifuged at 1,770×g and 4°C for 15 min using a 5702R centrifuge with an F-45-24-11 rotor (Eppendorf, Hamburg, Germany). The fat and cellular layers were removed, and the supernatant (skim milk) was used for hormone analysis. Leptin and ghrelin concentrations were determined using enzyme-linked immunosorbent assay (ELISA). All samples were processed under identical conditions and subjected to a single freeze–thaw cycle, and all assays were performed in duplicate.
Hormone concentrations were determined using commercial ELISA kits: human leptin ELISA DEE007 kit (Demeditec, Kiel, Germany; assay range: 0.25–100 µg/L; intra-assay variance ≤15%) and human ghrelin ELISA kit (cat. no. orb561916, Biorbyt, Cambridge, UK; assay range: 1.875–120 pg/mL; sensitivity: 1.125 pg/mL). Optical density was measured with a Synergy HTX multimode microplate reader (BioTek, Winooski, VT, USA), and data analysis was performed using Gen5 Data Analysis Software (BioTek). Concentrations of leptin and ghrelin were expressed in ng and pg per 1 mL of milk, respectively.
An attempt was also made to determine the concentrations of acylated ghrelin using a commercially available Bertin Bioreagent ELISA kit (#A05106.96, Bertin Technologies, Montignyle-Bretonneux, France; assay range: 2–250 pg/mL). However, this assay did not yield reliable results in the analyzed human milk samples.
Statistical analysis
Continuous variables were expressed as mean and standard deviation (SD) for normally distributed or as median and SD for non-normally distributed data. The normal distribution of continuous variables was tested using the Shapiro-Wilk test. The categorical data were presented as numbers and percentages. Z-scores were derived based on child weight, age (in days), and sex, using the lambda-mu-sigma (LMS) method. Changes in milk compound concentrations over time were analyzed using a Bayesian hierarchical model with random intercepts for individual subjects and an autoregressive (AR1) correlation structure to account for repeated measurements. The associations between leptin and ghrelin concentrations and maternal characteristics (e.g., body mass index, body weight, age and ΔWAZ) were evaluated using Bayesian multilevel regression models. All models were fitted in R using the brms package (v2.23.0; R Foundation for Statistical Computing, Vienna, Austria) [Bürkner, 2021], specifying a Student-t likelihood. Weakly informative priors were used for the fixed effects (Normal (0, 5)) and for the residual standard deviation (Student-t distribution with 3 degrees of freedom, mean 0, scale 10). Posterior distributions were estimated using four Markov chain Monte Carlo (MCMC) chains, each with 4,000 iterations, including 1,000 warm-up iterations. Convergence was assessed using R-hat statistics (<1.01), effective sample sizes, and visual inspection of trace plots. To facilitate interpretation, estimated marginal means and pairwise comparisons were obtained with the emmeans package (v1.11.2-8; R Foundation for Statistical Computing). Correlations between hormone concentration and milk parameters were assessed using Spearman’s rank correlation. Trend analysis for milk compound concentrations over time was performed using the Mann-Kendall test. All statistical analyses were conducted using the R environment (v. 4.4.1; R Foundation for Statistical Computing).
RESULTS AND DISCUSSION
Characteristics of the study group
Maternal age averaged 32.0 years (Table 1). The mean prepregnancy weight was 62.4 kg, and the mean pre-pregnancy BMI was 22.4 kg/m2. Sixteen women (75.0%) had normal weight, while four (25.0%) were classified as overweight. Mean gestational age at delivery was 40.0 weeks, and 9 participants (45.0%) delivered by cesarean section. Mean pregnancy weight gain was 13.9 kg. Regarding parity, 8 women (40.0%) were primiparous, 6 (30.0%) were in their second pregnancy, and 6 (30.0%) in their third pregnancy. Socio-economic status was reported as high in 1 participant (5.0%), middle in 13 (65.0%), and low in 6 (30.0%). Infant birth weight averaged 3,679 g (Table 1), and the calculated monthly weight gain ranged from 370 to 790 g per month across the observation period.
Table 1
General characteristics of the study group (n=20).
Human milk composition
The summary of the composition of HM over the first six months of lactation was presented in the Supplementary Table S1. Statistical analysis using the Mann-Kendall test revealed no significant temporal changes in the concentrations of key components, including energy value, and concentrations of total protein, true protein, fat, lactose, dry mass, leptin, and ghrelin (p-values ranging from 0.070 to 1.000). Mean leptin levels ranged from 0.30 to 0.41 ng/mL (p=0.603), while ghrelin concentrations varied between 23 and 30 pg/mL (p=1.000).
The HM leptin concentrations were in a similar range compared to other studies [de Fluiter et al., 2021; Ilcol et al., 2006; Schuster et al., 2011; Yu et al., 2018]; however, significantly higher than values reported by Bronsky et al. [2011] (0.1 ng/mL, 3 months postpartum), and on the other hand lower than in the American study [Young et al., 2017] (7.1 ng/mL – for normal weight women, 4 months postpartum). Ghrelin concentrations in HM vary across studies, likely due to methodological differences [Andreas et al., 2016; Aydin et al., 2007; Cesur et al., 2012]. In our study, the observed levels were lower than those reported by Yu et al. [2018] (147.25–381.88 pg/mL, 3 months postpartum) and Khodabakhshi et al. [2015] (133–156 pg/mL, 2 to 5 months postpartum). However, they were higher than those measured by Kon et al. [2014], who reported concentrations of 5.06 pg/mL at 2 months and 0.71 pg/mL at 3 months postpartum.
In our cohort, neither leptin nor ghrelin concentrations showed significant longitudinal changes between 1 and 6 months postpartum. This contrasts with several previous studies that described decreasing leptin concentrations over the course of lactation [Ilcol et al., 2006; Schuster et al., 2011] and increasing or changing ghrelin levels [Cesur et al., 2012; de Fluiter et al., 2021, Kon et al., 2014]. The absence of a clear trend in our data may reflect the relatively small sample size, the homogeneous characteristics of the study population, or methodological differences such as sampling strategy and analytical techniques. Collectively, our findings indicate that the stability of these hormones during early lactation is also possible and highlight the heterogeneity of results reported in the literature.
Due to the absence of statistically significant trends observed for the analyzed factors, a comparative analysis was performed between specific time points. The changes in the total protein concentration throughout the lactation period were analyzed using Bayesian generalized (non-)linear multivariate multilevel models. The total protein at 3–4 weeks was significantly higher than at all other measured time points (Figure 1A). The difference between 3–4 and 11–12 weeks was estimated at 0.203 (95% higher posterior density, HPD: 0.107–0.304), with a posterior probability of the effect being greater than zero equal to 1, indicating very strong evidence for a true positive effect. Similarly, comparisons of 3–4 weeks with 7–8, 15–16, 19–20, and 23–24 weeks showed positive differences of 0.143 (0.054–0.233), 0.154 (0.057–0.255), 0.207 (0.113–0.307), and 0.254 (0.157–0.355), respectively. Comparisons among later weeks also revealed smaller but significant differences, including 7–8 vs. 23–24 weeks (0.110, 0.018–0.205) and 15–16 vs. 23–24 weeks (0.099, 0.011–0.189).
Figure 1
Concentrations of total protein (A), true protein (B), lactose (C), and dry mass (D) in human milk at different time points during the lactation period. In each boxplot, the central line represents the median, boxes indicate the interquartile range (IQR), and whiskers denote 1.5 × IQR. Asterisks indicate statistically significant differences between time points (*p<0.05, **p<0.01, ***p<0.001).
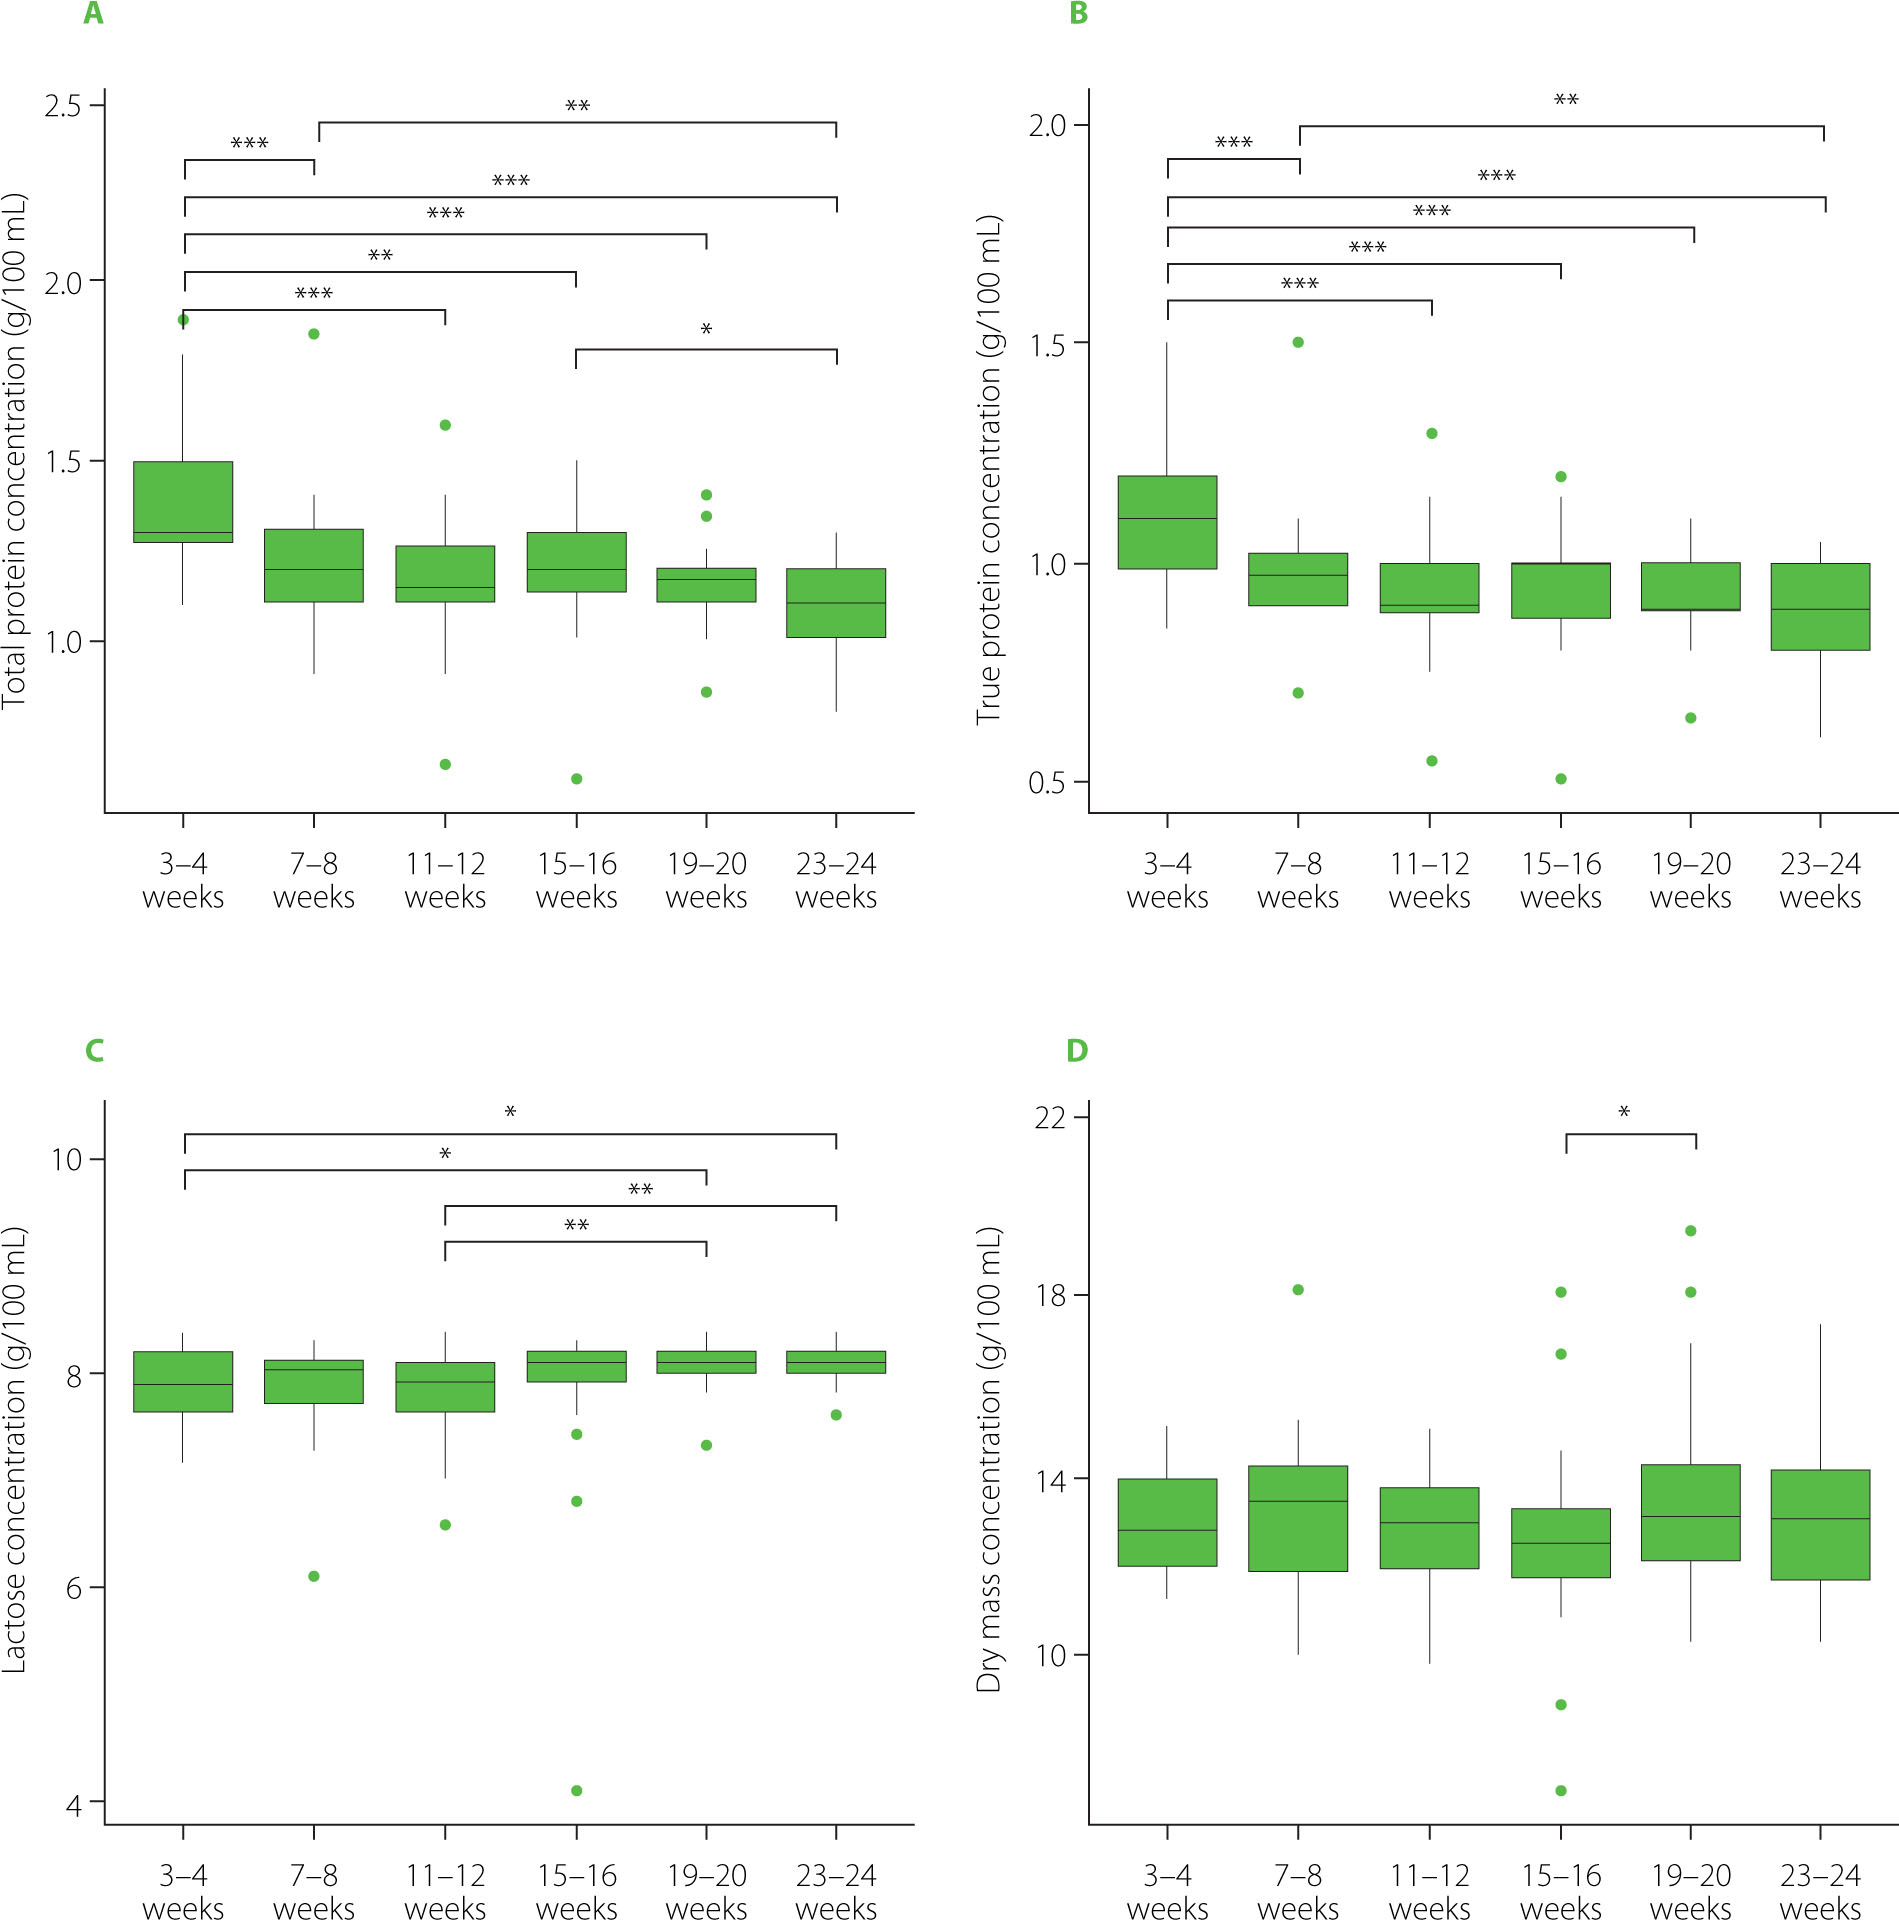
True protein concentration at 3–4 weeks was significantly higher than at all other time points (Figure 1B). The difference between 3–4 and 11–12 weeks was estimated at 0.169 (95% HPD: 0.090–0.250), with a posterior probability of the effect being greater than zero equal to 1, indicating very strong evidence for a positive effect. Comparisons of 3–4 weeks with 7–8, 15–16, 19–20, and 23–24 weeks also showed significant positive differences of 0.113 (0.043–0.186), 0.136 (0.056–0.218), 0.162 (0.084–0.239), and 0.202 (0.122–0.283), respectively. Among later weeks, 7–8 vs. 23–24 weeks revealed a weaker yet significant difference (0.088, 0.017–0.162).
Lactose concentration at 3–4 and 11–12 weeks was generally lower than at later time points (Figure 1C). Specifically, the difference between 3–4 and 19–20 weeks was estimated at −0.160 (95% HPD: −0.323 to −0.003), with a posterior probability of the effect being less than zero of 0.978, indicating strong evidence for a negative effect. Similarly, 3–4 vs. 23–24 weeks showed a difference of −0.151 (−0.301 to −0.006). Among later weeks, 11–12 vs. 19–20 weeks and 11–12 vs. 23–24 weeks also exhibited significant negative differences of −0.201 (−0.364 to −0.049) and −0.192 (−0.349 to −0.043), respectively.
A significant decrease in dry mass was observed between 15–16 and 19–20 weeks, with an estimated difference of −0.835 (95% HPD: −1.590 to −0.082), indicating strong evidence for a negative effect (Figure 1D).
Factors affecting human milk composition
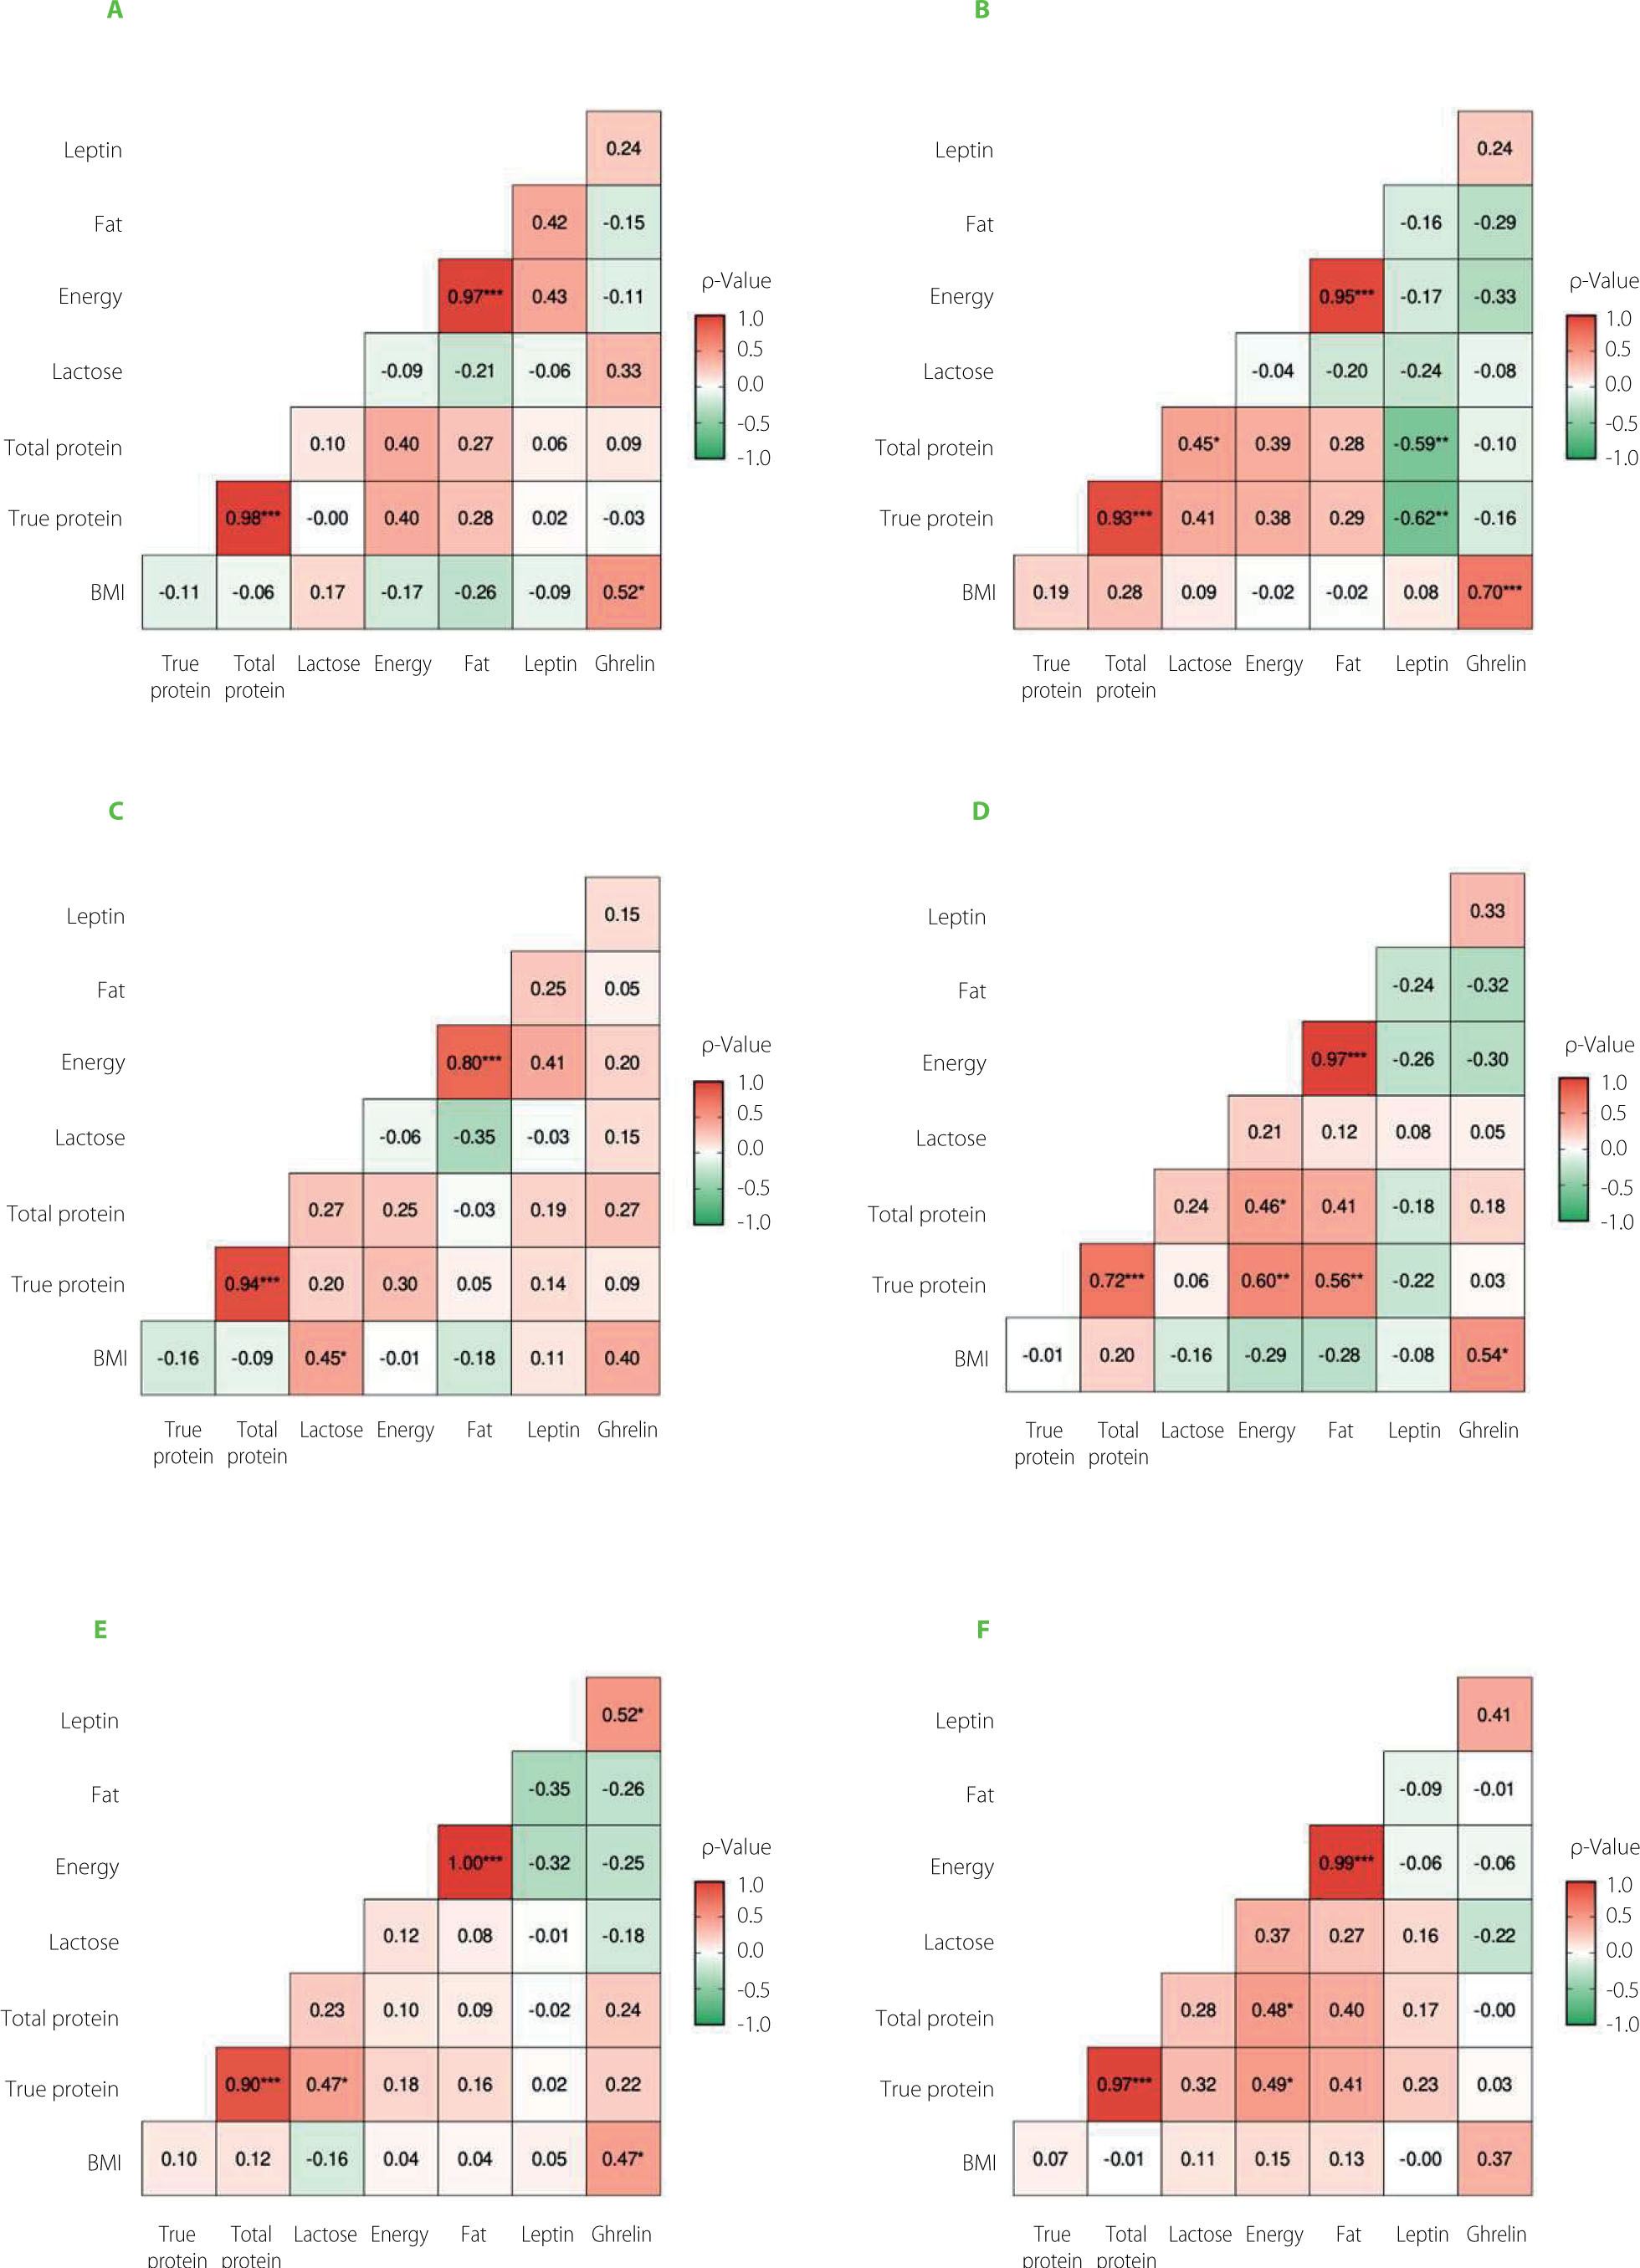
A correlation analysis evaluated the relationship between nutritional composition, maternal factors, and hormone concentrations across six time points. Overall, no consistent statistically significant correlations were observed between energy, total or true protein, or milk fat concentrations and leptin or ghrelin levels across the study period (Figure 2). However, at the second measurement time point, a statistically significant moderate negative correlation was identified between total and true protein concentrations and leptin levels. This inverse relationship may reflect distinct regulatory pathways influencing hormonal and macronutrient secretion in the mammary gland. Although limited, previous research has suggested that leptin and milk macronutrient content may be modulated by separate maternal metabolic signals [Lönnerdal, 2017; Qureshi et al., 2024]. It is also possible that this association represents a transient physiological adaptation during early lactation. To the best of our knowledge, such a negative correlation has not been reported in the literature, which highlights the need for further studies to elucidate its biological relevance and reproducibility in more diverse populations. It is noteworthy that these associations were observed only during the second postpartum month, with no consistent patterns at other time points, possibly reflecting transient regulatory mechanisms in lactation.
The association between BMI and ghrelin was evaluated using a Bayesian multilevel regression model, adjusting for relevant covariates and repeated measures. The results indicated a statistically significant positive correlation between BMI and ghrelin levels, with higher standardized BMI values associated with higher ghrelin concentrations (posterior mean = 5.63, 95% credible interval from 1.86 to 9.32). None of the other maternal factors (e.g., age, total weight gain during pregnancy) was correlated with HM leptin and/or ghrelin concentrations.
Figure 2
The correlation matrix between human milk nutritional composition, hormone (leptin, ghrelin) concentrations, and maternal pre-pregnancy body mass index (BMI) at six-time points: first month (A), second month (B), third month (C), fourth month (D), fifth month (E) and sixth month (F) of the lactation. ρ, Spearman rank correlation coefficient. Asterisks indicate statistically significant correlations (*p<0.05, **p<0.01, ***p<0.001).
Guler et al. [2022] reported that obese mothers (n=20) had significantly higher ghrelin levels in foremilk compared to those with normal weight (n=20; p=0.025) at 2 months postpartum, which aligns with our findings. Conversely, Yu et al. [2018] examined ghrelin concentrations in colostrum and mature milk collected on postpartum days 42 and 90 and reported an inverse association between maternal BMI – both pre-pregnancy (p=0.031) and during lactation (p<0.001) – and ghrelin levels. Meanwhile, Khodabakhshi et al. [2018] examined the correlation between maternal body composition and hormone levels in 80 participants but found no significant association between maternal fat mass or BMI and ghrelin concentrations in HM. Notably, their study assessed hormone levels at 6 months postpartum. Collectively, these findings suggest a complex relationship between maternal anthropometric parameters and ghrelin concentrations in HM, which may be influenced by the timing of milk collection and lactation stage.
We identified only one study [Chan et al., 2018] in which maternal age was analyzed as a potential factor that impacts HM leptin concentration. The authors reported that HM leptin level was lower in older women (aged 35–44 years) than those <35 years (p=0.03). Numerous studies have explored the relationship between maternal weight and BMI as potential factors influencing leptin concentrations in HM [Chan et al., 2018; Christensen et al., 2022; Cortés-Macías et al., 2023; Khodabakhshi et al., 2018; Larsson et al., 2018; Lemas et al., 2016; Sadr Dadres et al., 2019]. Lemas et al. [2016] reported that at two weeks postpartum in obese mothers (n=12), HM leptin concentration was twice as high as that of normal-weight mothers (n=18). Similarly, Young et al. [2017] observed consistently elevated leptin concentrations in HM among 22 overweight or obese mothers compared to 26 mothers of normal weight at both two weeks and four months postpartum. A literature review by Qureshi et al. [2024] indicated that 20 out of 21 studies found a positive correlation between maternal BMI and leptin levels in HM. Interestingly, in the remaining study, the authors reported a negative correlation in normal-weight mothers (p=0.03) [Chan et al., 2018].
Leptin and ghrelin concentrations and infants’ growth
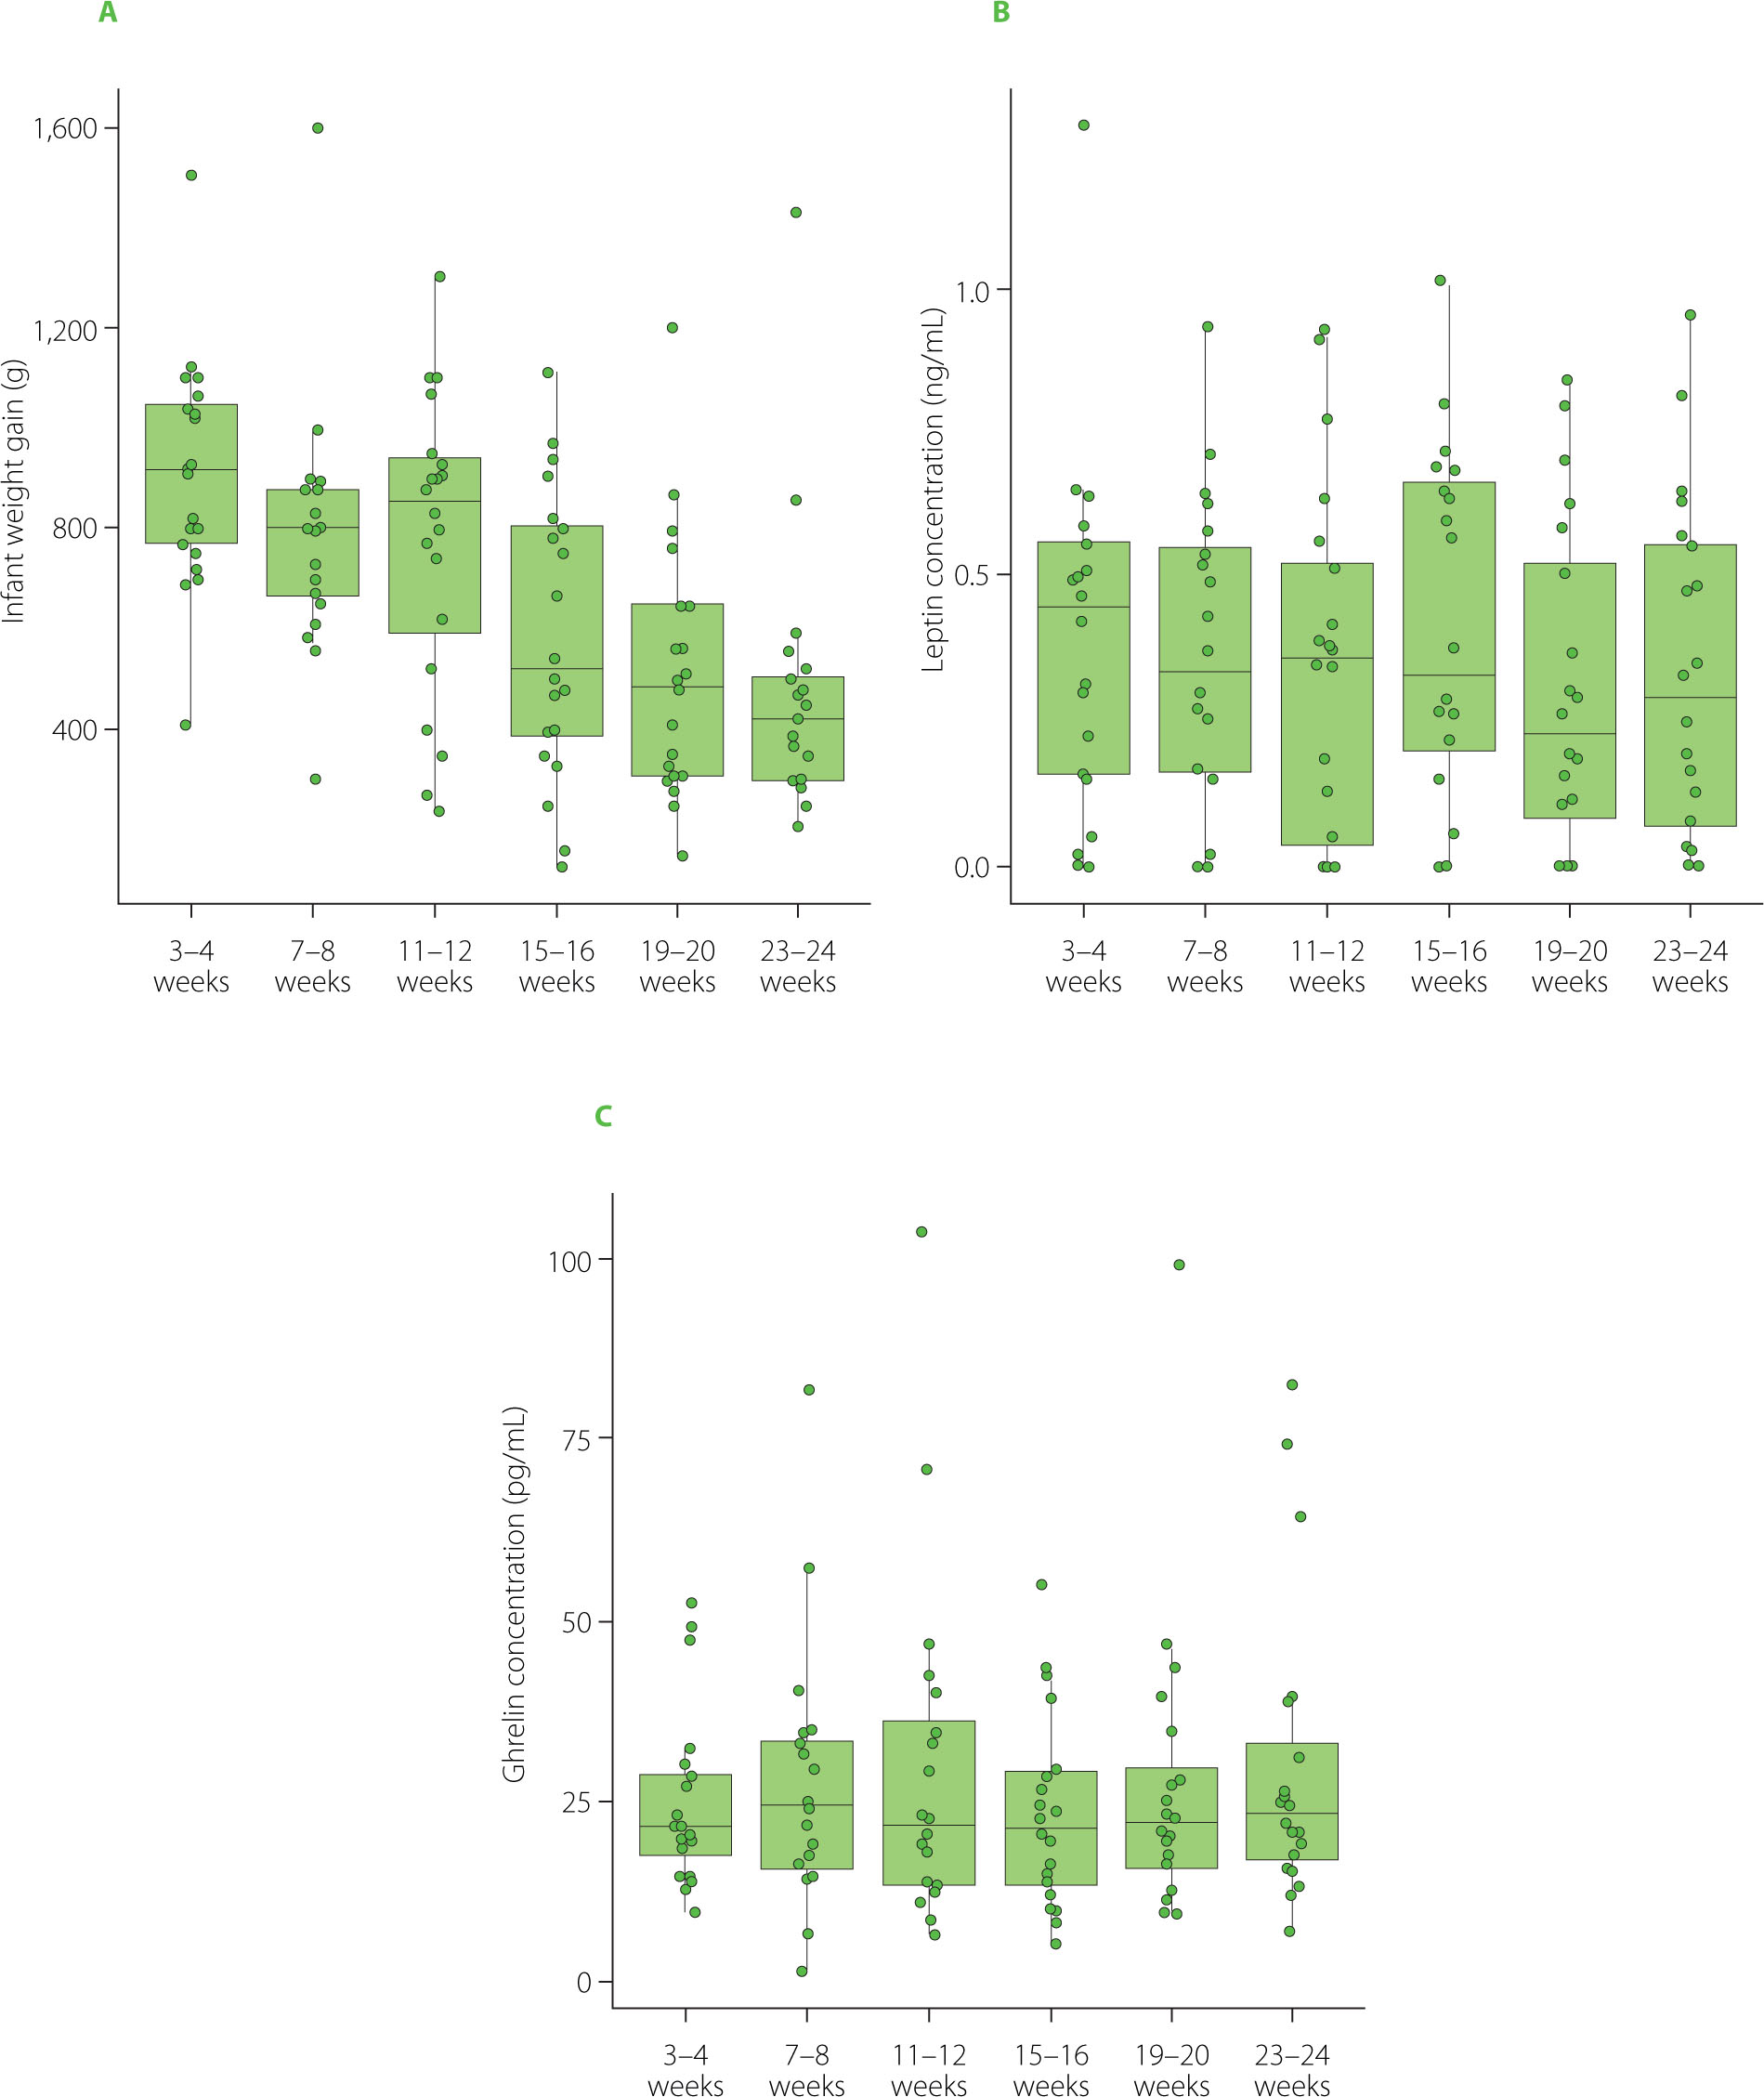
Figure 3 illustrates the infant weight gain within the first six months of life and HM leptin and ghrelin concentrations, showing no apparent trends or consistent associations. Within the first six months of life, no evidence was found for an association between HM concentrations of leptin or ghrelin and short-term changes in infant growth. In Bayesian mixed-effects models adjusting for age interval and infant sex and accounting for repeated measurements within infants, the overall association between HM leptin concentration and changes in infant weight-for-age z-scores (ΔWAZ) was weak and not statistically significant (posterior mean = −0.39, 95% credible interval from −1.33 to 0.50). In additional sensitivity analyses, we allowed the association between leptin concentration and ΔWAZ to differ across specific age intervals. These analyses produced similar findings, as the age-specific posterior estimates remained imprecise and their credible intervals consistently included zero. Similarly, HM ghrelin concentration was not associated with ΔWAZ in Bayesian mixed-effects models adjusted for age interval and infant sex (posterior mean = −0.04, 95% credible interval from −0.43 to 0.36). Models permitting age-specific effects did not reveal consistent associations at any measurement interval.
Figure 3
Infants’ weight gain during the first six months of life (A), and leptin (B) and ghrelin (C) concentrations in milk collected from lactating mothers. In each boxplot, the central line represents the median, boxes indicate the interquartile range (IQR), and whiskers denote 1.5 × IQR.
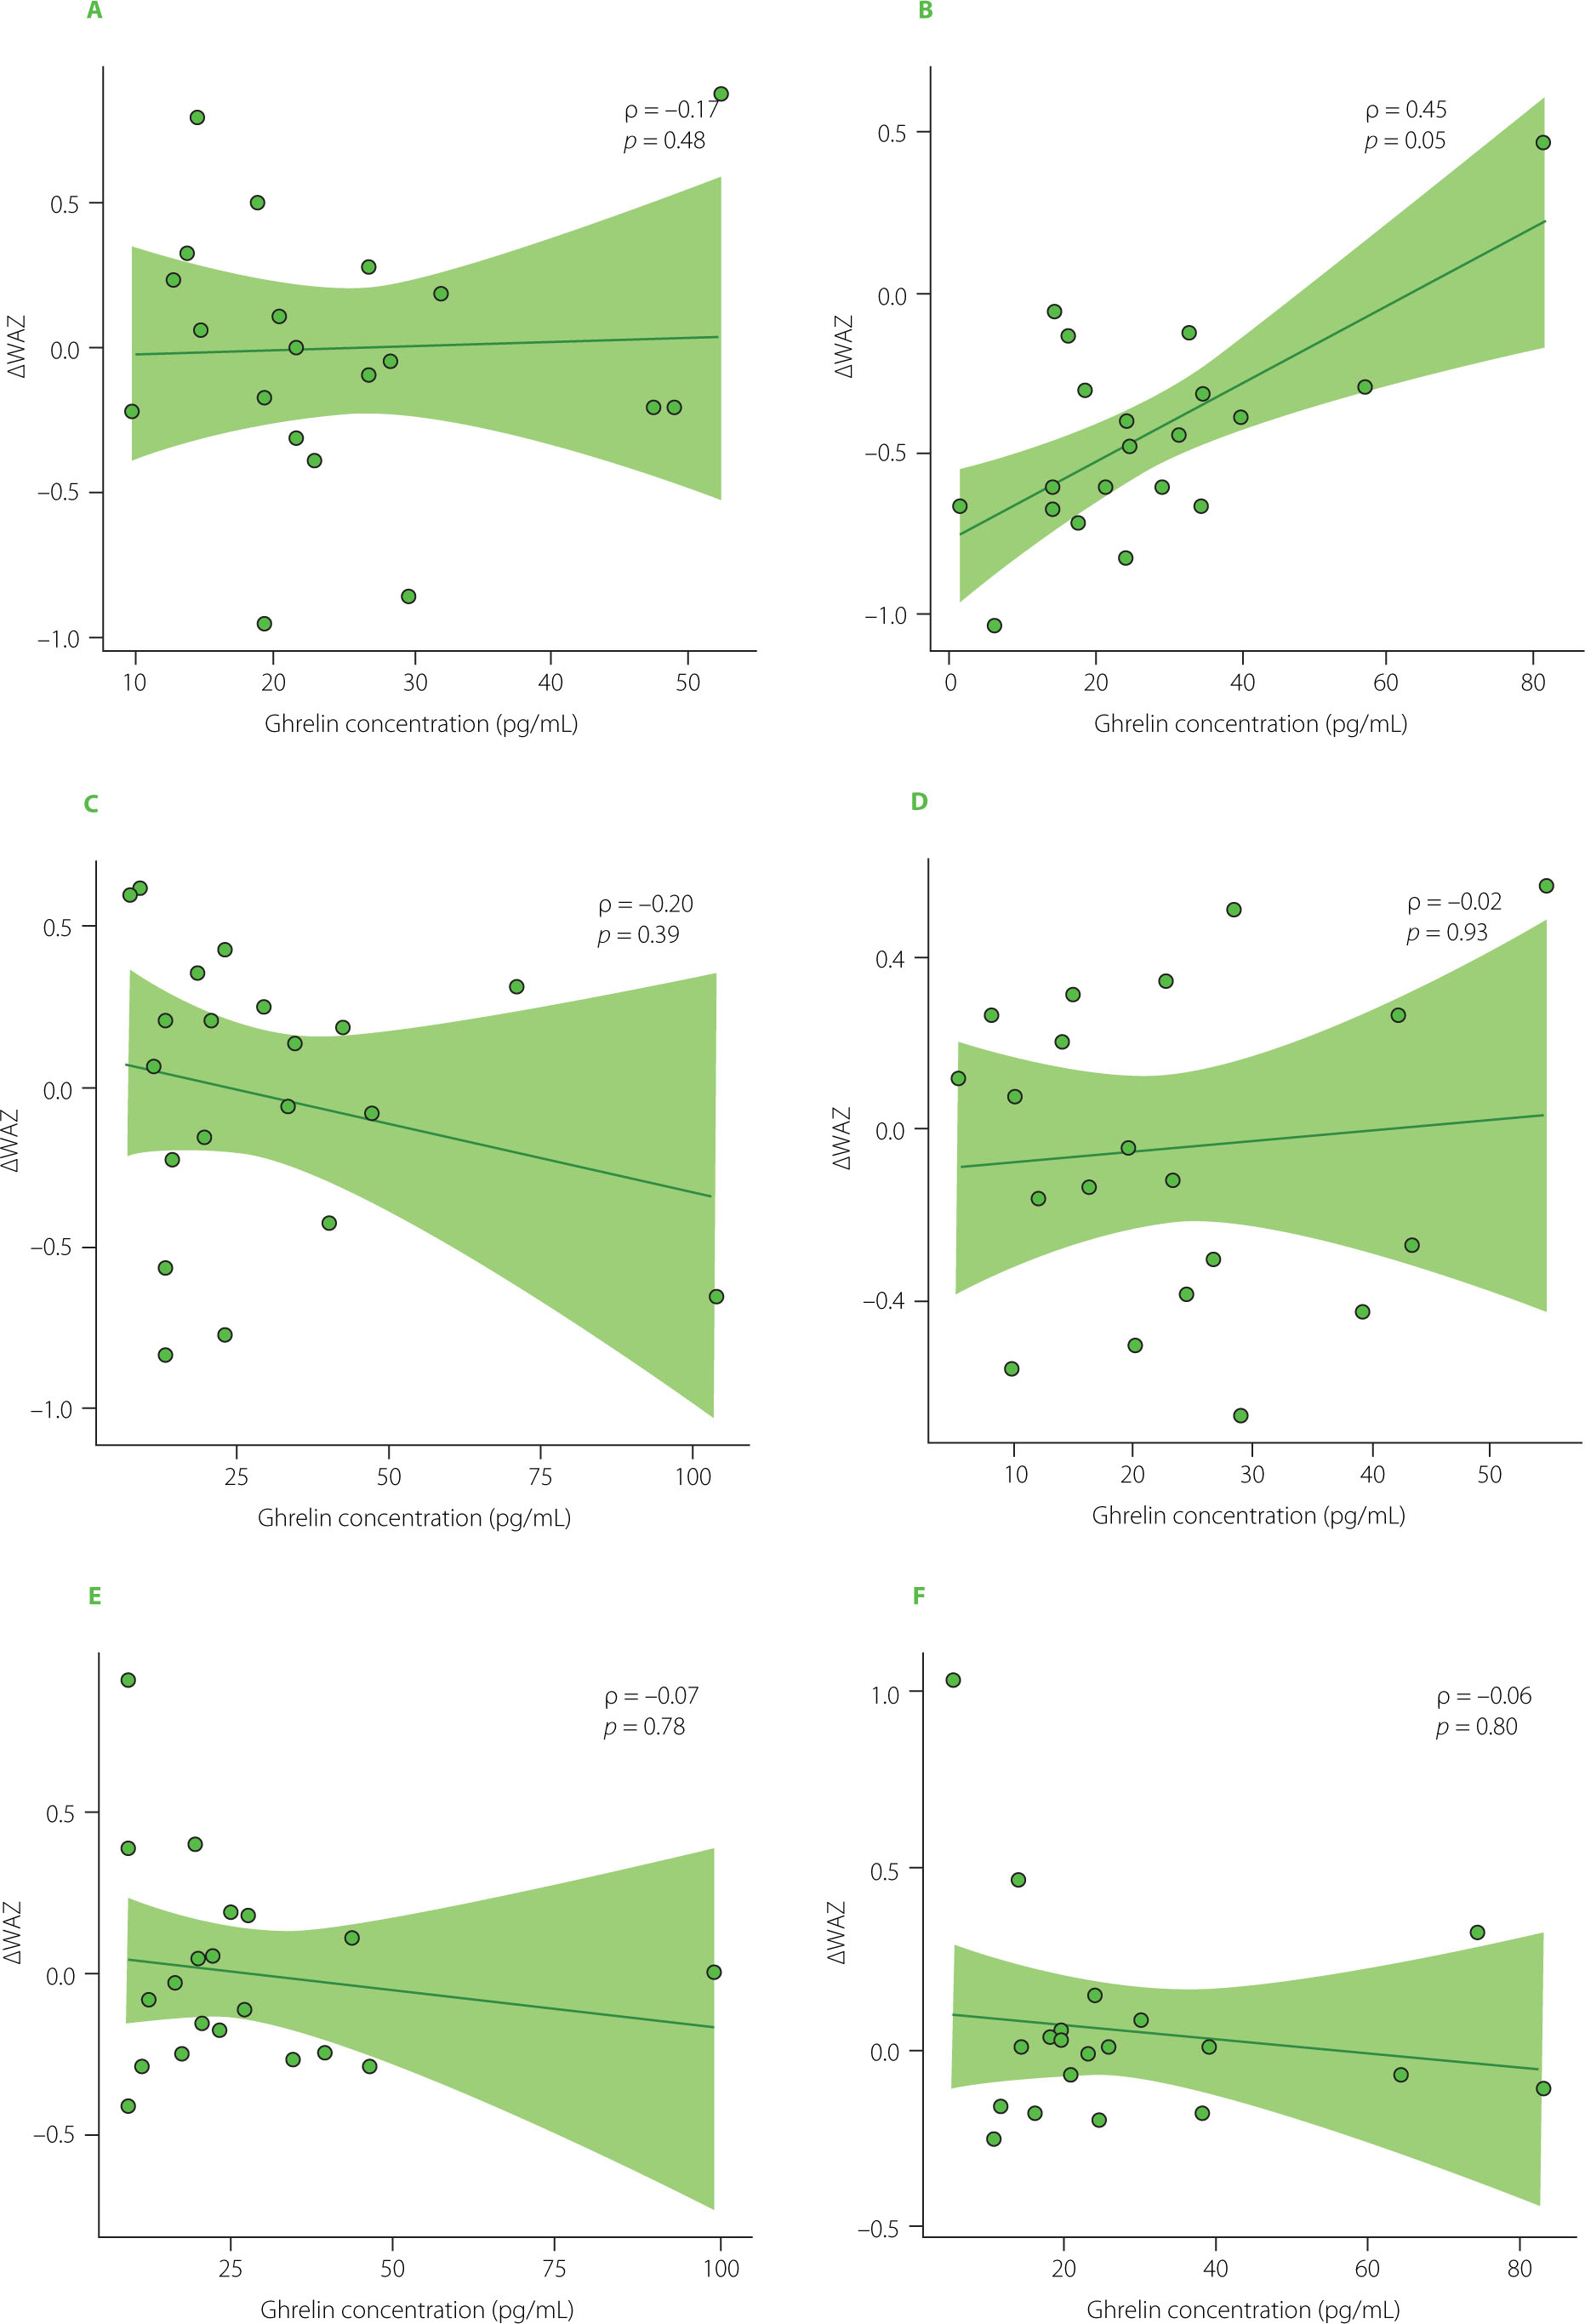
Spearman rank correlation analyses supported these findings. No statistically significant correlations were observed between infants’ ΔWAZ and HM leptin. Interval-specific Spearman correlations between hormone concentrations and ΔWAZ were weak and non-significant across most time points (Figure 4 and Figure 5). Although a moderate positive correlation between HM ghrelin concentration and ΔWAZ was observed at 7–8 weeks of age (ρ=0.45, p=0.049), this isolated result was not supported by the mixed-effects models.
Figure 4
Spearman rank correlations between leptin concentration and changes in weight-for-age z-scores (ΔWAZ) at six time points during lactation: first month (A), second month (B), third month (C), fourth month (D), fifth month (E), and sixth month (F). The Spearman rank correlation coefficient (ρ) and the corresponding p-value are shown in the corner of each graph.
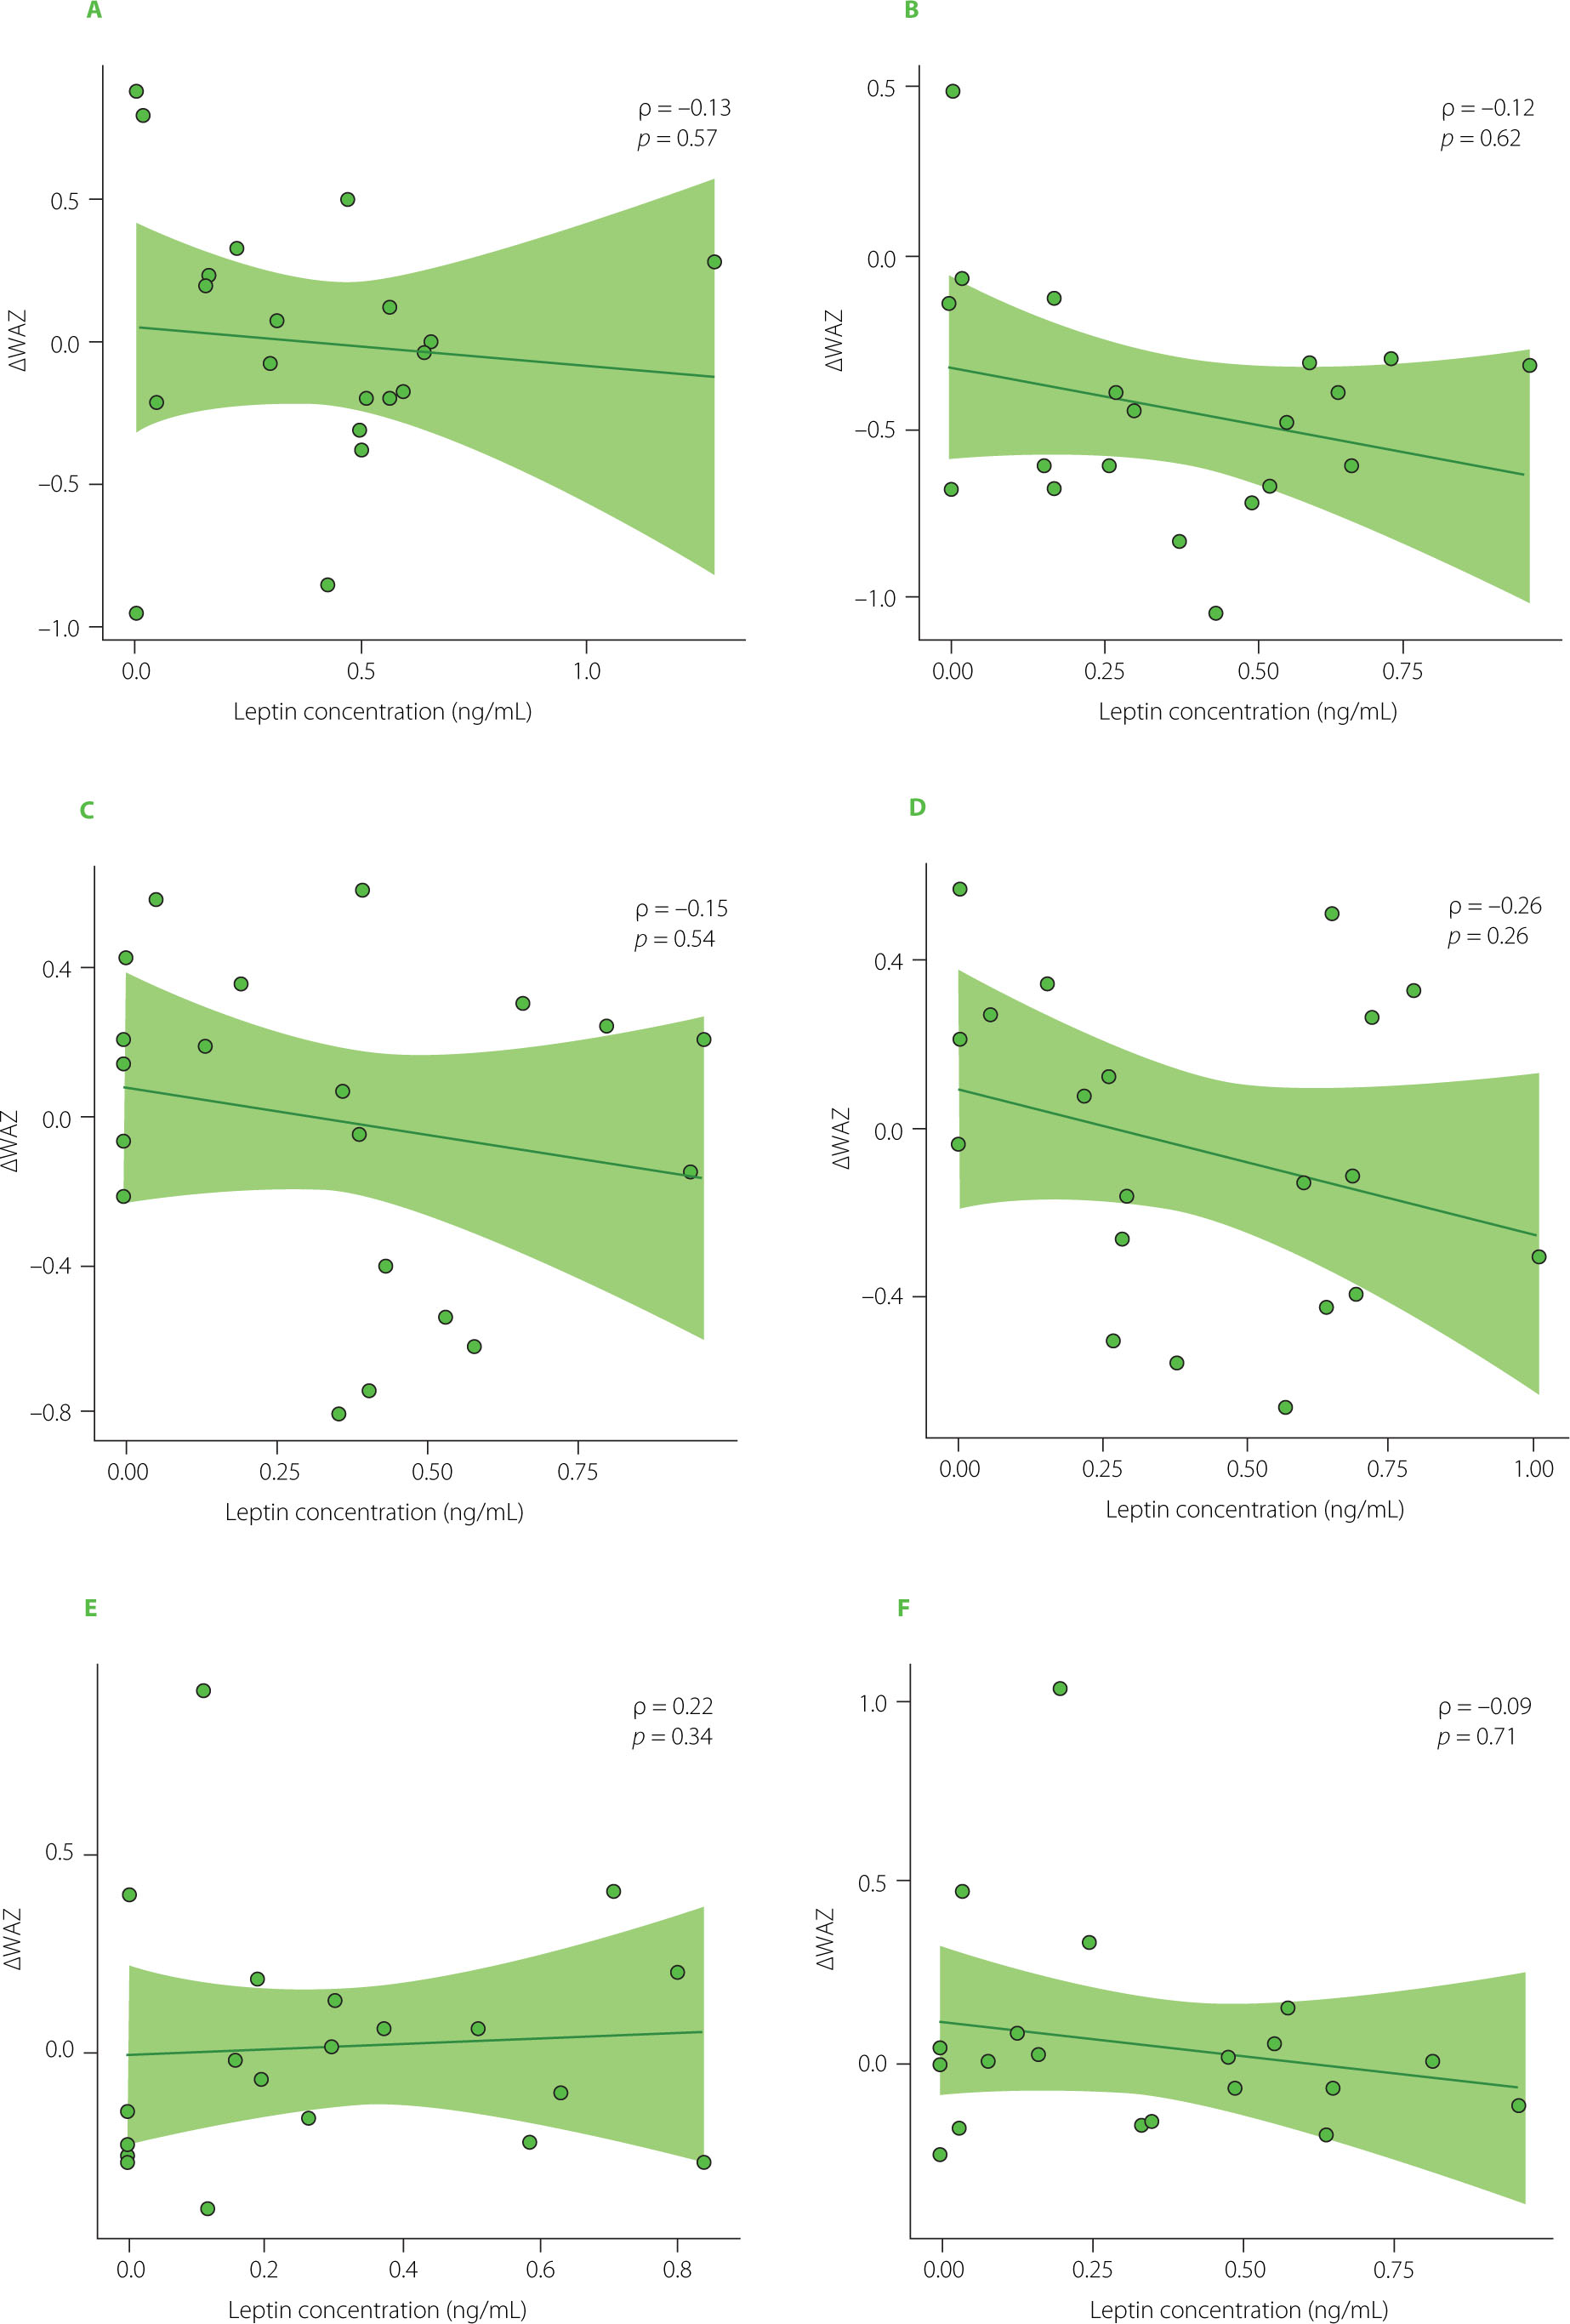
Figure 5
Spearman rank correlations between ghrelin concentration and changes in weight-for-age z-scores (ΔWAZ) at six time points during lactation: first month (A), second month (B), third month (C), fourth month (D), fifth month (E), and sixth month (F). The Spearman rank correlation coefficient (ρ) and the corresponding p-value are shown in the corner of each graph.
The relationships between leptin and ghrelin levels in human milk and infants’ growth patterns have also been explored in other studies [Christensen et al., 2022; Cortés-Macías et al., 2023; Khodabakshi et al., 2018; Kugananthan et al., 2017]. Interestingly, some studies have suggested that HM leptin may influence infant gut microbiome development, potentially contributing indirectly to growth outcomes [Lemas et al., 2016]. A study involving 18 normal-weight mothers and 12 obese mothers, along with their exclusively breastfed infants, demonstrated that higher HM leptin concentrations at 2 weeks postpartum were associated with lower bacterial protease activity, a marker of gastrointestinal inflammation in infants [Lemas et al., 2016]. Considering these results, the authors suggested that leptin may play a significant role in infant growth and should be considered within the broader framework of factors influencing early development. In turn, a recent study by Kebbe et al. [2024] reported no significant associations between HM leptin and the infant gut microbiome, highlighting the need for cautious interpretation. Taken together, these findings indicate that while HM leptin may play a role in infant growth, its effects could be mediated by multiple pathways, including but not limited to direct anthropometric outcomes.
Our study did not find any relationship between maternal pre-pregnancy BMI and infants’ weight gain during the first six months of life. In turn, Chan et al. [2018] reported that elevated HM leptin concentrations were correlated with a lower infant weight-for-length z-score at both 4 months (β of −0.65, 95% CI (confidence interval): −1.13, −0.16; p=0.0009 for highest vs. lowest quintile) and 1 year of age (β of −0.58, 95% CI: −1.02, −0.14; p=0.0009 for highest vs. lowest quintile) after adjusting for factors such as multiparity and exclusive breastfeeding, which were themselves associated with reduced leptin levels in HM. In contrast, an earlier study [Khodabakhshi et al., 2015] comparing exclusively breastfed overweight/obese infants (n=40) and normal-weight infants (n=40) found no significant differences (p>0.05) in exposure to HM leptin concentrations between 2 and 5 months postpartum. Additionally, the relationship between HM hormones and the infant gut microbiome has been explored.
As an appetite-stimulating hormone, ghrelin, is thought to influence feeding behavior and infant weight gain. Cesur et al. [2012] reported a significant positive correlation (p<0.05) between HM ghrelin levels at 4 months postpartum and infant weight gain during the same period. Similarly, Kon et al. [2014] found that at the first month of lactation, ghrelin levels in HM were significantly higher in a group of infants with normal weight gain (n=40) compared to those with low weight gain (n=18). However, in a group of infants with high weight gain (n=45), ghrelin concentrations were lower than in those with normal weight gain. These findings contrast with our study, where no significant association was observed between infant weight gain and ghrelin concentrations in HM. Additionally, Yu et al. [2018] reported no relationship between total ghrelin levels and infant head circumference or weight-for-height z-score. Interestingly, formula-fed infants (n=100) have been shown to exhibit higher plasma ghrelin levels than breastfed infants (n=106). While anthropometric measurements did not differ between these groups, Savino et al. [2005] found a negative correlation between ghrelin and BMI in formula-fed infants, suggesting that the feeding mode may play a role in ghrelin regulation and its impact on metabolic programming.
Beyond methodological considerations, it is also important to acknowledge the conceptual limitations of interpreting human milk hormone research based solely on concentration measurement. It should be noted that hormone concentration may not accurately represent the dose ingested by the infant when the exact volume of HM consumed is not measured. What is more, leptin and ghrelin levels capture only one potential bioactivity, while they do not account for different molecular forms (e.g., acylated vs. deacylated ghrelin), binding to carrier proteins, or the influence of milk fraction (foremilk vs. hindmilk) on bioavailability [Karatas et al., 2011]. Moreover, the ultimate effect is shaped by interactions with other bioactive milk components and by infant-specific factors, such as enzymatic modification in the gastrointestinal tract, epithelial transport, and receptor expression, which can modulate absorption and activity [Lönnerdal et al., 2017]. Discrepancies among studies may therefore reflect not only methodological differences (e.g., assay sensitivity, timing of collection) [Andreas et al., 2016; Suwaydi et al., 2023] but also these broader biological influences. Importantly, previous reviews emphasize that maternal metabolic status and systemic hormone levels may act as mediators between milk composition and infant outcomes [Qureshi et al., 2024]. In addition, milk hormones may interact with other milk-derived signals, such as the microbiome and immune factors, influencing infant development beyond direct hormone exposure [Lemas et al., 2016]. To better clarify these relationships, future research should complement concentration data with analyses of hormone isoforms and functional assessments (e.g., digestion stability, bioactivity in cell-based models), incorporate simultaneous maternal plasma and infant biomarkers, and work toward standardized sampling and reporting protocols. Such multidimensional approaches will strengthen biological validity and improve comparability across studies.
Strengths and limitations
One of the main strengths of this study is its longitudinal design, with six standardized milk collection time points within the first six months of lactation. All samples were collected in the morning under controlled conditions, with consistent handling and storage protocols, reducing potential pre-analytical variability. Macronutrient analysis was performed using validated method, allowing reliable results of nutritional milk composition. Moreover, hormone measurements were performed using ELISA kits intended for use with various liquid matrices, following prior adaptation of the method to human milk samples. However, our findings must be interpreted considering certain limitations. The relatively small sample size and the homogeneous study population (all participants were highly educated and from a single geographic area) may limit the extent to which the findings can be generalized. Small sample size restricted statistical power and may have contributed to the absence of significant associations. Recruitment was limited to mothers exclusively breastfeeding up to six months postpartum, a population group that is relatively rare in Poland, which further constrained sample size. Additionally, while we identified some correlations at specific time points, these may reflect transient or chance findings rather than consistent physiological patterns. A further limitation is that, although leptin and ghrelin concentrations were quantified in HM, individual milk intake volumes were not measured. Thus, we could not estimate infants’ total hormonal exposure, which may have influenced the observed associations. Another notable limitation of this study is the lack of data on more nuanced growth indicators, such as weight-for-length z-scores and BMI-for-age, which restricts the depth of our growth assessments and their interpretability. Furthermore, foremilk and hindmilk fractions were not analyzed separately, as pooled samples were used to reflect average hormonal exposure during feeding; therefore, potential differences in leptin and ghrelin concentrations between milk compartments could not be assessed. Finally, although we assessed several maternal and infant variables, other unmeasured factors, such as maternal diet, stress, and metabolic markers, may also influence milk composition and merit further investigation in future studies.
CONCLUSIONS
In this longitudinal study, leptin and ghrelin concentrations in human milk remained relatively stable during the first six months of lactation, and no association was detected in this cohort with the available infant growth metrics (including weight gain). These findings suggest that, within the limits of our sample and the absence of milk intake data, HM leptin and ghrelin are unlikely to be major independent determinants of early postnatal weight accretion.
However, given the well-established physiological roles of these hormones in appetite regulation, gut maturation, and metabolic signaling, and considering that their biological effects may not be fully reflected by concentration measures alone, further studies in larger and more diverse populations, incorporating functional and mechanistic outcomes, are advised to clarify their potential contributions to infant development and metabolic programming.