INTRODUCTION
Honey is a unique natural food product with nutritional and bioactive properties produced by honeybees (Apis mellifera L.) actively collecting nectar from flowering plants. The quality of this fascinating product is highly affected by the bee species, geographical location, and available nectar source, as well as processing temperature, type of packaging, storage conditions, and climatic changes [Da Silva et al., 2020; Piepiórka-Stepuk et al., 2025; Shamsudin et al., 2019; Smetanska et al., 2021]. In addition to being a significant source of energy, honey is also used as an ingredient in various food products due to its sweetness, color, aroma, and viscosity properties, and as a medicine due to its biological activities coupled with health-promoting properties [Al-Kafaween et al., 2023; Babbar et al., 2022]. Honey is generally classified into two types; blossom honey and honeydew honey. Sunflower honey, chestnut honey, linden honey, and thyme honey can be given as examples of blossom honeys, on the other hand, in the recent past, honeydew honeys such as oak, cedar, and pine honeys have been highly sought after by consumers compared to blossom honeys due to their proven higher nutritional values as well as antibacterial and antioxidant activities [Pita-Calvo & Vázquez, 2017].
The Thrace region, which includes the northwestern part of Türkiye, provides a very favorable environment for beekeeping thanks to its plant diversity [Kekeçoğlu et al., 2021]. At this point, the northwestern part of Türkiye serves as a primary agricultural center, contributing more than 50% of the country’s total sunflower (Helianthus annuus L.) production [Unakıtan & Aydın, 2018], and with the use of bee colonies in terms of oilseed yield, it provides a high nectar intake and efficient honey production [Abbasi et al., 2021]. Sunflower honey has high pollen and glucose contents that make it unique in terms of nutritional value and brilliant sweetening properties [Manolova et al., 2021]. Another unique blossom honey specific to this region is produced by the flowering of the plant called garland thorn or Christ’s thorn (Paliurus spina-christi Miller), belonging to the Rhamnaceae family. In the region, the plant blooms between the end of May and July depending on weather conditions, and honeybees collect the nectar from these flowers. This specific honey varies in color from yellow to light brown, is slightly bitter, crystallizes very quickly [Kenjerić et al., 2008], and is also known as spring honey in the region due to its harvest period. Unlike blossom honeys, oak honey belonging to the honeydew honeys, is a valuable type of honey that exhibits differences in terms of its characteristic features such as being very dark in color, rich in phenolic compounds, and possessing a distinctive aroma [Seijo et al., 2019]. Oak honey is a natural product made by bees from honeydew secretions released by the oak trees (Quercus frainetto Ten. and Quercus robur). This particular kind of honey is sourced from Thrace, northwest Anatolia, and the Istranca Mountains, a region distinguished by its abundant oak forests [Kolayli et al., 2018]. Considering the production amounts, local sources report that the annual oak honey production varies between 100 and 300 tons and that of garland thorn honey varies between 150 and 200 tons [MinAF, 2025], attributable to the region’s rich oak forests source and diverse flora. In addition, an average of 8,000 tons of sunflower honey is produced annually across Türkiye [Şahin, 2021].
Today, the growing global demand for honey, coupled with its high value, has made the quality and authenticity of products a critical concern. In this context, the systematic analyses of honey on a country- and region-specific basis is crucial for enriching the current literature and creating a comprehensive database of quality parameters for various honey varieties. In that framework, this study investigated the quality properties of oak (Quercus spp.), garland thorn (Paliurus spina-christi Mill.), and sunflower (Helianthus annuus L.) honeys, sourced from the rich plant diversity of the Thrace region. By conducting various analyses and comparing the results, it was aimed to establish a more comprehensive dataset for these specific honey types.
MATERIALS AND METHODS
Materials
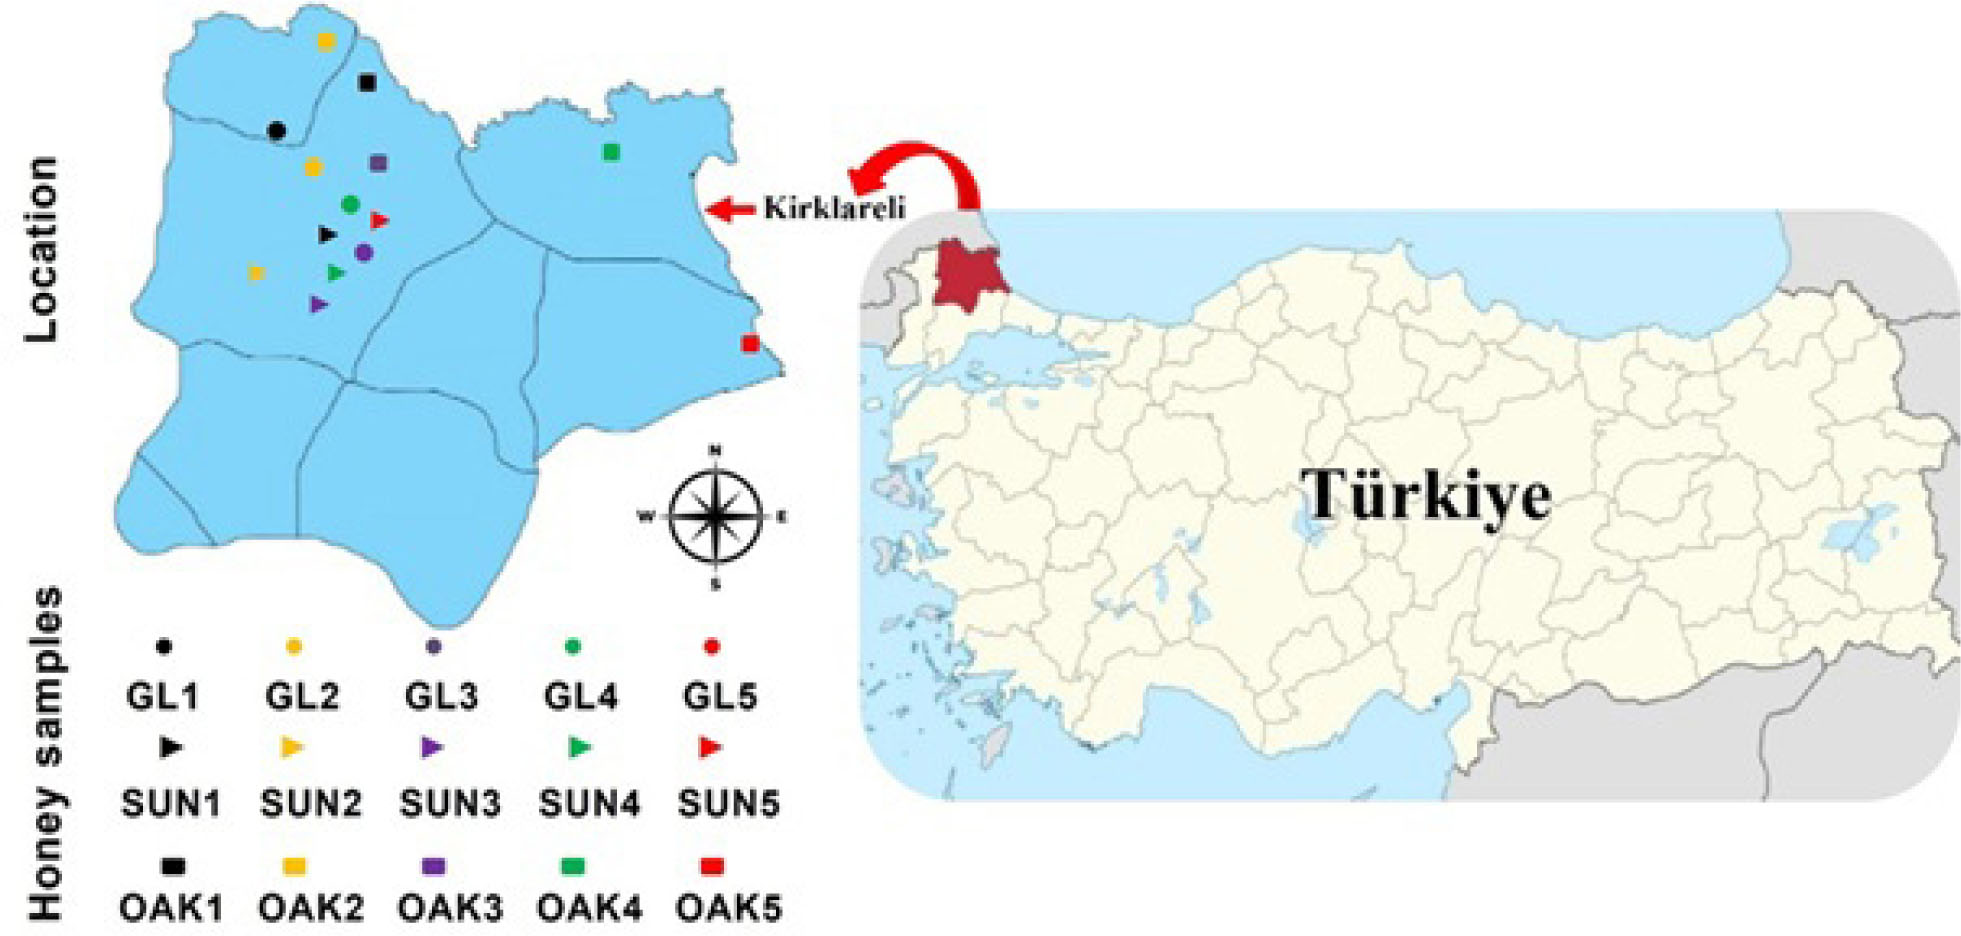
A total of 15 honey samples were analyzed in the study, including 5 samples each of sunflower honey (SUN1–SUN5), garland thorn honey (GL1–GL5), and oak honey (OAK1–OAK5) harvested in 2023, and provided in 750-g glass jars from local beekeepers operating in various districts of Kirklareli province located in the northwestern part of Türkiye. The detailed locations of the places where the honey samples were taken are given in Figure 1. The samples were stored at room temperature (22.5±2.5°C) in the dark until analyzed. All chemicals used were of analytical grade and purchased from Sigma-Aldrich, Burlington, MA, USA.
Physicochemical analyses of honey samples
The total soluble solids (TSS) of the honey samples were measured at ambient temperature using a digital refractometer (Hanna HI 96801, Hanna Instruments, Smithfield, RI, USA), and the results were expressed in °Brix (°Bx). The correction factor of 0.00023/°C was used to adjust the readings for a standard temperature of 20°C [AOAC, 2005].
The pH of honey was measured using a pH meter (Hanna HI 2211, Hanna Instruments). To this end, a honey solution was prepared by dissolving 10 g of the sample in 75 mL of distilled water.
Free acidity (FA), ash content, electrical conductivity (EC), optical rotation, hydroxymethylfurfural (HMF) content, diastase activity, and proline content of the honey samples were determined using the harmonized methods of the International Honey Commission (IHC) [Bogdanov et al., 2009]. To determine FA, the aqueous solution of honey at a concentration of 10 g/75 mL of water was titrated with 0.1 M NaOH to reach pH 8.30, and the titrant volume was used to calculate the FA value expressed in meq/kg. The ash content was determined by gravimetry after ashing 2–5 g of honey samples in the muffle furnace (Wisd/DHFHP-03, Seul, Korea) at 600°C for 6 h. The results were expressed in g/100 g of honey. The EC (μS/cm) was measured using a conductivity meter (Jenco/3173 Cond, San Diego, CA, USA) in a 20% (w/v) honey solution in distilled water. A Krüss P3000 polarimeter (Krüss Scientific Instruments, Hamburg, Germany) was used to measure the optical rotation of purified aqueous honey solutions. Briefly, a sample of 12 g of honey was dissolved in distilled water, and Carrez I reagent was added, followed by Carrez II reagent in the amount of 10 mL each. The volume of the solution was adjusted to 100 mL, and next the solution was left for 24 h. The mixture was then filtered, and the filtrate was thermostated at 20°C. A polarimeter tube was filled with the thermostated solution, and the rotation angle (α) was read on the polarimeter.
The HMF content was determined spectrophotometrically using the Winkler method [Bogdanov et al., 2009]. Briefly, 10 g of honey was initially diluted in 20 mL of distilled water. To this solution, 1 mL each of Carrez I and Carrez II reagents was incorporated, and the volume was brought up to 50 mL with distilled water. The solution was filtered, and the first 10 mL of the filtrate was discarded to ensure the clarity. For the measurement, two separate test tubes were prepared, each containing 2 mL of the filtered sample solution and 5.0 mL of a p-toluidine solution. The blank tube received 1 mL of distilled water, while the sample tube received 1 mL of a 0.5% barbituric acid solution. The absorbance was immediately measured against the blank at 550 nm using a spectrophotometer (UV/Vis-1800, Shimadzu, Kyoto, Japan). The results were subsequently calculated using the formula established for the analysis (Equation 1) and reported as mg/kg of honey:
where: A is the absorbance of the sample against the blank, 192 is the factor for dilution and extinction coefficient, and W is the weight of honey (g).
The diastase activity was determined according to the following procedure: honey (10 g) was dissolved in 15 mL of distilled water. To this solution, 5 mL of acetate buffer (pH 5.3) and 3 mL of an NaCl solution (2.9%, w/v) were added, and the volume was completed to 50 mL with distilled water. The samples were incubated in a water bath (Wisebath, WB-22, Daihan, Seul, Korea) at 40°C for 15 min. Then, 5 mL of a 2% (w/v) starch solution (pre-warmed to 40°C) were added to 10 mL of a sample solution, and a stopwatch was started immediately. The necessary dilution volume was first standardized by calibrating the starch solution. This volume of distilled water ensures that the starch-iodine blank produces a defined initial absorbance (~0.760 at 660 nm) for the test. At fixed time intervals (e.g., every 5 min), a 0.5 mL aliquot was quickly withdrawn from the reaction mixture and mixed with 5 mL of a dilute iodine solution and the calibrated volume of distilled water. The analysis proceeded until the absorbance measured at 660 nm (UV/Vis-1800, Shimadzu) dropped below 0.235. The absorbance values were plotted against the corresponding reaction times in minutes to derive a linear regression equation. The time (tx) required for the reaction mixture to reach an absorbance of 0.235 was calculated using this equation, and the diastase number was subsequently determined by the formula of 300/tx [Bogdanov et al., 2009].
To determine the proline content, 5-g portions of honey samples were first dissolved in 100 mL of distilled water. Then, 0.5 mL of the designated solution (deionized water for the blank, proline standard solution, and diluted honey sample) was added to three test tubes separately. This was followed by the sequential addition of 1 mL of formic acid and 1 mL of a 3% ninhydrin solution. The capped test tubes, after mixing the solution, were placed in a boiling water bath for 15 min and then transferred to a water bath at 70°C for 10 min. Subsequently, 5 mL of the 2-propanol/water mixture (1:1, v/v) were added to each test tube, after cooling to ambient temperature for 45 min. The absorbance was measured at 510 nm (UV/Vis-1800, Shimadzu), and proline content in mg/kg of honey was calculated according to Equation (2) [Bogdanov et al., 2009]:
where: AS is the absorbance of the solution with sample, AP is the absorbance of the solution with proline, WP is the weight (mg) of proline used for the standard solution, WS is the weight of honey (g), and 80 is the dilution factor.
Prior to viscosity analysis, honey samples (225 mL) were adjusted to 25°C. Then, their viscosity was measured using a B One-Plus viscometer (Lamy Rheology Instrument, Lyon, France) with an RV4 spindle at 50 rpm for 20 s. The results were recorded as Pa×s.
The fructose and glucose contents of honey samples were determined by the method based on the Association of Official Analytical Chemists (AOAC) standard [AOAC, 2005] using a high-performance liquid chromatography (HPLC) system (LC-2060C 3D, Shimadzu, Kyoto, Japan) with a refractometric detector (RID-20A). A Zorbax-carbohydrate column (4.6×150 mm, 5μm, Agilent, Santa Clara, CA, USA) was used for sugar separation, and the mobile phase consisting of acetonitrile and ultrapure water (83:17, v/v) was fed to the system at a flow rate of 1.00 mL/min. The column temperature was set at 40°C, and the injection volume was 10 μL. For the preparation of honey sample, 5 g of the sample were weighed and dissolved in 50 mL of ultrapure water in a volumetric flask and passed through a millipore 0.45 μm polyvinylidene fluoride (PVDF) filter before being injected. Then, the aliquots of the individual standards were injected, and their retention times were used to identify the peaks corresponding to glucose and fructose in the sample separation. Quantification was done according to an external standard method, and glucose and fructose contents were expressed in g/100 g of honey. Additionally, the fructose-to-glucose ratio (F/G) was calculated.
The color parameters of the samples were determined using a color measurement equipment (Chromameter CR-400 Konica Minolta, Tokyo, Japan). Prior to measurements, the instrument was calibrated with a white standard plate, and the L* (brightness), a* (redness-greenness), and b* (yellowness-blueness) values of the samples were recorded. Then, the chroma (C) and hue angle (h°) of the samples were calculated using Equation (3) and Equation (4), respectively [McLellan et al., 1995]:
Preparation of honey extracts
The extraction process was carried out by modifying the method specified by Uçar et al. [2023]. First, 4 g of honey were weighed and mixed with 16 mL of 80% (v/v) methanol. Then, the samples were kept in a shaking water bath at 25°C for 24 h. At the end of the period, the samples were filtered using a millipore 0.45 μm PVDF filter. The process was carried out in three repetitions for each honey, and each extract was transferred to amber glass bottles and stored at −18°C for further analyses.
Total phenolic content and total flavonoid content analyses
The total phenolic content (TPC) analysis was performed by the colorimetric method of Singleton et al. [1999] using the Folin-Ciocalteu reagent with certain modifications. The prepared extract (200 μL) was first pipetted into a test tube. This was followed by the addition of 1 mL of a 0.2 N Folin-Ciocalteu reagent and 1 mL of saturated sodium carbonate (75 g/L). After brief mixing, the reaction was allowed to proceed for 3 min. Then, the final volume was brought up to 10 mL with distilled water. Tubes were left to stand for 90 min in the dark, and absorbance readings were taken at 725 nm (UV/Vis-1800, Shimadzu) against the blank solution. In the meantime, the absorbance values of gallic acid (as a standard) solutions were also determined under the same conditions, and a linear calibration curve was obtained. The total phenolic content of the samples was calculated from the equation of the resulting standard curve, and the results were expressed as mg gallic acid equivalents (GAE)/kg honey sample taking into account the applied dilution factors.
The total flavonoid content (TFC) was determined using the aluminum chloride colorimetric method according to Shraim et al. [2021] with some modifications. Initially, 4 mL of distilled water were added to the test tubes, followed by the pipetting of 1 mL of the extract and 1 mL of distilled water for the blank. Subsequently, 300 μL of 1 M NaNO2 were added to the tubes, and mixtures were then vortexed and allowed to stand for 3 min. Following this, 300 μL of AlCl3 (10%, w/v) were added, the mixtures were re-vortexed, and allowed to stand for an additional 3 min. Finally, 2 mL of 1 M NaOH and 2.4 mL of distilled water were added to all tubes to reach a final volume of 10 mL, and the solutions were vortexed. Upon completion of the procedure, the tubes were incubated in the dark for 40 min. At the end of the incubation period, the absorbance values were read against blank at 420 nm using a spectrophotometer (UV/Vis-1800, Shimadzu). The results were expressed as mg catechin equivalents (CE)/kg honey sample, using a catechin calibration curve and taking into account the applied dilution factors.
Antioxidant activity analyses
The method suggested by Nagai et al. [2004] was used with a slight modification for 2,2-diphenyl-1-picrylhydrazyl (DPPH) radical scavenging activity determination. The previously prepared sample extract (200 μL) was mixed with 200 μL of a 1.0 mM DPPH solution, and then 1,600 μL of methanol was added. For the control, 1,800 μL of pure methanol were added to 200 μL of a 1.0 mM DPPH solution, and the mixture was kept in the dark for 30 min. At the end of the period, the absorbance of the mixtures was read at 517 nm on a spectrophotometer (UV/Vis-1800, Shimadzu). The % inhibition values were calculated using the control and sample absorbances. A calibration curve consisting of Trolox concentrations against % inhibition values was also prepared, and the DPPH radical scavenging activity of the samples was expressed as μmol Trolox/100 g honey, taking into account the dilution rates.
The method of Re et al. [1999] was used to determine the 2,2’-azino-bis(3-ethylbenzothiazoline-6-sulfonic acid (ABTS) radical cation scavenging activity of the honey samples. First, 7 mM ABTS and 2.45 mM of K2S2O8 solutions were mixed at the ratio of 1:1 (v/v), and the mixture was left in the dark at ambient temperature for 16 h. Then, the solution with generated ABTS•+ was diluted with methanol to an absorbance of 0.700±0.01 at 734 nm to obtain the working solution. For the spectrophotometric assay, 100 μL of the prepared extracts or pure methanol as control and 2 mL of the ABTS•+ working solution were mixed, and the solutions were incubated at 30°C for 6 min. The absorbance value of the samples was measured against pure methanol at 734 nm in a spectrophotometer (UV/Vis-1800, Shimadzu), and the results were recorded as μmol Trolox/100 g honey using a calibration curve consisting of Trolox concentrations vs. % inhibition values considering the dilution rates.
Statistical analysis
Windows-based SPSS 17.0.1 (SPSS Inc., Chicago, Illinois, USA) statistical package program was used for statistical evaluation of the data obtained from the analyses. One-way analysis of variance (ANOVA) was applied to the results, and differences between group means were explained using Duncan test at p<0.05 level. The bivariate Pearson correlation test (one-tailed) was used to evaluate whether there was a correlation between the results. All measurements were conducted in triplicate, and the results were given as mean values with standard deviation.
RESULTS AND DISCUSSION
Physicochemical parameters of honey
Selected physicochemical properties of the honey samples are provided in Table 1. The results showed that the TSS values ranged from 81.20°Bx to 85.07°Bx. The lowest TSS value was determined in OAK5 and the highest in GL samples (GL2, GL3, GL4) (p<0.05). The TSS value is linked to the sugar content of honey, which consists mainly of glucose and fructose [Shamsudin et al., 2019]. Thus, the differences in this parameter can be attributed to the different amounts of sugars present in the honeys. Habib et al. [2014] found that the TSS values of 16 honeys obtained from arid and non-arid regions ranged between 79.0 and 84.1°Bx, and these values were similar to the current findings. The obtained results also resemble the values obtained for Brazilian honeys (80.89–83.57°Bx) [Da Silva et al., 2017] and Italian honeys (80.0–83.8°Bx) [Conti, 2000]. However, lower values were reported for Indian honeys (76.2–80.4°Bx) by Saxena et al. [2010], which may be due to harvesting processes, beekeeping techniques, and also geographical and botanical origin of honey.
Table 1
Physicochemical parameters of sunflower (SUN), garland thorn (GL), and oak (OAK) honeys.
[i] Data represent mean values ± standard deviation. There is no significant difference between the results for all samples shown with the same superscript capital letter (A–K) in the same column (p≥0.05). There is no significant difference between the results shown with the same superscript lowercase letter (a–e) in the samples of the same honey type in the column (p≥0.05). TSS, total soluble solids; FA, free acidity; EC, electrical conductivity.
The pH values of the samples ranged between 3.41 and 5.39, with the highest pH value being found in the GL4 sample and the lowest pH value being found in the SUN1 sample (p<0.05) (Table 1). Briefly, GL and OAK samples showed similar pH values, while significantly lower values were observed in SUN samples (p<0.05). All honeys are acidic in nature due to the presence of organic acids, and their pH values generally change between 3.5 and 5.5. This acidic environment provided by organic acids prevents microbial growth and thus affects the stability and shelf life of honeys [Khataybeh et al., 2023]. The FA values of the investigated honeys ranged from 17.88 to 49.15 meq/kg. In general, OAK honey samples showed significantly higher FA than the other two sample groups (p<0.05) except SUN1 sample, while GL honeys had the lowest values (p<0.05). The pH and FA indicate honey quality; however, pH does not directly reflect the acidity because various minerals and salts act as buffers [De-Melo et al., 2018] and explains the results found for the OAK samples in this study. The FA of honey depends on the presence of organic acids, especially gluconic acid, and their corresponding lactones, usually coming from nectar or bees’ secretions [Truzzi et al., 2014a]. Considering the limit value, the free acidity of commercial honey should not exceed 50 meq/kg [Bogdanov et al., 1999], and the current results indicated that all honeys were of good quality and did not undergo undesirable fermentation. Choi & Nam [2020] reported that the free acidities of honeydew, chestnut, multifloral, and acacia honeys were 31.2, 23.1, 19.8, and 13.5 meq/kg, respectively. Similarly, in the study of Truzzi et al. [2014a], honeydew samples showed significantly higher FA (38.0 meq/kg) than sunflower (19.4 meq/kg) and acacia honeys (10.9 meq/kg).
The EC of the samples ranged between 0.39 and 1.09 μS/cm (Table 1). According to the Council of the European Union, honey with an EC value of >0.80 is classified as honeydew honey, and honey with an EC value of <0.80 is considered as a blossom or a blossom-honeydew honey mixture [Council EU, 2001]. In this regard, while the highest values were detected in OAK honey samples, interestingly, the ECs of GL samples were found to be significantly higher than SUN samples (p<0.05), even though both were blossom honeys. This can be assigned to the significantly higher ash content of the GL samples (p<0.05) since a higher ash content generally points to higher EC values. Similar findings were reported in the studies of Ouchemoukh et al. [2007] and Saxena et al. [2010], who found that the EC of honey samples increased with an increase in the ash content and determined higher EC values in honeydew honeys compared to blossom honeys.
Considering the optical rotation, the values changed between −1.42 and +0.17, depending on the type of honey (Table 1). SUN and GL samples showed negative values which was due to the dominance of fructose with negative optical rotation ([α]D 20=−92.4°) over the glucose ([α]D 20=+52.7°). Honey can rotate the polarization plane of polarized light, and the optical rotation is mainly related to the types and concentrations of the sugars present in honey [Pita-Calvo & Vázquez, 2017]. In general, blossom honeys are levorotatory, and honeydew, mixed, or adulterated honeys are dextrorotatory [Bogdanov et al., 1999]. Manolova et al. [2021] reported that the 27 sunflower honey samples showed a negative optical rotation; but the mean value (−17.23) was lower than that of the samples examined in this study. Kenjerić et al. [2008] found the mean optical rotation value of 18 GL honeys as −6.71 with minimum and maximum values of −12.59 and −3.45, respectively. Despite the fact that OAK samples also had higher amounts of fructose compared to glucose (Table 2), OAK1, OAK4, and OAK5 samples showed positive values. This can be attributed to the presence of melezitose ([α]D 20=+88.2°) and erlose ([α]D 20=+121.8°) in OAK samples, which contribute to the dextrorotatory property [Pita-Calvo & Vázquez, 2017]. In this regard, Kolayli et al. [2018] reported that 8 out of 20 oak honeys showed positive optical rotation values.
Table 2
Glucose, fructose, hydroxymethylfurfural (HMF), and proline contents, and diastase activity of sunflower (SUN), garland thorn (GL), and oak (OAK) honeys.
[i] Data represent mean values ± standard deviation. There is no significant difference between the results for all samples shown with the same superscript capital letter (A–H) in the same column (p≥0.05). There is no significant difference between the results shown with the same superscript lowercase letter (a–d) in the samples of the same honey type in the column (p≥0.05). F/G, fructose-to-glucose ratio.
The viscosity of honey samples ranged from 5.59 to 32.45 Pa×s (Table 1). There was a significant difference between the samples (p<0.05), and the highest and lowest viscosity values were found in GL1 and OAK5 samples, respectively. Viscosity is a critical parameter as it directly governs the rate and extent of crystallization. Hence, it is of great importance in the handling, processing, and storage of honey [Piepiórka-Stepuk et al., 2025]. Scripcă & Amariei [2021] found lower viscosity for sunflower honeys with values changing between 7.02 and 7.87 Pa×s. According to Uçurum et al. [2023], the lowest and highest viscosity for 373 pine honeydew honeys were found as 0.75 and 16.20 mPa×s, respectively. Moreover, the authors stated that the mean viscosity values showed significant differences depending on the harvest year and geographical origin. Therefore, the varying viscosity reported in the literature may be due to the maturity of honeys at collection, their chemical composition, and their geographical and botanical origins.
The sugar and HMF contents, diastase activity, and proline content of the honey samples are provided in Table 2. The glucose and fructose contents ranged from 26.94–39.58 g/100 g and 29.80–38.47 g/100 g, respectively. SUN honey samples had the highest glucose content (p<0.05), while GL and OAK honey samples had comparable amounts. Considering the fructose content of the samples, it was determined that the highest values were again detected in the SUN honey group (p<0.05), but some samples of GL honey group (GL1, GL2, and GL3) also had values close to the peak value. However, the samples belonging to the OAK honey group were categorized as honeys with the lowest fructose content (29.80–32.81 g/100 g). Fructose content of honey samples was higher than glucose content, except for two SUN honey samples (SUN2 and SUN3). This finding was consistent with observations made in previous studies [Baloš et al., 2023; Kolayli et al., 2018]. Rodríguez-Flores et al. [2019] reported that the average glucose content of oak honeys collected from the north-western region of Spain was 26.8 g/100 g, and fructose content was 35.7 g/100 g. In a different study, Malkoç et al. [2019] reported that the content of fructose in garland thorn honey was between 30.32 and 38.70 g/100 g, that of glucose was between 23.17 and 30.50 g/100 g, and the fructose-to-glucose ratio (F/G) reached 1.18–1.46. Regarding the same region where the honeys were collected in the current study, it was determined that the glucose content of the oak honeys examined by Ucurum et al. [2024] was in the range of 21.29–33.49 g/100 g, fructose content was 29.34–41.86 g/100 g, and F/G was between 1.23 and 1.85.
Considering the HMF content (Table 2), it varied between 0.77 and 4.51 mg/kg in all samples, with the lowest value determined in the OAK3 sample (0.77 mg/kg). The HMF content is a crucial indicator of honey quality, as reviewed by Shapla et al. [2018]. The authors noted that HMF is typically absent in fresh honey but accumulates significantly during processing, maturation, or when the honey is stored at high temperatures. Therefore, a high HMF content signals overheating or unfavorable storage conditions [Shapla et al., 2018]. In this regard, the Codex Alimentarius commission has determined the maximum limit for HMF in honey at 40 mg/kg (80 mg/kg for honeys originating from tropical regions) [Codex Alimentarius, 2001]. Accordingly, it can be concluded that the HMF content of all honey samples investigated in the current study was well below this limit value, indicating the freshness of the samples and no heat treatment by producers. According to a study by Apaydın [2022] aimed to ascertain the quality characteristics of honey samples from the Thrace Region, the HMF content of sunflower honey samples ranged from 1.45 to 31.50 mg/kg, whereas those of garland thorn and oak honey samples were 0.16 to 0.30 mg/kg and 1.65 to 4.10 mg/kg, respectively.
The diastase activity of SUN, GL, and OAK honeys was in the range of 12.26–18.72, 14.00-23.95, and 13.53-24.58, respectively (Table 2). The values varied within the honey samples of the same group (p<0.05), and the highest values were found in GL4 (23.95), OAK2 (24.58), and OAK4 (22.71) samples, while the lowest value was detected in the SUN2 sample (12.26) (p<0.05). According to the International Honey Commission’s Honey Quality and International Regulatory Standards, the number of diastase activity should be above 8 [Bogdanov, 2009]. Within this perspective, the current results showed additional support for the naturalness of honey samples. In other studies, the diastase activity range of sunflower honey was determined to be between 9.00 and 20.80 [Manolova et al., 2021], while the average diastase activity of oak honey was determined to be 24.4 [Rodríguez-Flores et al., 2015], which coincide with the current study values.
Considering the proline content, the acceptance threshold for genuine honey is set at a minimum of 180 mg/kg in regulatory testing facilities [Bogdanov et al., 1999]. In this regard, the highest proline content was 884.3 mg/kg in the OAK3 sample, and the lowest value was 568.5 mg/kg in the SUN4 sample (Table 2). Manolova et al. [2021] found that the proline content of sunflower honey samples ranged from 218.5–679.5 mg/kg. Furthermore, it was reported that the proline content of sunflower honey was 647 mg/kg [Truzzi et al., 2014b], garland thorn honey had 720.15 mg/kg [Malkoç et al., 2019] and content in oak honey ranged from 434.09–1242.05 mg/kg [Kolayli et al., 2018], which were comparable with the current values.
Color parameters of honey
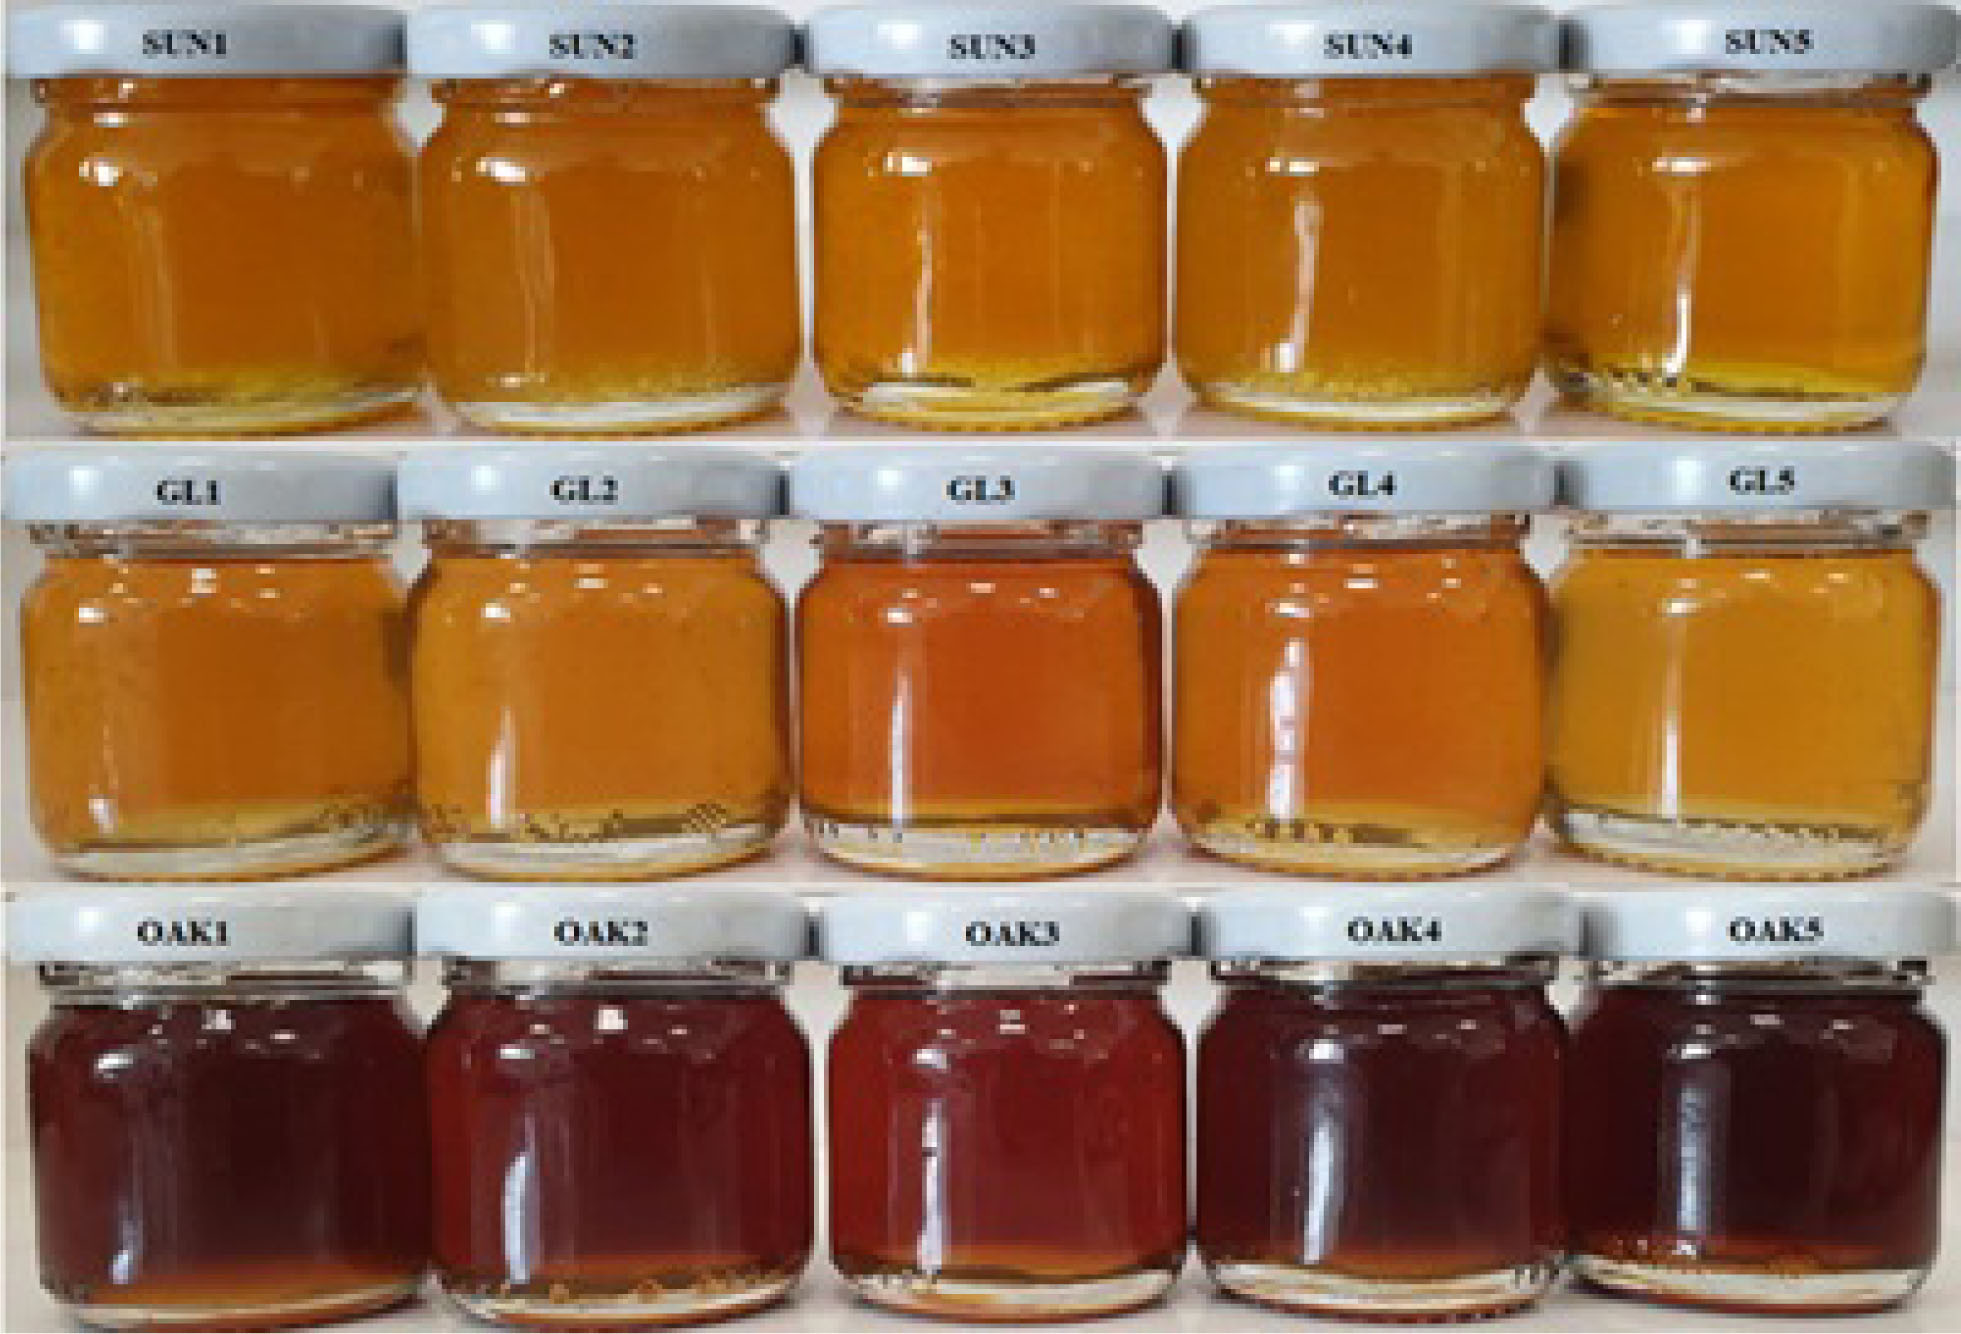
The results of color analysis are provided in Table 3, and the general appearance of the samples in a transparent glass jar is presented in Figure 2. The L* values of all honeys varied between 33.65 and 76.77, a* values varied between −6.74 and 24.01, and b* values varied between 22.90 and 59.92. Chroma and hue angle for honey color ranged from 28.34 to 60.17 and from 48.98 to 102.5, respectively. Accordingly, the highest L* value was recorded in the GL group (76.77 for GL5), and the highest a* values in the OAK group (24.01–22.64 for OAK1 and OAK4). The highest b* value was found in the GL group (59.92 for SUN5), although the values determined for SUN1, SUN3, and GL3 did not differ significantly (p≥0.05) from that determined for SUN5. Several samples had high and statistically similar C value (SUN1, SUN5, and GL3). Among the honey samples of the GL group, there was one with the highest h° value (GL5, 102.5). Oroian & Ropciuc [2017] determined that the C and h° values of sunflower honey were higher than of other honeys, and results of the present study were similar. In a study examining the chemical contaminant and physicochemical properties of various honey samples, contrary to the current results, the L*, a*, b*, C, and h° values of sunflower honey were 37.48, 2.22 12.32, 1.38, and 47.84, respectively [Scripcă & Amariei, 2021]. In another study, the L* values of garland thorn honeys varied between 17.91 and 62.38, a* values varied between 14.92 and 39.20, and b* values varied between 24.07 and 92.02 [Malkoç et al., 2019], and these values were similar to the L* and b* values of the GL honeys analyzed in our study, but a* values were higher. In the study of Kolayli et al. [2018], the L*, a*, and b* values of oak honey samples were in the range of 15.11–42.13, 27.94–37.38, and 25.73–70.20, respectively. In a study performed on oak honeys collected in Spain, the L* values of the samples were between 19.59 and 54.57, a* values between 7.82 and 30.29, b* values between 8.39 and 27.52, C values between 11.87 and 41.27, and h° values between 42.92 and 73.80 [Jara-Palacios et al., 2019]. These results obtained in different studies show that there may be differences in the color values of the samples due to the techniques applied in the color analysis method together with the type of honey and the region it was sourced from. In fact, the color of honey is primarily determined by its composition, which includes key colorful components like phenolics, pigments, vitamins, and minerals [Becerril-Sánchez et al., 2021]. In this regard, the current results contributed that the OAK honeys were darker than blossom honey samples due to their higher phenolic contents (Table 4) and had quite different color characteristics, as seen in Figure 2. On the other hand, it was stated that the EC value was also related to the color of the honey; a darker color indicated higher EC [Vîjan et al., 2023], which was consistent with the current study results provided in Table 1, especially for the OAK honey samples.
Table 3
Color parameters of sunflower (SUN), garland thorn (GL), and oak (OAK) honeys.
[i] Data represent mean values ± standard deviation. There is no significant difference between the results for all samples shown with the same superscript capital letter (A–H) in the same column (p≥0.05). There is no significant difference between the results shown with the same superscript lowercase letter (a–d) in the samples of the same honey type in the column (p≥0.05). L*, brightness; a*, redness–greenness; b*, yellowness–blueness; C, chroma; h°, hue angle.
Total phenolic content, total flavonoid content, and antioxidant activity of honey
The results regarding the phytochemical content and antioxidant activity of honey samples, including TPC, TFC, and DPPH• and ABTS•+ scavenging activity, are provided in Table 4. The TPC and TFC of all honeys ranged from 327.9 to 1362.4 mg GAE/kg honey and from 152.1 to 945.0 mg CE/kg honey, respectively. The OAK honey group exhibited the highest values for TPC and TFC, while the light-colored SUN honey group demonstrated the lowest values (p<0.05). In comparison with lighter varieties, darker honeys generally demonstrate enhanced levels of both total phenolic compounds and mineral micronutrients [Sant’ana et al., 2014], and the current study results confirm exactly this fact. The TPC and TFC are abundant plant-derived metabolites recognized as primary determinants of overall antioxidant activity of samples [Muflihah et al., 2021]. Within this respect, considering the DPPH• and ABTS•+ scavenging activity, the results determined for all honey samples varied between 47.2 and 192.2 μmol Trolox/100 g honey and between 87.9 and 712.2 μmol Trolox/100 g honey, respectively, with the highest values found again in the OAK honey samples, and only a small difference noted between the results within the samples in the other two honey groups. These results are parallel to those found in the literature and show that oak honey is a rich source of phenolic compounds. For instance, Can et al. [2015] determined that among the honey samples examined, oak honey had higher TPC (120.04 mg GAE/100 g) than other samples such as chestnut, heather, lavender, and acacia honey. Similarly, in a study performed by Tananaki et al. [2024] on various honey samples, it was concluded that oak honey (203.7 mg GAE/100 g) shared the top spot with Manuka honey (179.5 mg GAE/100 g) in terms of TPC, and also contained approximately three times higher TPC than citrus honey and twice as much as thyme honey. On the other hand, it can be concluded that the samples of the other two honey groups examined in the current research also had significant TPC being higher compared to various blossom honeys, such as acacia and clover [Can et al., 2015]. In the meantime, the TFC values also showed similar trends with that of TPC values. In this context, according to the Pearson correlation performed between the TPC and TFC of all honey samples, a highly significant positive correlation (r=0.989, p<0.01, one-tailed) was determined, indicating that flavonoids are the major phenolics of the samples.
Table 4
Phytochemical characteristics of sunflower (SUN), garland thorn (GL), and oak (OAK) honeys.
[i] Data represent mean values ± standard deviation. There is no significant difference between the results for all samples shown with the same superscript capital letter (A–M) in the same column (p≥0.05). There is no significant difference between the results shown with the same superscript lowercase letter (a–e) in the samples of the same honey type in the column (p≥0.05). TPC, total phenolic content; TFC, total flavonoid content; DPPH, DPPH• scavenging activity; ABTS, ABTS•+ scavenging activity; GAE, gallic acid equivalent; CE, catechin equivalent.
Considering DPPH• and ABTS•+ scavenging activity, the strongest antioxidant properties of oak honey have also been recognized by other authors [Kolayli et al., 2018; Smetanska et al., 2021]. It was also reported that TPC and/or TFC highly correlated with the antioxidant capacity of honeys [Becerril-Sánchez et al., 2021]. On the contrary, some studies showed that the antioxidant capacity might not only depend on phenolic compounds but also on organic acids, amino acids and proteins, and in this case, the correlation might be low or negative [Shamsudin et al., 2019]. At this point, in the current study, very high positive correlations (rTPC/DPPH=0.980, rTFC/DPPH=0.954, rTPC/ABTS=0.979, rTFC/ABTS=0.946, p<0.01, one-tailed) were determined between the TPC, TFC and the results of DPPH and ABTS assays of all honey samples. In turn, as seen in Table 4, ABTS assay results were higher than DPPH assay results. The difference observed might be due to the different antioxidant compounds in each sample, which react uniquely with the radicals used. It is common knowledge that each method has its own chemistry and execution, and accordingly, it can be concluded from the current study results that the ABTS radical cations, which enable the determination of the antioxidant characteristics of both hydrophilic and lipophilic compounds [Munteanu & Apetrei, 2021], respond more sensitively to the phytochemicals in the extracts of honey samples. In the meantime, while this study provides a comprehensive quality assessment based on various physicochemical and biochemical parameters, the inclusion of advanced chromatographic analyses in such studies could further enhance the scientific content. Therefore, it is crucial to include such analyses in future studies, as they provide a more precise quantitative profile of specific phenolic acids and flavonoids, providing deeper insights into the unique characteristics of these regional honeys.
CONCLUSIONS
This study investigated the diverse quality characteristics of three honey varieties – oak, garland thorn, and sunflower – sourced from the Kirklareli province in Türkiye. All samples were acceptable according to international regulatory standards. However, there were significant differences in the general physicochemical properties and biochemical characteristics of the samples. In particular, HMF and proline contents and diastase activity reflected the naturalness of the honeys and showed no signs of heat treatment. Oak honey samples were significantly darker in color and had a much higher content of phenolic compounds and, consequently, superior antioxidant activity compared to the blossom honeys. This finding underscored the importance of honeydew honeys, like oak honey, as a rich source of healthpromoting phytochemicals. Furthermore, the detailed analysis of garland thorn honey’s characteristics, along with its unique chemical profile, was a key contribution to the very limited literature available on its properties. By providing a comparative analysis of these three honey varieties, this study not only enriches the academic literature on honey quality but also serves as a crucial data source for beekeepers, researchers, and regulatory bodies, addressing a notable gap in the existing data for garland thorn and oak honeys. However, to confirm these findings on a broader scale, it is of great importance to expand the location and include larger sample sizes in future studies.