INTRODUCTION
Nowadays, with increasing knowledge about nutrition and growing health awareness, consumers pursuit foods that not only nourish but also provide additional health benefits. Enzymatic hydrolysis processes can contribute to the health-promoting properties of food proteins, which are one of the main nutrients in a well-balanced diet. Polypeptides and peptides with various biological activities are released during enzymatic hydrolysis of proteins, providing hydrolysates with, among others, antioxidant, antihypertensive, antidiabetic, immunomodulatory, and acetylcholinesterase and butyrylcholinesterase-inhibiting properties [Asen & Aluko, 2022; Liu et al., 2024; Malomo et al., 2020; Nguyen et al., 2024; Zhao et al., 2025]. The type and intensity of activity depend on the composition and amino acid sequence of the released peptides, their molecular weight and other physicochemical properties, e.g., hydrophobicity [Awosika & Aluko, 2019; Irankunda et al., 2025; Pownall et al., 2010]. All these characteristics are affected by the degree of hydrolysis (DH) defined as the ratio of the number of peptide bonds cleaved during hydrolysis to the total number of peptide bonds of a substrate [Adler-Nissen, 1986]. This parameter is commonly used in monitoring the progress of hydrolysis [Jamdar et al., 2010; Sulewska et al., 2022; Trigui et al., 2021] and easily controlled by modifying the hydrolysis conditions, i.e., the initial protein concentration, enzyme to substrate ratio, pH, temperature, and time [Karamać et al., 2002; Konieczny et al., 2020b; Suarez et al., 2021]. However, the maximum DH that can be achieved for a defined protein-enzyme system is determined by the protein structure (dependent on the protein source) and specificity of the enzyme used [Asen & Aluko, 2022; Sareen et al., 2023].
Pea (Pisum sativum L.) seeds can be considered among protein-rich sources. Costantini et al. [2021] found that the protein content of different pea accessions was in the range of 24.42–27.76 g/100 g of dry weight. Globulins are the major storage proteins found in pea (65–80% of the total proteins) [Owusu-Ansah & McCurdy, 1991]. They consist of legumin with a molecular weight (MW) of 360–400 kDa, vicilin (160–200 kDa), and convicilin (280 kDa). Albumins are the second most abundant protein fraction, accounting for 20–35% of pea proteins. Yang et al. [2021] reported that the ratio between these fractions in pea protein isolates was dependent on the extraction method used.
Pea proteins have been treated with various enzymes, including plant, animal, and microbial proteases, to obtain hydrolysates with antioxidant capacity [Aguilar et al., 2020; Asen & Aluko, 2022; Girgih et al., 2015; Irankunda et al., 2025; Pownall et al., 2010; Žilić et al., 2012]. Hydrolysis with these enzymes released polypeptides and peptides capable of scavenging free radicals, chelating pro-oxidant metal ions, and exhibiting reducing power [Asen & Aluko, 2022; El Hajj et al., 2023; Girgih et al., 2015; Pownall et al., 2011]. Inhibition of linoleic acid oxidation by pea protein hydrolysates has also been reported [Pownall et al., 2010, 2011]. Trypsin was one of the enzymes that effectively produced pea protein hydrolysates with antioxidant capacity [Asen & Aluko, 2022]. Tryptic hydrolysates had a similar hydroxy radical scavenging activity as hydrolysates obtained with pancreatin and chymotrypsin, but lower than proteins treated with Alcalase, Flavorzyme or pepsin [Asen & Aluko, 2022]. However, the antioxidant potential of trypsin-treated proteins at different degrees of hydrolysis has not been compared. Based on this background, this paper examines the influence of the DH on physicochemical parameters and antioxidant capacity of tryptic hydrolysates of a pea protein isolate. To this end, hydrolysates of a pea protein isolate at different DHs were obtained and assayed for molecular weight (MW) distribution, surface hydrophobicity, and antioxidant capacity by several methodologies. Finally, principal component analysis was carried out to visualize relationships between DH and their physicochemical and bioactive properties.
MATERIALS AND METHODS
Materials and chemicals
A pea protein isolate with the commercial name Propulse produced by NutriPea (Portage la Prairie, Manitoba, Canada) was acquired from Dutch Protein and Service (Tiel, Netherlands). Protein content of the isolate was 82.97 g/100 g of dry weight determined by the Kjeldahl method according to AOAC International standard no. 977.02-1977 [AOAC, 1990]. Trypsin (EC 3.4.21.4) with a supplier-declared activity of 1.120 BAEE U/mg was purchased from Sigma-Aldrich Chemical Company (St. Louis, MO, USA). Its activity, as determined by the Anson [1938] method using hemoglobin as the substrate, was 1.34 AU/g.
2,4,6-Trinitrosulfonic acid (TNBS), l-leucine, 8-anilino-1-naphthalenesulfonic acid (ANS), cis-parinaric acid (CPA), n-decane, butylhydroxytoluene (BHT), 2,2’-azino-bis(3-ethylbenzothiazoline-6-sulfonic acid) ammonium salt (ABTS), 6-hydroxy-2,5,7,8-tetramethylchroman-2-carboxylic acid (Trolox), β-carotene, linoleic acid, Tween 40, fluorescein, and 2,2’-azobis(2-methylpropionamidine) dihydrochloride (AAPH) were purchased from Sigma-Aldrich. Kits for determination of the antioxidant capacity of water-soluble and lipid-soluble compounds in the photochemiluminescence assay (PCL-ACW and PCL-ACL, respectively) and standards for size-exclusion chromatography were obtained from Analytik Jena (Jena, Germany) and Pharmacia Biotech (Uppsala, Sweden), respectively. Other solvents and reagents were provided by Avantor Performance Materials (Gliwice, Poland).
Production of pea protein hydrolysates at different degrees of hydrolysis
A vessel containing the pea protein isolate (30 g) suspended in 290 mL of distilled water was placed in a thermostatic water bath heated to 50°C [Karamać et al., 2002]. After adjusting the pH to 8.0 using 1 M NaOH solution, 10 mL of a trypsin solution in water (33.5 mg/mL) was added, which corresponded to an enzyme to substrate ratio (E/S) of 15 mAU/g isolate. During 120 min of hydrolysis, the mixture was stirred, and pH was maintained constant by adding 1 M NaOH solution from the burette. Based on the NaOH solution used, after 5, 10 min and then at 10-min intervals up to 120 min, the degree of hydrolysis (DH) was calculated using Equation (1) developed for the pH-stat method by Adler-Nissen [1986]:
where: B is the amount of base used during hydrolysis (mL), MB is the molarity of a base solution, α is the average degree of dissociation of –NH2 groups, MP is the mass of protein used for hydrolysis (g), and htot is the total number of peptide bonds in the substrate (meqv Leu-NH2/g protein).
The value of 1/α was determined experimentally based on the relationship between 1/α and the average pK for the α-amino groups liberated during hydrolysis described by Equation (2):
Using Equation (3), the pK was calculated after carrying out hydrolysis at two pH values (pH1=7.5 and pH2=8.0) and determining the regression coefficients (b1 and b2, respectively) for the linear relationships between the amount of base used during hydrolysis and the number of released α-amino groups. The latter were quantified by the method with TNBS, in which absorbance of the reaction mixture was measured at 340 nm using a DU 7500 Beckman spectrophotometer (Beckman Instruments, Brea, CA, USA), and the results were calculated based on the calibration curve plotted for l-leucine [Panasiuk et al., 1998].
The total number of peptide bonds in the pea protein isolate was determined with TNBS method [Panasiuk et al., 1998] after acid hydrolysis of 0.5 g of the isolate in 10 mL of 6 M HCl at 105°C for 12 h.
The hydrolysis was performed in triplicate and, based on mean DH in each hydrolysis time point, hydrolysis curve was plotted. To produce the hydrolysates, a series of hydrolyses were carried out under the same conditions of initial protein concentration of 10% (w/w), E/S of 15 mAU/ g, pH of 8.0, and temperature of 50°C. They were stopped after the time estimated based on the hydrolysis curve, necessary to produce hydrolysates at the DHs of 2%, 5%, 8%, and 12%. The enzyme was inactivated by heating the suspension at 75°C for 15 min. Then, the hydrolysates were neutralized with 1 M HCl solution and freeze-dried using Lyph Lock 6 system (Labconco, Kansas City, MO, USA).
Determination of molecular weight distribution of the pea protein isolate and hydrolysates
The pea protein isolate and hydrolysates were subjected to size-exclusion chromatography analyses using a fast protein liquid chromatography (FPLC) system (Pharmacia Biotech) with a Superdex 75 HR 10/30 column (a separation range of 3–70 kDa) or a Superdex Peptide HR 10/30 column (a separation range of 0.1–7.0 kDa); both from Pharmacia Biotech. The mobile phase was 0.1 M phosphate buffer, pH 7.0, and the flow rate was 0.5 mL/min for the former column and 0.7 mL/min for the latter. UV detection was used at a wavelength of 214 nm. Samples (25 mg) were dissolved in an eluent, centrifuged at 14,000×g for 10 min, filtered through a 0.22 μm nylon membrane filter, and injected onto the column (200 μL). The MWs of proteins, polypeptides, and peptides in the samples were estimated based on standards. The Superdex 75 column was calibrated using ribonuclease A, chymotrypsin, ovalbumin, and porcine albumin with MWs of 13.7, 25.0, 43.0, and 67.0 kDa, respectively. The Superdex Peptide column was calibrated using aprotinin with a MW of 6.5 kDa, and synthetic peptides with MWs of 0.89, 2.22, and 8.00 Da. From the chromatograms, areas under curves for MW ranges of >53, 29–53, 9–29, and <9 kDa (Superdex 75 column) and >9, 8–9, 7–8, 4–7, 2–4, and <2 kDa (Superdex Peptide column) were calculated, and relative content of molecules within the defined MW range was expressed as the percentage of total area. Data were processed using FPLC Director software, version 1.03 (Pharmacia Biotech).
Determination of surface hydrophobicity of the pea protein isolate and hydrolysates
The surface hydrophobicity of the pea protein isolate and hydrolysates was determined using fluorimetric assays with ANS and CPA [Avramenko et al., 2013; Kato & Nakai, 1980]. The isolate and hydrolysates (40 mg) were dissolved in 100 mL of 0.01 M phosphate buffer, pH 7.0, and then diluted to obtain finally eight solutions with concentrations of 5–40 mg/100 mL. In the ANS assay, 2 mL of each solution was mixed with 10 μL of 8.0 mM ANS solution in 0.01 M phosphate buffer, pH 7.0. Fluorescence intensity was measured against a blank without ANS at an excitation wavelength of 390 nm and an emission wavelength of 470 nm. The measurements were performed using an SFM-25 spectrofluorometer (Kontron Instruments, Ismaning, Germany), which was calibrated with an ANS solution in methanol (at the same concentration as in the test samples). In the CPA assay, 10 μL of 3.6 mM CPA solution in absolute ethanol with an equimolar amount of BHT was added to 2 mL of the sample solution. The fluorescence intensity was measured at an excitation and emission wavelengths of 325 and 420 nm, respectively, and a CPA solution in n-decane was used for calibration of an SFM 25 spectrofluorometer. The surface hydrophobicity was expressed as the initial slope of the curves plotted between fluorescence intensity and protein concentration.
Determination of antioxidant capacity of the pea protein isolate and hydrolysates
ABTS radical cation scavenging capacity
In the ABTS assay, ABTS•+ was generated, and a stock solution was diluted exactly as in the original method [Re et al., 1999]. Then, 2 mL of the diluted ABTS•+ solution was vigorously mixed with 20 μL of the isolate or a hydrolysate solution obtained by dissolving it in 0.1 M sodium phosphate buffer (pH 7.0) to a concentration of 20 mg/mL. The reaction mixture was incubated at 30°C for 6 min, and the absorbance was measured at a wavelength of 734 nm. The standard curve for Trolox was plotted (0.2–2.0 μmol/mL, r=0.999), and results were expressed as mmol of Trolox equivalent per g of isolate or hydrolysate.
Oxygen radical absorbance capacity
Oxygen radical absorbance capacity (ORACFL) of the pea protein isolate and hydrolysates was determined according to the procedure described previously by Dávalos et al. [2004]. Aliquots of 20 μL of the sample solution in 75 mM phosphate buffer (pH 7.4) were pipetted into a 96-well microplate, and 120 μL of a fluorescein solution in the same buffer (70 nM, final concentration in the reaction mixture) were added. After vigorously mixing, the microplate was heated at 37°C for 15 min, and then 60 μL of an AAPH solution (12 mM, final concertation) were added to the reaction mixture, which was further incubated at 37°C. Fluorescence measurements were performed at 1-min intervals for 80 min at excitation and emission wavelengths of 485 nm and 520 nm, respectively, using a Polarstar Galaxy plate reader (BMG Labtechnologies GmbH, Offenburg, Germany). Blank samples with 75 mM phosphate buffer (pH 7.4) instead of the isolate/hydrolysate solution were processed in parallel, as well as samples with Trolox solutions (final concertation in the range of 1–8 μM) as a reference, to plot the standard curve. The raw data were calculated exactly as in the previous study [Dávalos et al., 2004], and ORACFL values were expressed as mmol of Trolox equivalent per g of isolate or hydrolysate.
Antioxidant capacity in the photochemiluminescence assays
The antioxidant capacity of water-soluble compounds (ACW) and lipid-soluble compounds (ACL) in the photochemiluminescence (PCL) assays, in which antioxidants scavenge superoxide anion radicals (O2•−) generated from luminol, was determined according to the protocol provided by the manufacturer of the PCL-ACW and PCL-ACL kits, using a Photochem device (Analytik Jena). Briefly, for PCL-ACW determination, the isolate or hydrolysate dissolved in water (10 mg/mL) was mixed with the buffer solution (pH 10.5) and luminol solution. The lag time of luminescence was measured and compared to that of the blank. Reaction mixtures with l-ascorbic acid (10–150 μM) were used to plot a standard curve. Results were expressed as μmol of l-ascorbic acid equivalent per g of isolate or hydrolysate. For PCL-ACL evaluation, the solution of isolate or hydrolysate in methanol (10 mg/mL) was properly diluted with methanol and vortexed with luminol and buffer solution. The reaction was carried out for 3 min during which the luminescence signal was measured. The integral under the signal curve was calculated, and results were expressed as μmol of Trolox equivalent per g of isolate or hydrolysate based on the standard curve plotted for Trolox (50–300 μM).
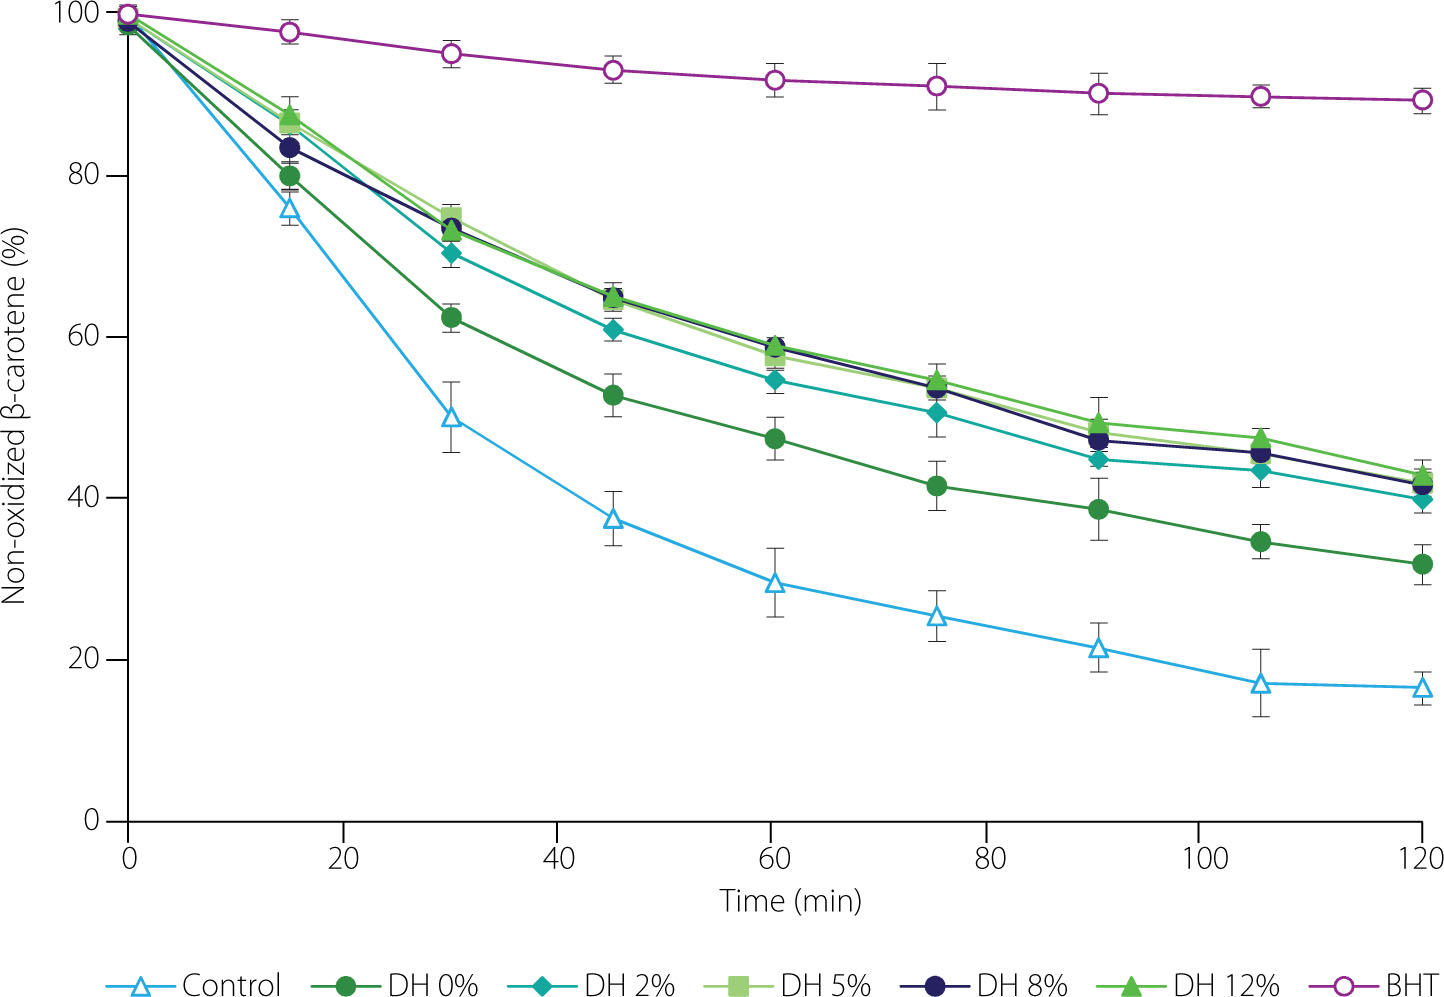
Inhibition of β-carotene-linoleic acid emulsion oxidation
The inhibition of β-carotene-linoleic acid emulsion oxidation by the isolate and hydrolysates was determined according to Karamać [2009], with slight modifications. To prepare the emulsion, the emulsifier (Tween 40, 400 mg) and linoleic acid (40 mg) were vortexed with a solution of β-carotene (5 mg) in chloroform (5 mL), then the chloroform was removed under nitrogen, and methanol (10 mL) and water (80 mL) were added to the residue successively. The isolate and hydrolysates were dissolved in a 1% (w/v) sodium dodecyl sulfate (SDS) solution (25 mg/mL), and portions of 200 μL were mixed with 2.5 mL of the emulsion. Oxidation was performed at 50°C in dark, and absorbance was read at 470 nm for 120 min at 15-min intervals. In parallel, emulsion with a BHT solution (200 μL, 0.5 mg/mL) and control with an SDS solution instead of antioxidants were incubated. For each time point, the percentage of non-oxidized β-carotene was calculated, and then time-dependent curves were plotted.
Statistical analysis
Three batches of pea protein hydrolysates at a defined DH were prepared. Each analysis was performed in triplicate. Results were expressed as mean and standard deviation. One-way analysis of variance with Tukey’s post hoc test was performed using GraphPad Prism software (version 6.04, GraphPad Software, Boston, MA, USA) to show significant differences (p<0.05) between the isolate and hydrolysates at the different DHs. Moreover, data were subjected to principal component analysis using Statistica 14.1.0.4 software (Cloud Software Group, Inc., Palo Alto, CA, USA).
RESULTS AND DISCUSSION
Degree of hydrolysis
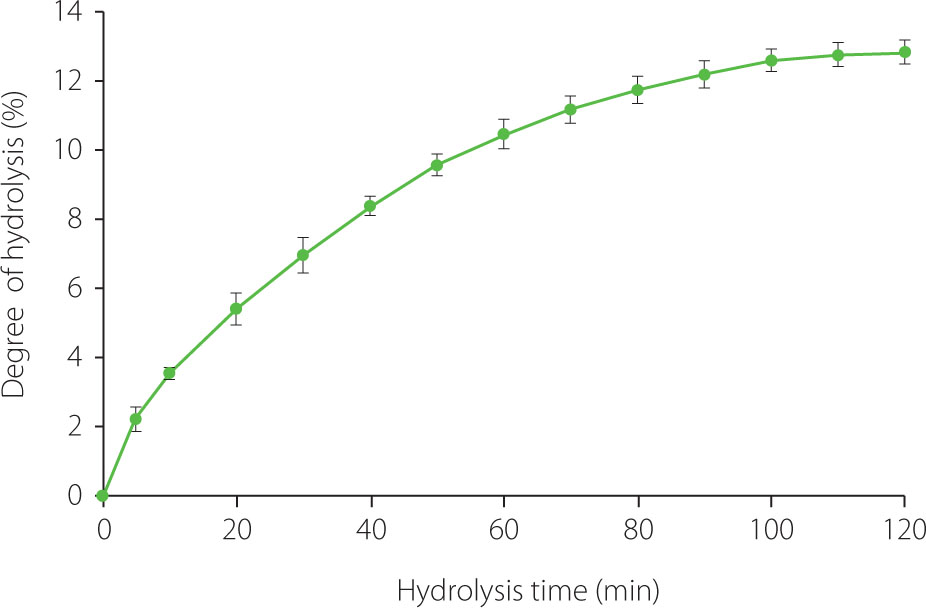
The hydrolysis curve of the pea protein isolate (Propulse) with trypsin is shown in Figure 1. The reaction rate was very high for the first 15 min, then it gradually slowed down, and from 100 min the DH increased insignificantly. In summary, trypsin hydrolyzed pea proteins at 50°C, an E/S of 15 mAU/g for 120 min to a DH of 12.84%. As our previous study showed, these conditions were optimal for processing Propulse with this enzyme; DH at temperatures of 35–45°C reached lower values than at 50°C, and an E/S of 15–35 mAU/g had no significant effect on DH after 60 min of the hydrolysis [Karamać et al., 2002]. The final DH was similar to that reported by Asen & Aluko [2022] for a pea protein concentrate hydrolyzed with trypsin (~12%) and even higher than the values shown by García Arteaga et al. [2020, 2022], who hydrolyzed a pea protein isolate (6.86–7.59%). In turn, Sareen et al. [2023] and Konieczny et al. [2020b] obtained tryptic hydrolysates of a pea protein isolate and pea flour with enriched protein content, respectively, at a DH of 10%. Generally, the use of trypsin allows obtaining pea protein hydrolysates at relatively low DH, most likely due to its high substrate specificity. This serine endopeptidase only cleaves peptide bonds at the carboxyl side of basic amino acid, including arginine and lysine [Vajda & Szabó, 1976]. As shown in a previous study, pancreatin and Alcalase, both with broad specificity, hydrolyzed a pea protein concentrate to a 5-fold higher DH than trypsin, whereas the use of chymotrypsin, pepsin, and Flavourzyme allowed for 2.5–3.5-fold higher DH [Asen & Aluko, 2022]. Trypsin was found to be less effective in hydrolyzing a pea protein isolate than the bacterial alkaline endopeptidases such as Savinase, Alcalase, and Esperase [García Arteaga et al., 2020]. Zhao et al. [2025] hydrolyzed pea proteins with papain, Protamex, Alcalase, Neutrase, acid protease, and PaproA and reported the DH in the range of 12.80–18.89%. Another reason for the relatively low DH of tryptic hydrolysis of the pea protein isolate obtained in this study and confirming previous literature findings may be the presence of protease inhibitors in the substrate. Konieczny et al. [2020b] reported that the trypsin inhibitor activity of untreated air-classified pea protein enriched flour was 38.35 TIU/mg and this value decreased in tryptic hydrolysates to 11.00–11.95 TIU/mg, regardless of DH. Sareen et al. [2023] presumed that the high trypsin inhibitor activity of pea protein isolate prevented the production of tryptic hydrolysate at a DH higher than 10%, which was possible for faba bean protein isolate (DH was twice as high). It should also be noted that methodological aspects may determine the DH value. Determination of DH by the pH-stat method and methods based on spectrophotometric evaluation of –NH2 groups released during hydrolysis, generally, yields lower results than DH estimated based on the nitrogen content in the hydrolysate (after precipitation of unhydrolyzed protein with a trichloroacetic acid solution) relative to the nitrogen content in the substrate [Wróblewska & Karamać, 2003]. This is likely why the DH of the tryptic hydrolysate of protein isolated from pea seed waste determined by the latter method reached as much as 28.7% [Mahgoub et al., 2025].
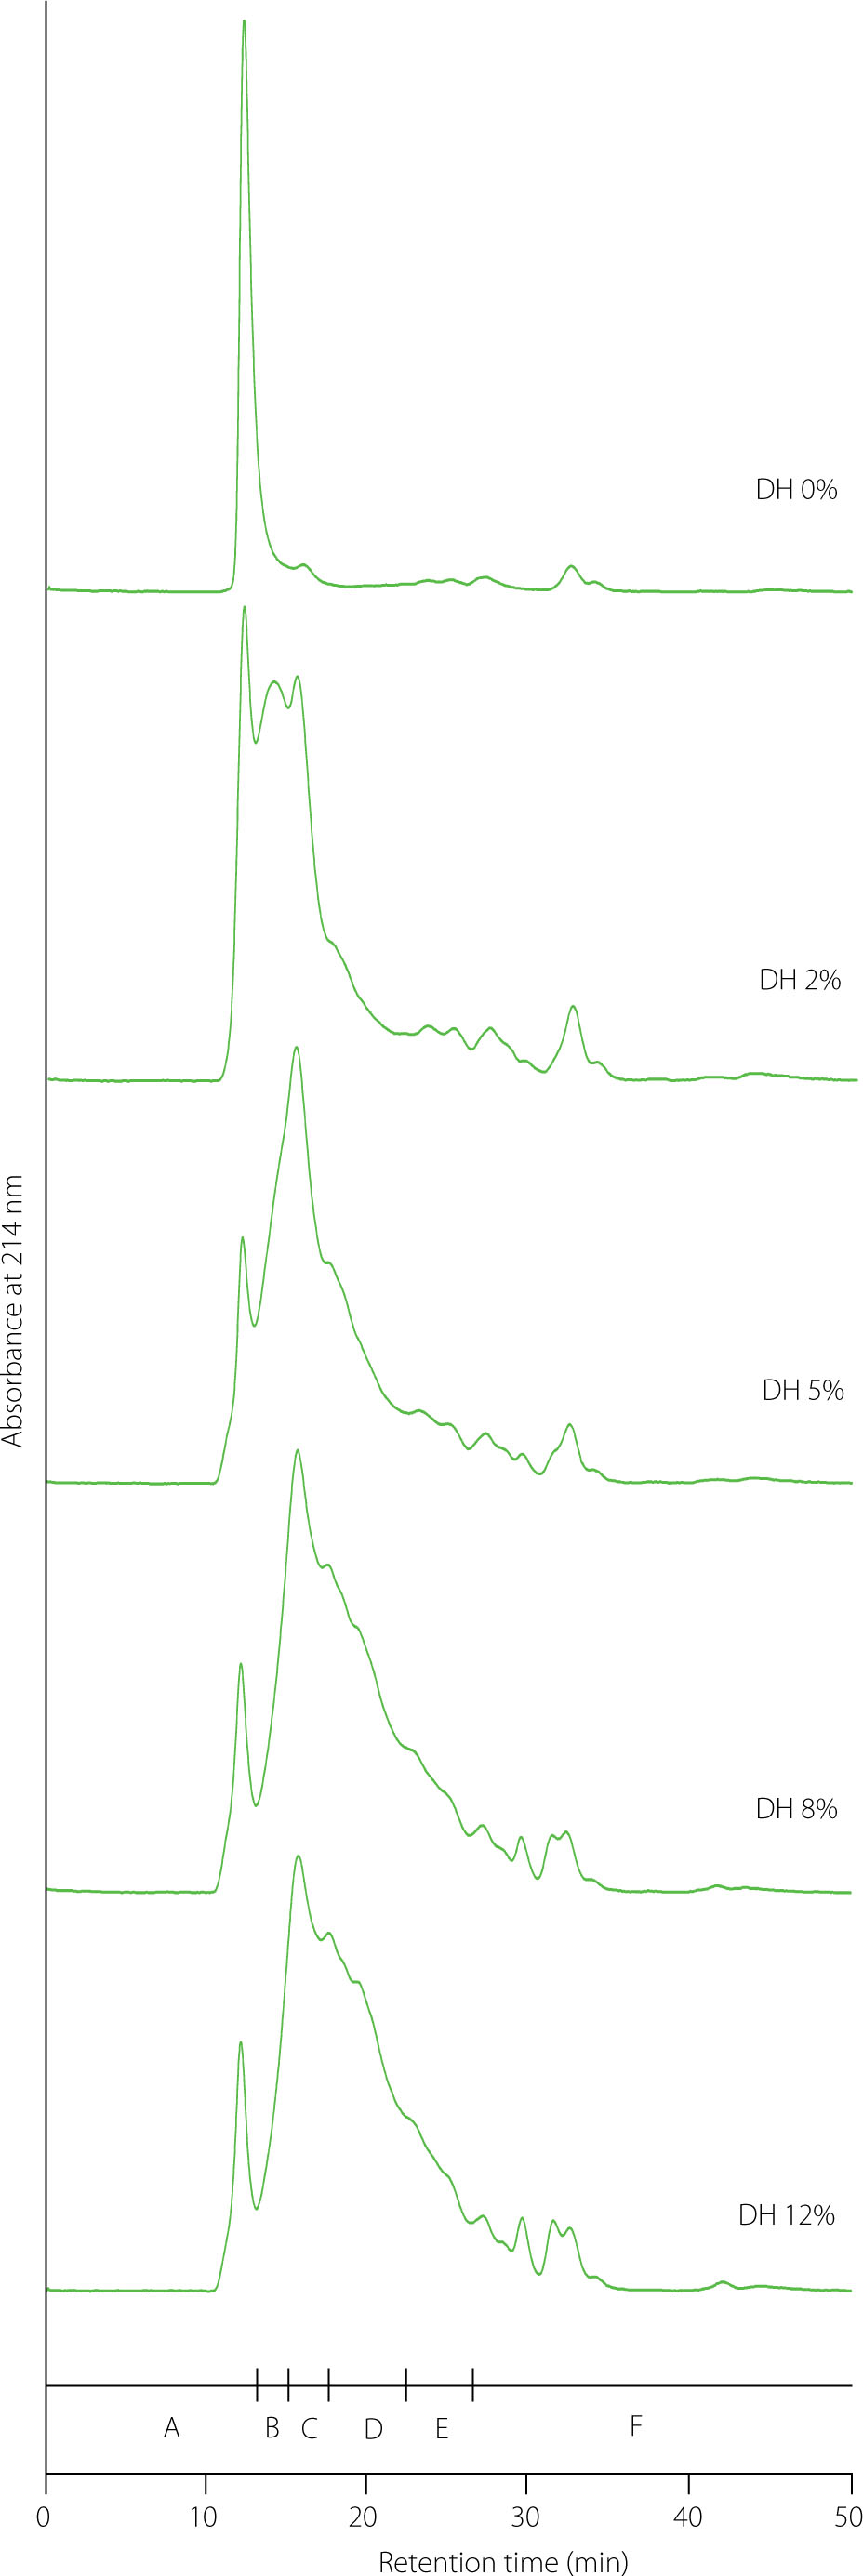
Molecular weight distribution
Due to the broad range of MWs of proteins, polypeptides, and peptides in the pea protein isolate and hydrolysates, their distributions were determined using two size exclusion chromatography columns, Superdex 75 and Superdex Peptide, differing in the range of separated MWs (3–70 and 0.1–7.0 kDa, respectively). FPLC chromatograms of the pea protein isolate and hydrolysates at different DHs on these two columns are shown in Figures 2 and 3, respectively, and the relative content of molecules with defined MWs is summarized in Tables 1 and 2, respectively. The separation of the pea protein isolate on a Superdex 75 column showed one dominant peak with a retention time of 16.8 min and only small peaks with slightly greater retention times to 23.1 min (Figure 2). Proteins with MWs higher than 53 kDa were responsible for the main peak. The other peaks corresponded to MWs of 29–53 kDa. The relative abundance of these two fractions in the pea protein isolate was 59.61% and 21.51%, respectively (Table 1). Pea globulins such as legumin (453 kDa), vicilin (138 kDa), and convicilin (248 kDa), as well as legumin and convicilin subunits, all with MWs higher than 60 kDa [Sarigiannidou et al., 2022; Yang et al., 2021], were likely eluted in the first peak. In turn, MWs of 29–53 kDa could be attributed to fractions of various globulins, especially vicilin subunits, but also to pea albumins and trypsin inhibitors [Klost & Drusch, 2019; Sarigiannidou et al., 2022; Yang et al., 2021]. As expected, the relative content of these proteins successively decreased in the hydrolysates at increasing DH, with the share of the fraction with MWs >53 kDa decreasing much faster than that of the fraction with MWs of 29–53 kDa (in the hydrolysate at DH of 5%, the share of the former was only 9.36%). However, it should be noted that even the hydrolysate at the highest DH still possessed proteins with MWs greater than 53 kDa. This finding was consistent with the literature data for tryptic hydrolysates of pea proteins [Sarigiannidou et al., 2022; Yang et al., 2021]. The resistance of pea legumin-T (260 kDa) to hydrolysis by trypsin has already been reported [Schwenke et al., 2001].
Table 1
Relative content (%) of proteins and polypeptides with defined molecular weight ranges in pea protein isolate (degree of hydrolysis, DH, 0%) and its tryptic hydrolysates (DH 2–12%) determined by size-exclusion chromatography using a Superdex 75 column.
Table 2
Relative content (%) of polypeptides and peptides with defined molecular weight ranges in pea protein isolate (degree of hydrolysis, DH, 0%) and its tryptic hydrolysates (DH 2–12%) determined by size-exclusion chromatography using a Superdex Peptide column.
Figure 2
Size-exclusion chromatography separation of pea protein isolate (degree of hydrolysis, DH, 0%) and its tryptic hydrolysates (DH 2–12%) using a Superdex 75 column. Letters A, B, C, and D above x-axis indicate molecular weight ranges of >53, 29–53, 9–29, and <9 kDa, respectively.
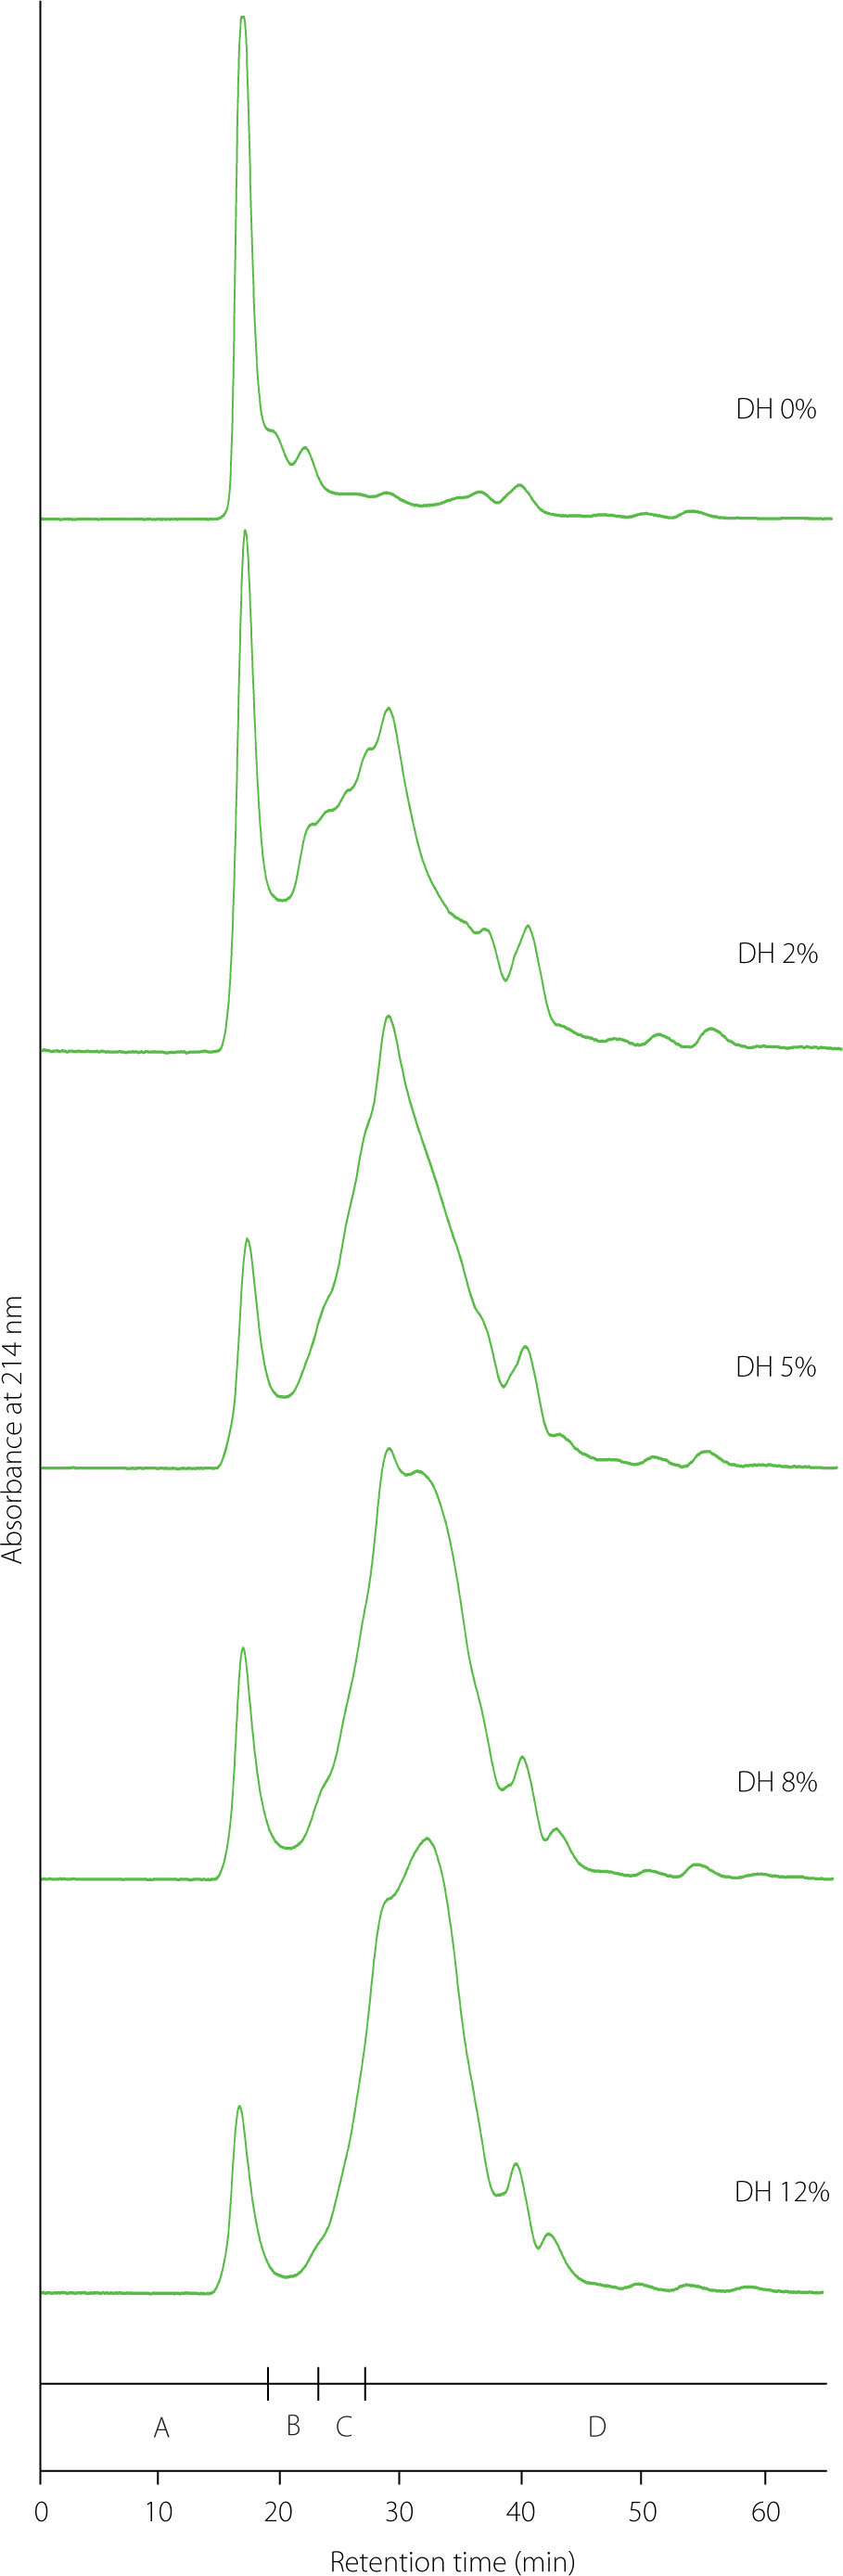
Hydrolysis products with MWs of 9–29 kDa constituted approximately 19–20% in the hydrolysates at the DH of 2% and 5%, and significantly (p<0.05) less in those at the DH of 8% (14.78%) and 12% (11.37%) (Table 1). The contribution of products with MWs <9 kDa increased much more during hydrolysis, from 43.25% (DH 2%) to 80.05% (DH 12%). Among these products, the fraction with MWs in the range of 8–9 kDa dominated in the hydrolysate at a DH of 2% and accounted for 27.52% (Figure 3, Table 2). The hydrolysate at a DH of 5% contained mainly products with MWs of 7–8 kDa (24.83%), although fractions with MWs of 8–9 kDa and 4–7 kDa were also abundant (22.57% and 23.11%, respectively). In the hydrolysate at a DH of 8%, the main fraction comprised products with MWs of 4–7 kDa (33.54%), followed by those with MWs of 7–8 kDa (24.29%). The hydrolysate at a DH of 12% also contained peptides from these two fractions as dominant, with the contribution of peptides with MWs of 4–7 kDa being significantly (p<0.05) higher than in the hydrolysate at a DH of 8%. Although the fraction with MWs of 2–4 kDa in hydrolysates increased significantly (p<0.05) with the DH, its contribution was not high and ranged from 6.73% (DH 2%) to 11.74% (DH 12%). Peptides with MWs <2 kDa also occurred at a low level of 7.50–9.42%, and their share did not differ significantly (p≥0.05) in the hydrolysates at the DH of 5–12%. In summary, the hydrolysates contained polypeptides and peptides with a very broad range of MWs, varying depending on the DH, and the contribution of those with MW below 2 kDa was relatively low. The broad range of molecular weights of the products released from pea proteins by trypsin is consistent with literature data [Klost & Drusch, 2019; Sarigiannidou et al., 2022]. By size-exclusion chromatography, Sarigiannidou et al. [2022] showed that limited hydrolysis of a pea protein isolate with trypsin (DH 4%) yielded mainly products with MWs between 2 and 30 kDa. In turn, Sareen et al. [2023], using capillary gel electrophoresis, found that although the fraction with MWs below 15 kDa predominated in tryptic pea protein hydrolysates at the DHs of 5% and 10%, products with MWs of 15–30 Da also accounted for a considerable portion, particularly in the hydrolysate at the lower DH. Moreover, Awosika & Aluko [2019] demonstrated that the yield of fractions of tryptic hydrolysates of a pea protein concentrate with MW >10 kDa was higher, and that of fractions with peptides (1–3 and 3–5 kDa) was lower compared to the hydrolysates obtained using other alkaline proteases, i.e., Alcalase and chymotrypsin.
Surface hydrophobicity
The ANS and CPA assays were performed to determine surface hydrophobicity of the pea protein isolate and its tryptic hydrolysates. The results are shown in Figure 4. In both assays, the pea protein isolate showed the lowest surface hydrophobicity, 101 and 222, respectively. These values initially increased with increasing DH, and after reaching the maximum, ultimately declined. However, even the lowest values of 141 (ANS assay) and 416 (CPA assay) for the hydrolysate at a DH of 12% were significantly (p<0.05) higher than those determined for the pea protein isolate. The highest surface hydrophobicity of 557 was achieved at a DH of 5% in the CPA assay. In the ANS assay, the highest values of 196–212 were found for hydrolysates at the DH of 2% and 5%, which did not differ significantly from each other (p≥0.05). In previous studies, the surface hydrophobicity of the pea protein isolate in this assay was within the range of 59.69–115.1 [Sareen et al., 2023; Shay et al., 2023; Tang et al., 2023]. Its initial increase following treatment with trypsin likely resulted from the unfolding of the protein structure and exposure of hydrophobic sites originally located within the molecule [Jung et al., 2005; Tang et al., 2023]. Avramenko et al. [2013] postulated that this protein structure unfolding and resulting increase in hydrophobicity may be due not only to hydrolysis but also to substrate heating, and that it is difficult to estimate the contribution of both processes. Peng et al. [2016] and Sareen et al. [2023] analyzed pea protein isolates before and after heating (85–90°C, 30 min) and reported up to 2-fold higher hydrophobicity of the processed proteins. Since in our study the isolate was not preheated, it seems that heating during hydrolysis could affect the surface hydrophobicity at the initial stage of the process. The reduction in surface hydrophobicity following further hydrolysis may be linked to the cleavage of hydrophobic bonds within the hydrophobic regions and their breakdown, or to the increased hydrophobic interactions between these regions, leading to protein aggregation, confining most hydrophobic bonds to the interior of the aggregates and thus reducing the number or area of hydrophobic groups on the surface [Jung et al., 2005; Shuai et al., 2022; Xu et al., 2016]. A similar trend in the hydrophobicity of a trypsin-hydrolyzed pea protein isolate was observed by Shuai et al. [2022], although they determined its maximum value at a lower DH of 2%. In turn, Sareen et al. [2023] reported an increase in the surface hydrophobicity of the tryptic hydrolysates compared to the pea protein isolate, but differences between hydrolysates at the different DHs (5% and 10%) were not observed, while Konieczny et al. [2020a] found a continuous increase for trypsin-hydrolyzed pea flour at DH up to 10%. It should be noted, however, that changes in surface hydrophobicity following enzymatic hydrolysis depend not only on DH, but also on the type of enzyme and protein. During hydrolysis of pea protein with Alcalase, Flavourzyme, and Neutrase, no initial increase was observed, and in fact, a decrease was found [Shay et al., 2023; Shuai et al., 2022]. Also, the use of trypsin for hydrolysis of proteins other than pea proteins resulted in a different trend in changes in surface hydrophobicity, e.g., a successive increase with increasing DH was reported for a faba bean protein isolate [Sareen et al., 2023], and an initial decrease for a lentil protein isolate [Avramenko et al., 2013].
Figure 4
Surface hydrophobicity of pea protein isolate (degree of hydrolysis, DH, 0%) and its tryptic hydrolysates (DH 2–12%) determined by the assay with 8-anilino-1-naphthalenesulfonic acid, ANS (A) and cis-parinaric acid, CPA (B). Different letters above bars indicate significant differences (p<0.05).
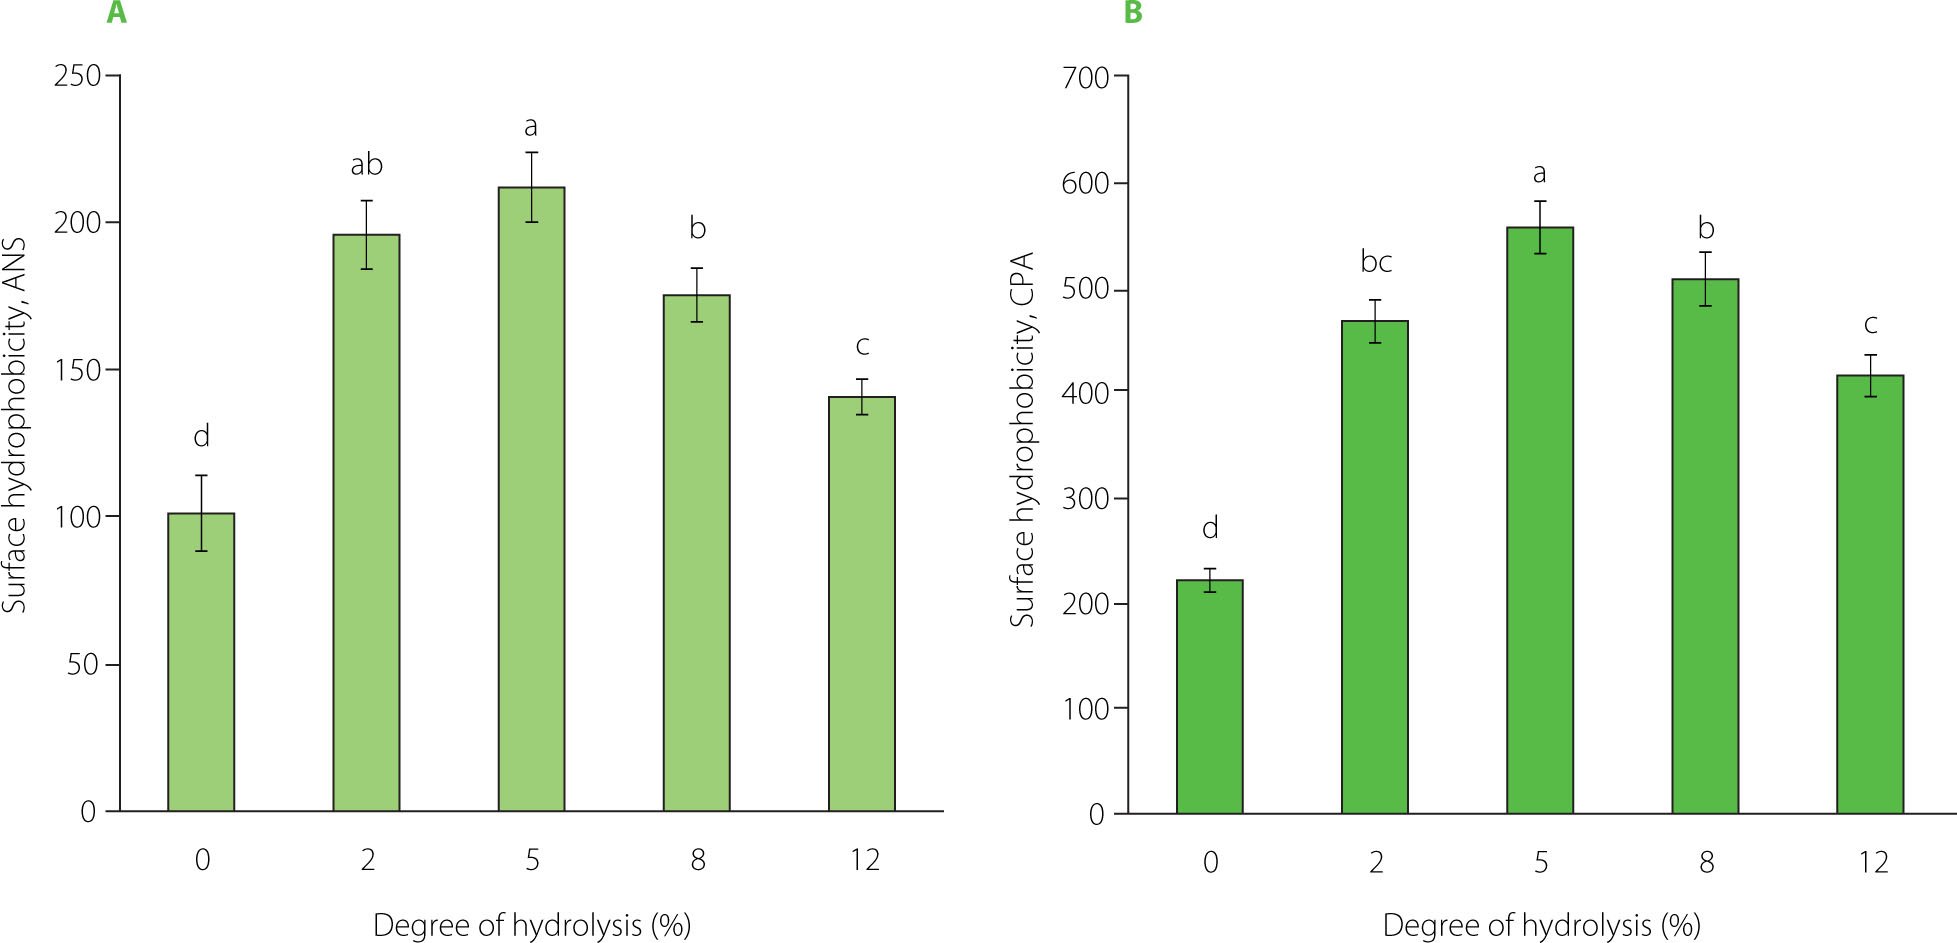
The surface hydrophobicity of the isolate and the individual hydrolysates determined by the ANS assay was lower than that shown by the CPA assay (Figure 4). The reason may be the specificity of the fluorescent probes. Although the reagents of both assays are anionic probes, ANS has an aromatic structure and CPA contains an aliphatic hydrocarbon chain; therefore, their binding sites on the protein may be different and, thus, may affect the measured protein hydrophobicity value [Alizadeh-Pasdar & Li-Chan, 2000]. Our study results indicated that the protein binding sites interacted more readily with aliphatic CPA than with aromatic ANS under assay conditions (pH 7.0). Alizadeh-Pasdar & Li-Chan [2000], who compared the surface hydrophobicity of a few proteins measured in both assays, showed that native β-lactoglobulin had higher hydrophobicity in the CPA assay than in the ANS assay (both performed at pH 7.0), but native and heated bovine serum albumin showed higher values in the ANS than in the CPA assay. Noteworthy is, however, that these differences varied depending on pH, and the authors concluded that the hydrophobicity was influenced not only by the structure of the fluorescent probe but also by electrostatic interactions in the measurements.
Antioxidant capacity
The antioxidant capacity of the pea protein isolate and hydrolysates at different DHs, evaluated as ABTS•+ scavenging capacity, oxygen radical absorbance capacity, and antioxidant capacity of water-soluble and lipid-soluble compounds in the PCL assays, is shown in Table 3. Moreover, the ability of the isolate and hydrolysates to inhibit the oxidation of β-carotene-linoleic acid model emulsion was determined, and results are presented in Figure 5. The ABTS•+ scavenging capacity ranged from 0.023 to 0.111 mmol Trolox/g. A slightly broader range of values was obtained for ORACFL – from 0.044 to 0.320 mmol Trolox/g. In both assays, the pea protein isolate showed the lowest (p<0.05) antioxidant capacity, which gradually increased after trypsin treatment with increasing DH. An increase in the antiradical capacity of legume protein hydrolysates with DH in ABTS and ORACFL assays has been reported in the literature [Gómez et al., 2021; Karamać et al., 2014]. This phenomenon has been linked with an increase in the number of low MW peptides as protein hydrolysis progresses [Irankunda et al., 2025]. However, there are also reports of a higher ABTS•+ scavenging capacity and ORACFL of hydrolysates containing products with intermediate MWs or a broad spectrum of MWs compared to the hydrolysates rich in small-size peptides [Suarez et al., 2021; Sulewska et al., 2022]. Therefore, such relationships should be considered for hydrolyses obtained in defined enzyme-substrate systems. The result of the ABTS assay achieved for the pea protein isolate in our study was similar to those reported by Žilić et al. [2012] (24.98–33.84 mmol Trolox/kg of dry weight), although, unlike hydrolysis with trypsin, the cited authors did not find an improvement in ABTS•+ scavenging capacity after 15 and 30 min of papain treatment. In turn, the ORACFL of the hydrolysate at the highest DH in our study was lower than the values of 537.84 and 502–704.15 μmol Trolox/g obtained when Bacillus licheniformis LBA 46 proteases and Alcalase, respectively, were used to release peptides from pea proteins [Aguilar et al., 2020; Girgih et al., 2015].
Table 3
Antioxidant capacity of pea protein isolate (degree of hydrolysis, DH, 0%) and its tryptic hydrolysates (DH 2–12%).
[i] Results are shown as mean ± standard deviation (n=3). Different superscript letters in a column indicate significant differences (p<0.05). DH, degree of hydrolysis; ABTS assay, assay with 2,2’-azino-bis(3-ethylbenzothiazoline-6-sulfonic acid) radical cation; ORACFL, oxygen radical absorbance capacity; PCL-ACW, antioxidant capacity of water-soluble compounds in the photochemiluminescence assay; PCL-ACL, antioxidant capacity of lipid-soluble compounds in the photochemiluminescence assay.
Figure 5
Inhibition of the β-carotene-linoleic acid emulsion oxidation by pea protein isolate (degree of hydrolysis, DH, 0%), its tryptic hydrolysates (DH 2–12%), and butylhydroxytoluene (BHT); Control, emulsion without antioxidants.
The antioxidant capacity of water-soluble compounds of the pea protein isolate and its hydrolysates in the PCL assay did not differ significantly (p≥0.05) (Table 3). No significant (p≥0.05) differences were also found between the hydrolysates at different DHs (0.927–0.942 μmol l-ascorbic acid/g). This lack of differences may be due to the specificity of the PCL-ACW assay. Our previous study on the antioxidant capacity of lentil flour hydrolysates prepared with pancreatin also showed no significant differences in PCL-ACW depending on DH [Sulewska et al., 2022]. In turn, the PCL-ACL of the pea protein isolate (1.99 μmol Trolox/g), was significantly (p<0.05) lower than that of hydrolysates, among which the highest values were found for those at the DH of 5% (3.68 μmol Trolox/g) and DH of 8% (3.32 μmol Trolox/g) (Table 3). Thus, the pattern of changes in PCL-ACL with DH differed from the trend of changes in ABTS•+ scavenging capacity and ORACFL, which may be due to different properties of the hydrolysis products that influence their ability to scavenge O2•− in the PCL-ACL assay compared to other radicals in the other assays. Literature data have shown that, in addition to the MWs of the peptides, their hydrophobicity also plays an important role in their ability to scavenge some radicals [Noman et al., 2022; Pownall et al., 2010]. Pownall et al. [2010], who hydrolyzed a pea protein isolate with Thermolysin, reported that more hydrophobic fractions had higher O2•− scavenging activity, but the presence of hydrophobic amino acids did not contribute to the reducing power of the peptides.
Model emulsion oxidation was inhibited by both the pea protein isolate and hydrolysates, but again, the proteins were less effective than the trypsin-treated products (Figure 5). A significantly lower percentage of non-oxidized carotene was determined for the emulsion with the protein isolate from 30 to 120 min of oxidation. Among the hydrolysates, the one at the lowest DH showed a slightly lower ability to inhibit β-carotene-linoleic acid emulsion than the others in the middle of oxidation, but after 120 min, no significant (p≥0.05) differences were observed between any of them. Trigui et al. [2021] also showed lower ability of a black cumin seed protein isolate in inhibiting oxidation of a model emulsion compared to its hydrolysates prepared with Savinase at increasing DH. On the other hand, Jamdar et al. [2010] reported higher antioxidant activity of peanut protein hydrolysates obtained using Alcalase at low DH (up to 10%), but lower activity during emulsion oxidation for hydrolysates at DH of 30% and 40% compared to protein isolate.
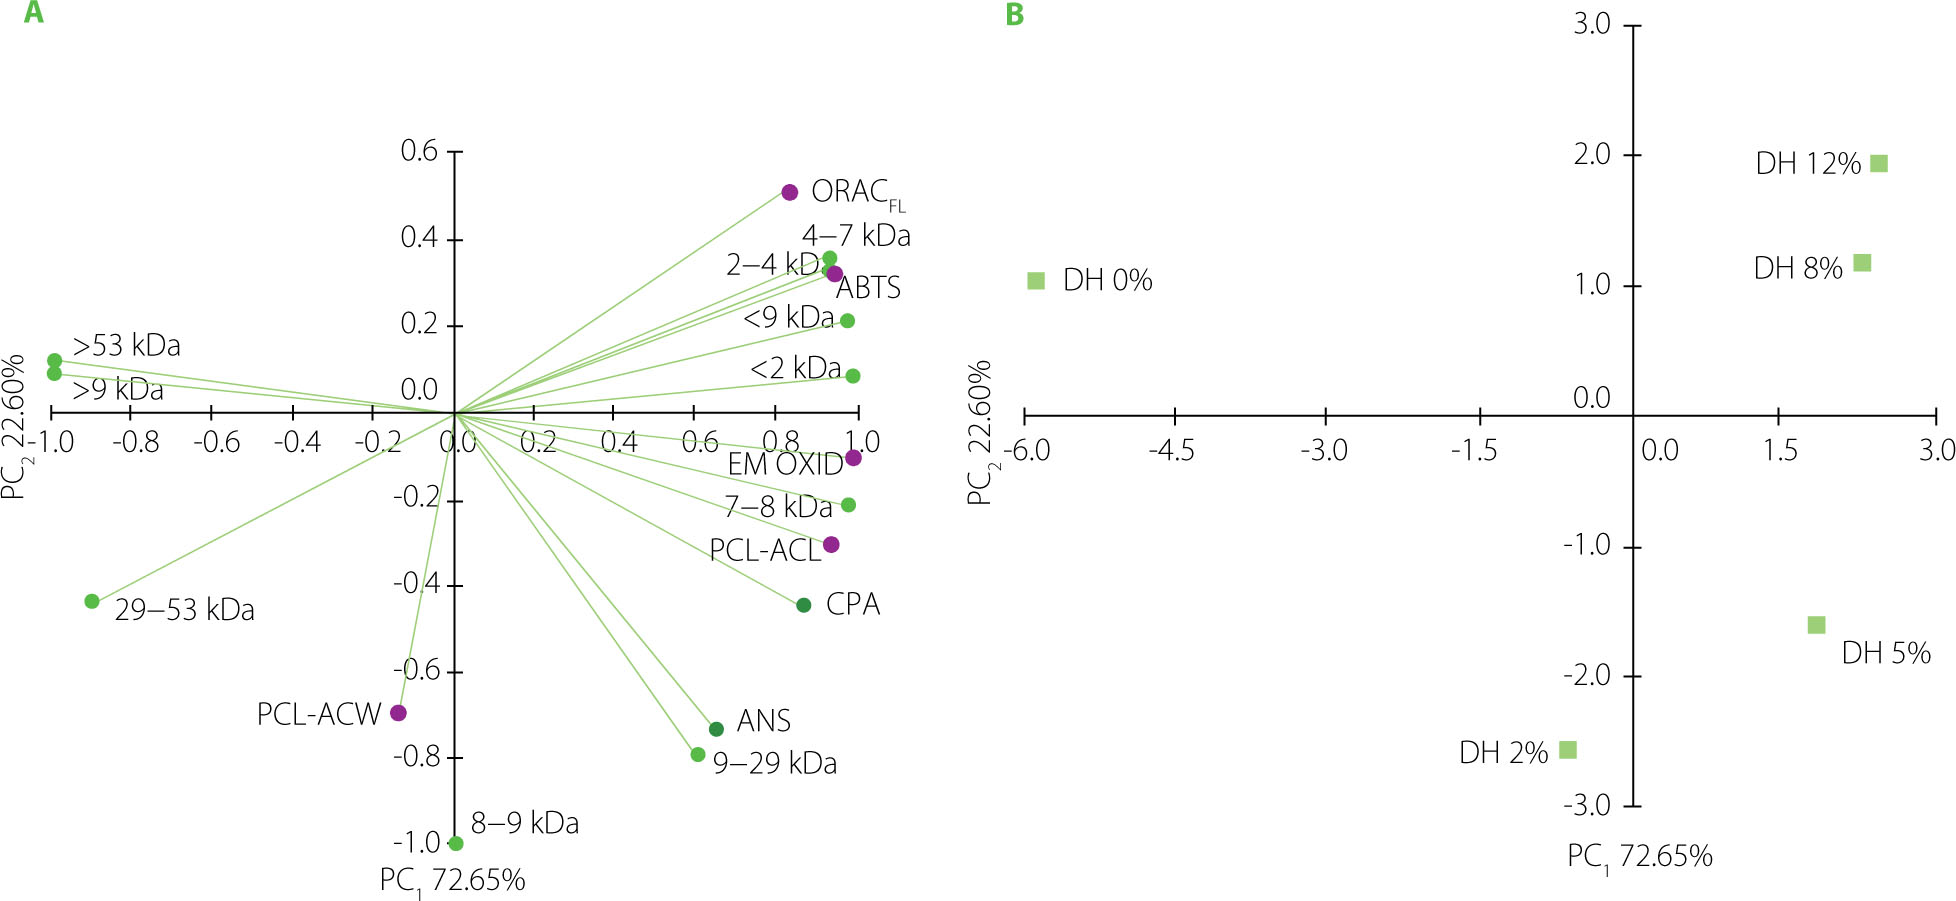
Relationship between physicochemical properties and antioxidant capacity
A data set of physicochemical parameters and antioxidant capacity of the pea protein isolate and its hydrolysates was subjected to PCA to uncover any patterns between the characteristics. The PCA plots are shown in Figure 6. The two first principal components (PC1 and PC2) explained 95.25% of the total variance. The isolate was clearly distinguished from all hydrolysates (Figure 6B). Furthermore, there was discrimination along PC2 between hydrolysates at higher DHs (8% and 12%) and hydrolysates at lower ones (2% and 5%). As expected, the former were associated with fractions with low MWs (<2 kDa, 2–4 kDa and 4–7 kDa) (Figure 6A). These fractions were closely related to antioxidant capacity measured by ABTS and ORACFL assays, confirming our assumption that peptide size primarily affects ORACFL and ABTS•+ scavenging capacity of tryptic pea protein hydrolysates. In turn, fractions with higher MWs (7–8 kDa and 9–29 kDa) were clustered with surface hydrophobicity. These variables were also closely correlated with PCL-ACL and antioxidant capacity in β-carotene-linoleic acid emulsion oxidation. This observation confirmed the literature data on the influence of hydrophobicity of protein-derived antioxidants on their ability to scavenge O2•− [Pownall et al., 2010]. In our study, the mentioned variables were particularly associated with the hydrolysate at a DH of 5% (Figure 6B).
Figure 6
Plots of principal component analysis with (A) distribution of the variables including surface hydrophobicity (measured in the assay with 8-anilino-1-naphthalenesulfonic acid, ANS; and cis-parinaric acid, CPA), relative content of fractions with different molecular weight (MW) and antioxidant capacity (determined as 2,2’-azino-bis(3-ethylbenzothiazoline-6-sulfonic acid) radical cation scavenging capacity, ABTS; oxygen radical absorbance capacity, ORACFL; antioxidant capacity of water-soluble and lipid-soluble compounds in the photochemiluminescence assay, PCL-ACW and PCL-ACL, respectively; and inhibition of β-carotene-linoleic acid emulsion oxidation, EM OXID), and (B) distribution of pea protein isolate (degree of hydrolysis, DH, 0%) and its tryptic hydrolysates (DH 2–12%).
CONCLUSIONS
Trypsin treatment of the pea protein isolate resulted in a relatively low degree of hydrolysis. However, even this limited hydrolysis effectively improved antioxidant properties, and resulted in the higher antioxidant capacity of the hydrolysates compared to the pea protein isolate. With increasing DH, antioxidant capacity of the hydrolysates increased, but only in assays carried out in the aqueous environment (ABTS and ORACFL assays). In this case, the antioxidant capacity was affected by the decreasing molecular weights of the released polypeptides and peptides; however, the percentage content of the low MW fraction (<2 kDa) was small even in the hydrolysate at the highest DH. In turn, the surface hydrophobicity of pea protein hydrolysates, to a greater extent than their MW distribution, determined the antioxidant capacity in the PLC-ACL assay and during the oxidation of β-carotene-linoleic acid emulsion. Because the hydrolysate with low DH (5%) was characterized by the maximum surface hydrophobicity, such DH should be considered optimal for antioxidant capacity of tryptic pea protein hydrolysates in lipophilic environment.
Overall, the hydrolysis of pea proteins with trypsin can be considered as a viable means to obtain products with improved antioxidant properties, and the control of the degree of hydrolysis allows for the optimization of these properties under various conditions. The decline in surface hydrophobicity beyond a certain degree of hydrolysis needs to be further investigated to understand its implications for future applications of tryptic pea protein hydrolysates in food systems or nutraceuticals.