INTRODUCTION
Labneh (also spelled labaneh) is a semi-solid dairy product derived from yogurt by partial removal of whey. Originating from the Arabic word “laben” (meaning fermented yogurt), it is widely consumed across the Middle East, Turkey, the Balkans, and parts of Europe. Its appeal lies in its unique texture, nutritional profile, and extended shelf life, which make it a staple in many household diets and an economically important fermented dairy product with growing market potential and consumer acceptance [Elkot et al., 2025]. Labneh is typically enjoyed with bread and olive oil or used in culinary dishes. It is recognized for its white to creamy appearance, smooth and spreadable texture, low syneresis, and acidic taste, positioned between sour cream and cottage cheese in flavor and consistency [Atamian et al., 2014]. Compared to yogurt, labneh provides higher protein and mineral contents, a lower lactose level due to fermentation, and a higher count of viable probiotic bacteria, which enhances its nutritional and functional value [Aloğlu & Öner, 2013; Tawfek & Ali, 2022].
Whey separation is a critical step in labneh production. Traditionally, cheesecloth made from cellulose fibers is used to strain set yogurt, while modern methods involve centrifugation, ultrafiltration, and reverse osmosis [Dharaiya et al., 2019; Leu et al., 2017]. Although traditional straining is labor-intensive and less efficient, it is often preferred for producing labneh with desirable texture and sensory characteristics. However, this method carries significant hygienic risks due to microbial retention in the cheesecloth, especially when reused. Cotton-based fabrics readily absorb moisture, creating an environment conducive to microbial growth and biofilm formation. Repeated use and inadequate sanitation practices can result in contamination by psychrotrophic yeasts and molds, ultimately reducing labneh’s shelf life to about two weeks at ≤6°C [Bhaskaracharya et al., 2024].
To combat spoilage, interventions such as coating packaging films with potassium sorbate and incorporating essential oils have been explored [El-ssayad et al., 2025]. Potassium sorbate has shown higher antifungal efficacy, while essential oils yielded limited results and could affect sensory properties. Recent studies have also demonstrated that laser irradiation can enhance the microbial stability of probiotic labneh [Elshaghabee et al., 2022]. Despite efforts to modernize the whey separation process, high equipment costs, membrane fouling, and subsequent cleaning continue to limit widespread adoption of ultrafiltration and reverse osmosis [Dharaiya et al., 2019]. The use of superabsorbent polymers has also been investigated, but long dewatering times and adverse flavor impacts restrict their utility [Fauzi et al., 2020; Muncke et al., 2017]. Moreover, regulatory constraints on food contact materials pose further challenges. In large-scale production, many dairy companies choose centrifugation to enhance processing efficiency and hygiene, avoiding cheesecloth methods due to microbial contamination risks and yield losses. To address these issues while maintaining the traditional product identity, the integration of microfilter technology has emerged as a promising alternative. Microfilters (MFs) can be combined with mild centrifugation or hydrostatic pressure steps to optimize whey drainage without compromising sensory or structural attributes [Leu et al., 2017; Reig et al., 2021].
Artificial microfilters made of polyamide (nylon) are approved by the United States Food and Drug Administration (FDA) for food contact applications, offering high heat resistance, tensile strength, and resistance to microbial adhesion. Polyamide MFs are particularly well-suited for repeated cleaning and do not retain whey, reducing microbial growth. Their use in whey separation could significantly enhance labneh production by improving hygiene, yield, and consistency while maintaining the desired texture and identity of the traditional product [Huang et al., 2022]. Mechanical and rheological properties such as hardness, spreadability, adhesion, and viscoelasticity characteristics of labneh could be affected by processing conditions [Bayarri et al., 2012]. This study aimed to assess the feasibility of replacing traditional cheesecloth with microfilters in labneh production. Comparative analysis was focused on yield, chemical composition, microbiological quality, rheological behavior, mechanical, sensory attributes, and whey drainage kinetics.
MATERIALS AND METHODS
Labneh production and microfilter application
Labneh was produced following traditional protocols at the dairy pilot plant of the University of Jordan, Amman, Jordan. In total, 500 L of fresh cow’s milk were filtered, heat-treated at 85±2°C for 30 min to ensure microbial safety, then cooled to 43±1°C before inoculation. The milk was inoculated with 2 g/100 mL of a direct-set, freeze-dried yogurt starter culture (LC DY223; 5U, Batch No. B28941, BDF Natural Ingredients SL, Girona, Spain), containing a defined symbiotic blend of Streptococcus thermophilus and Lactobacillus delbrueckii subsp. bulgaricus, essential for acidification and flavor development [Papadaki & Roussis, 2022]. Fermentation proceeded at 43±1°C until the pH reached 4.6, indicating proper gel formation. The set yogurt was then cooled to 5°C for 16 h and salted with sodium chloride (0.7 g/100 g) to enhance flavor and facilitate whey separation. For straining, 5-kg portions of set yogurt were placed into either traditional cheesecloth bags (control) or synthetic polyamide microfilter bags (50×70 cm). The bags were suspended and allowed to drain under gravity at 5±1°C for approximately 20 h. The resulting labneh was collected, packed into low-density polyethylene (LDPE) containers (500 mL), sealed, and stored at 5±1°C for up to 15 days, complying with the Jordanian Standard (JS) no. 108:2003 [JS 108, 2003] for labneh.
The MFs were fabricated from food-grade polyamide monofilaments sourced from Hebei Macrokun Trading Co., Ltd (Shijiazhuang, China) and classified by nominal pore size: 10 μm (MF10), 20 μm (MF20), 40 μm (MF40), 57 μm (MF57), and 75 μm (MF75). The MFs were certified for food contact under FDA regulations and deemed suitable for both single and repeated use [SGS Test Report, 2019]. The cheesecloth was supplied locally (Al-Ahli Co., Amman, Jordan). To ensure comparable processing conditions, all filtration bags had identical dimensions and drawstring closures. Before each use, all filtration materials underwent a standardized cleaning and sanitization protocol: washing in a commercial washer for 50 min at 40°C with a sodium lauryl sulfate-based detergent, followed by a 15-min sanitization cycle at 40°C using a food-grade disinfectant (Est-eem Evans, Preston, UK; 250 mL per cycle). The materials were then air-dried under mild sunlight and ambient airflow. Each washing cycle included 10 fabric pieces to ensure consistent hygiene standards.
Labneh yield calculation
Labneh yield (g/100 g) was calculated according to the method described by Elssadig et al. [2020], using Equation (1):
Determination of total solids and fat contents, pH, and titratable acidity of labneh and whey
Standardized protocols were followed to ensure consistency and accuracy in the determination of total solids, fat content, pH, and titratable acidity of labneh and whey [AOAC, 2016]. The content of total solids (TS) of labneh and whey was determined using the oven-drying method. Approximately 3 g of a homogenized sample were weighed into pre-dried aluminum dishes and dried in a hot air oven (FD56, Binder GmbH, Tuttlingen, Germany) at 115°C for labneh and 90°C for whey until a constant weight was achieved. Samples were then cooled in a desiccator and weighed using a precision electronic balance (±0.01 g accuracy). TS content (g/100 g) was calculated following Equation (2):
where: W1 is the initial labneh or whey weight and W2 is the final weight after drying.
Fat content in labneh was determined using the Gerber method. For pH measurement, 5 g of labneh were diluted (1:1, w/v) with distilled water, homogenized, and subjected to measurements at room temperature using a pH meter (HI 8414, Hanna Instruments, Inc., Woonsocket, RI, USA). Titratable acidity was determined by titrating 5 g of the slurry against a standardized NaOH solution, with results calculated using Equation (3) and expressed as g lactic acid/100 g labneh:
where: VNaOH is the volume (mL) of NaOH solution used for titration, CNaOH is the concentration (M) of NaOH solution, wsample is the weight (g) of sample, and 90 is the equivalent weight of lactic acid.
The pH and titratable acidity were monitored over 15 days of storage at 5±1°C as indicators of microbial stability and to assess the shelf-life quality of the labneh.
Microbiological analysis
Microbiological quality was assessed following the Bacteriological Analytical Manual [BAM, 2024]. The pour plate technique was used to enumerate mesophilic bacteria, yeasts, and molds. Homogenized labneh samples were serially diluted up to 10-4 in sterile peptone water. For mesophilic aerobes, aliquots were plated on plate count agar (PCA; HiMedia, Mumbai, India) and incubated at 37°C for 48 h under aerobic conditions. Yeasts and molds were plated on PCA supplemented with 100 μg/mL each of chloramphenicol and chlortetracycline-HCl (PanReac AppliChem, Darmstadt, Germany) and incubated at 25°C for 5 days. Results were expressed as colony-forming units per gram (cfu/g) and converted to log values (log10 cfu/g) for analysis. Additionally, microbiological assessments were conducted on cheesecloth and MFs after four cycles of use, cleaning, and sanitization, as described earlier. Swab samples were collected under aseptic conditions to evaluate surface contamination and material hygiene (log10 cfu/cm2).
Microscopic imaging
Representative sections (2×2 cm) of the cheesecloth and selected microfilters (MF10 and MF57) were examined under a light microscope (Model SFX-31, Optika Microscopes, Ponteranica, Italy) at 2× and 4× magnifications. Images were captured using a mounted digital camera (SN 451524, Optika Microscopes). This analysis aimed to qualitatively compare the structural characteristics and pore morphology of the traditional and synthetic filtration materials used in labneh production.
Analysis of whey drainage kinetics
Whey drainage kinetics were evaluated following a modified procedure from Ebid et al. [2022]. Freshly set yogurt (5 kg) was transferred into sanitized cheesecloth or MFs bags, tied securely, and suspended for gravity-driven drainage. Whey weight was recorded at 15, 30, 45, 60, 90, 120, 180, 240, 300, and 360 min. All samples were maintained at 5±1°C throughout to reduce temperature-induced variability and simulate refrigerated industrial straining conditions.
Analysis of apparent flow behavior and viscosity of labneh
The apparent viscosity of labneh was measured using a rotational viscometer (SNB-AI Digital Viscometer, Shandong, China) under steady shear conditions at 5±1°C. To avoid air incorporation, samples were gently transferred into the measurement vessel and analyzed within 10 min of removal from cold storage. Shear rates were applied incrementally (36; 120; 360; 720; 1,800; and 3,600 s-1). At each shear rate (γ), steady-state shear stress (τ) was recorded after equilibrium was achieved, and apparent viscosity (ηa, Pa×s) was calculated as the ratio of shear stress to shear rate. Flow behavior was characterized by plotting τ vs. γ and fitting the data to the Herschel–Bulkley model desired by Equation (4), which extends the Power-law model by incorporating a yield stress (το) representing the minimum force required to initiate flow.
where: τ is the shear stress (Pa), το is the yield stress (Pa), m is the consistency coefficient (Pa×sn), γ is the shear rate (s-1), and n is the flow behavior index.The model parameters, m and n, were derived from the intercept and slope, respectively, of the log-log plot of shear stress vs. shear rate [Biglarian et al., 2022]. The resulting flow and viscosity curves provided insight into the gel structure and spreadability of the labneh formulations.
Texture analysis
Texture analysis was performed using a CT3 texture analyzer (Brookfield, Middleboro, MA, USA) equipped with a 25-kg load cell. The TA-STF fixture, consisting of a TA15/1000 45° male cone probe and corresponding female cone holder, was used, as this setup is suited for assessing the mechanical properties of semifluid foods [Brighenti et al., 2008; Khule et al., 2024]. Labneh samples were equilibrated at 5±1°C for 4 h before testing to ensure uniform thermal conditions. The samples were carefully loaded into the female cone to eliminate air pockets and levelled to create a uniform surface. Test parameters included a target penetration depth of 47 mm, a trigger load of 1 g, and a crosshead speed of 3 mm/s. During compression, the probe descended into the sample, simulating spreading, and then withdrew to complete the single-stroke cycle. Force–time data were recorded using TexturePro CT software (Version 1.10, Brookfield). Texture analysis profile (load vs. time) was recorded and hardness (maximum force during compression), hardness work (HW; area under the positive portion of the force–distance curve), and adhesion (area under the negative portion during withdrawal) were determined. Hardness (N) reflected firmness. HW (N×s) represented the energy required to shear and spread the sample. Adhesion quantified the work needed to overcome adhesive forces [Ahmed et al., 2020; Bayarri et al., 2012; Dejeu et al., 2022; Ziarno et al., 2023]. Coefficients of variation (CV) below 2% indicated good sample homogeneity, whereas higher values suggested internal variability.
Sensory evaluation
Sensory evaluations followed a 9-point hedonic scale, as described by Elshaghabee et al. [2022]. Thirty panelists (aged 24–50 years), including faculty and graduate students at the University of Jordan, evaluated attributes such as overall acceptability, softness, color, taste, granulation, and saltiness. Before testing, the panelists received brief training to familiarize them with the 9-point hedonic scale and the evaluation attributes specific to labneh, using reference samples for calibration (e.g., softness, taste, granulation). These reference samples were employed during training to ensure consistent scoring prior to the formal sensory evaluation. Labneh samples were presented on coded polyester plates with an accompanying structured questionnaire. Panelists worked in quiet, odor-free, and well-lit individual booths and received instructions to cleanse their palates with bottled water between samples. Samples were served at ~5°C in randomized order using three-digit codes. Panelists scored each attribute on a scale from 1 (“dislike extremely”) to 9 (“like extremely”). Evaluations were conducted over three non-consecutive days to account for temporal variability and reduce panelist fatigue. A structured sensory evaluation questionnaire was specifically designed and utilized to systematically assess all quality attributes. Approval for the sensory evaluation procedure was granted by the Scientific Committee of the Deanship of Research at the University of Jordan (No. 1/2021/1539), in accordance with the principles outlined in the Declaration of Helsinki.
Statistical analysis
All experiments and measurements were conducted in triplicate and results were reported as mean and standard deviation. Statistical analysis was performed using IBM SPSS Statistics (version 23.0, IBM Corp., Armonk, NY, USA). One-way analysis of variance (ANOVA) followed by post-hoc comparisons using the least significant difference (LSD) tests at a 95% confidence level were used to determine significant differences (p<0.05) among treatments (MF10–MF75 and the control) and across multiple storage time points. Pearson correlation analysis was conducted to examine the relationship between fat content and total solids, and results were expressed as correlation coefficient (r).
RESULTS AND DISCUSSION
Yield and total solids
Labneh produced using cheesecloth exhibited significantly lower (p<0.05) yield (21.2 g/100 g) compared to that obtained with MF10 (29.8 g/100 g) and all other MFs (Figure 1A). No significant differences (p≥0.05) in yield were observed among the MF treatments (MF10 to MF75). ANOVA confirmed that replacing cheesecloth with microfilters improved recovery by approximately 30% compared to the control. This improvement is technologically meaningful, as a higher yield directly enhances processing efficiency and profitability. The yield values obtained in this study align with those previously reported for labneh made from full-fat cow’s and goat’s milk using cheesecloth, which typically range between 23 and 32 g/100 g [Ayyad et al., 2015; Elssadig et al., 2020].
Figure 1
Effect of using cheesecloth (control) and microfilters (MFs) with different pore sizes (10–75 μm) on yield (A) and contents of total solids (TS) (B) and fat (C) of the labneh and TS content of strained whey (D). Different letters above bars indicate significant differences (p<0.05) among treatments for each quality parameter.
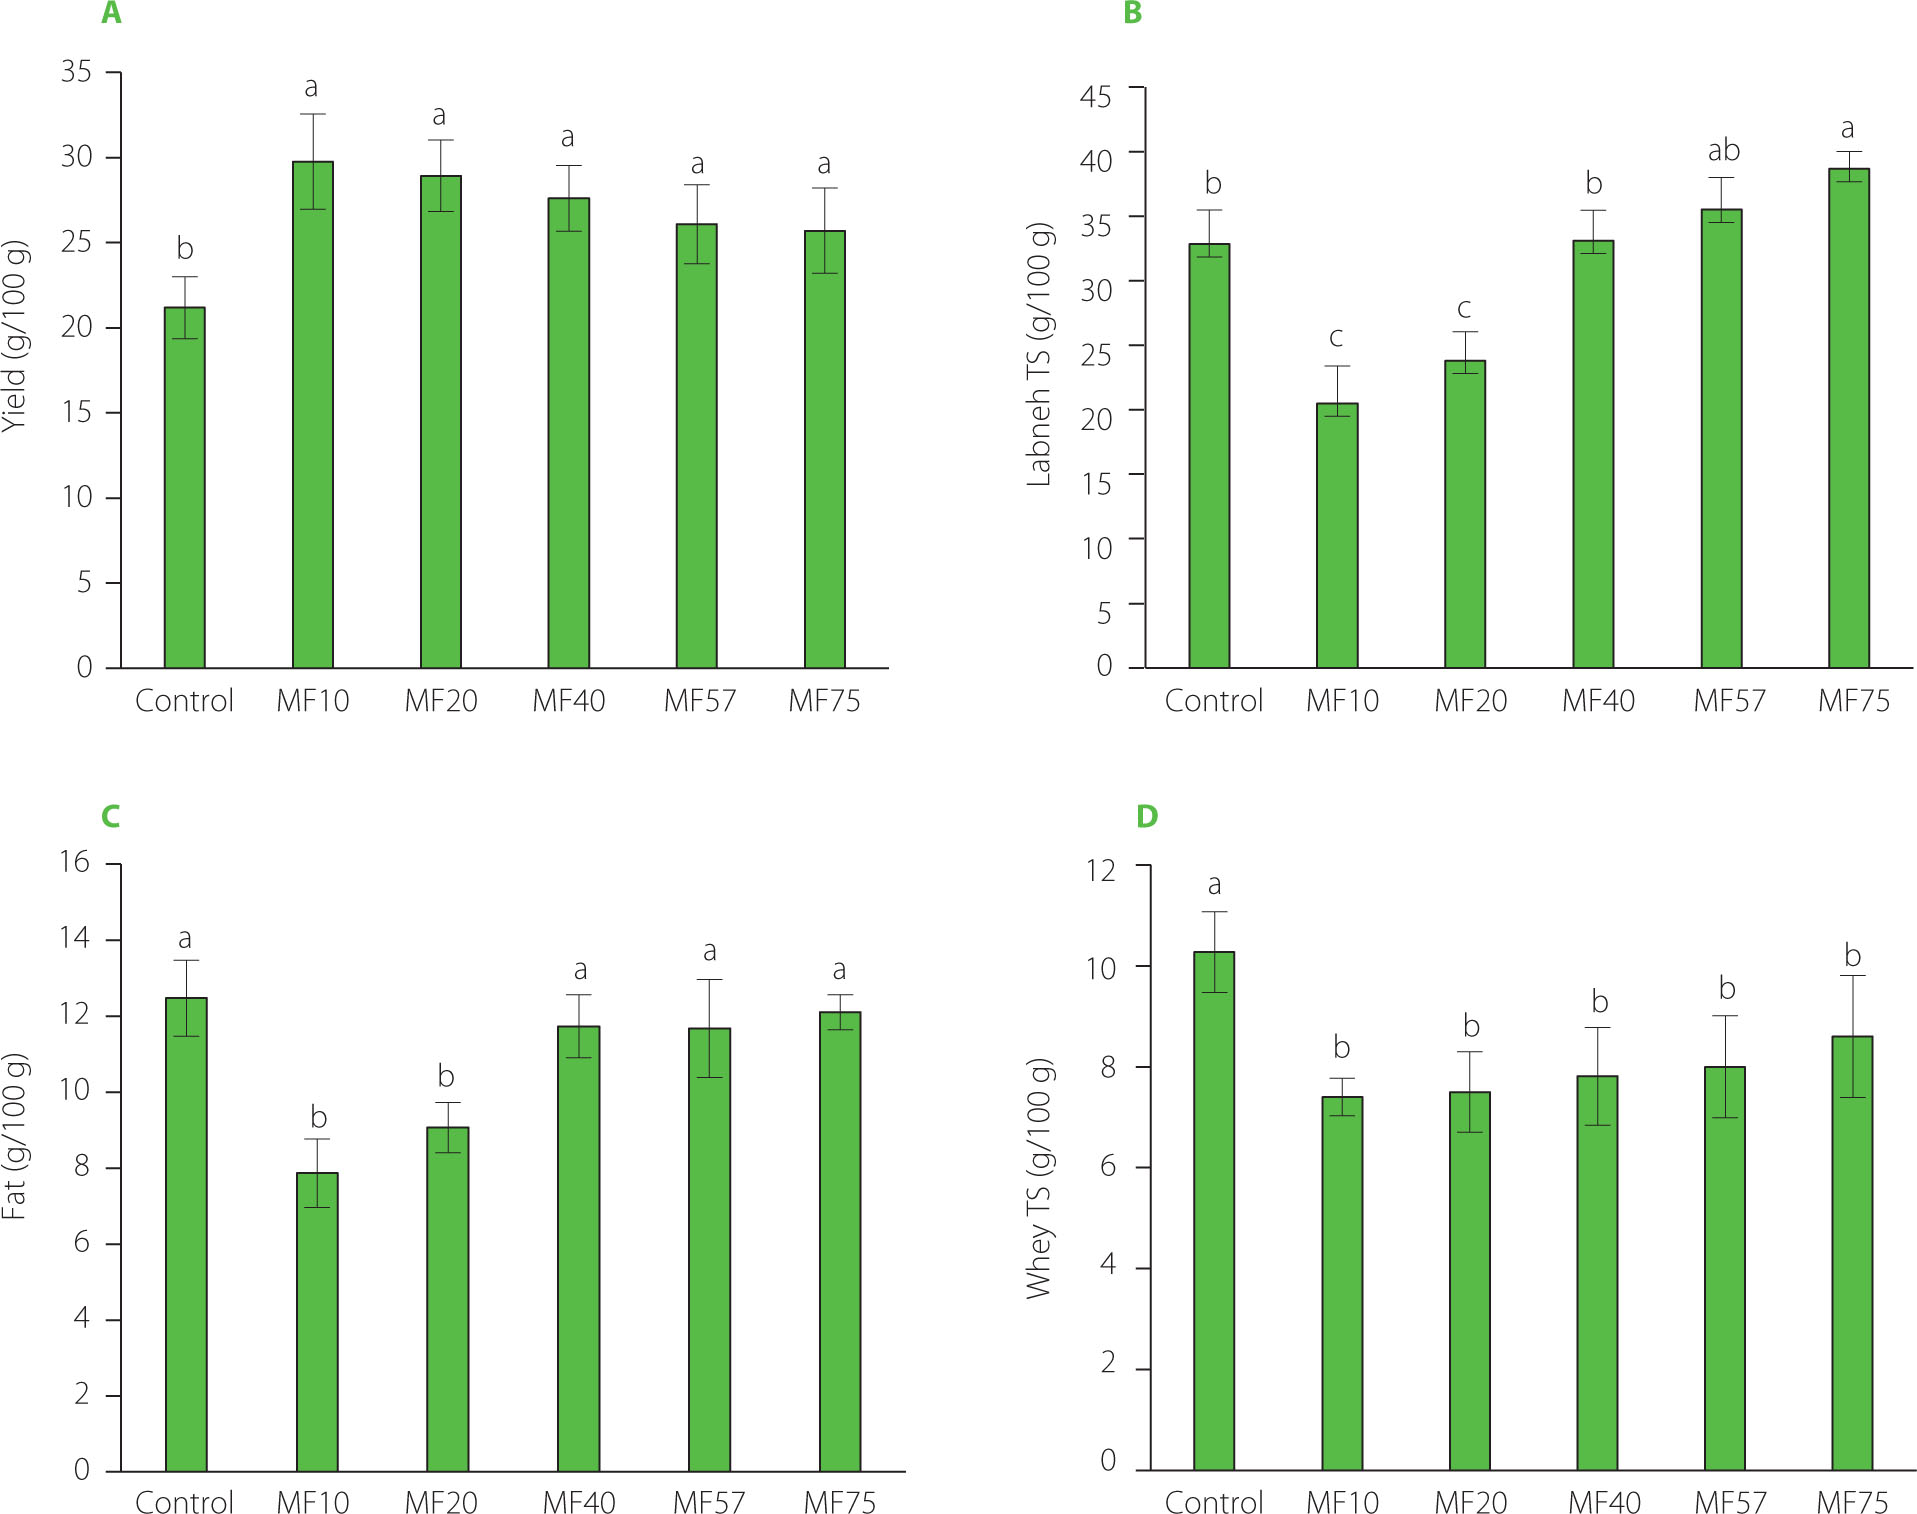
The lowest TS content was observed in labneh produced using MF10 (20.5 g/100 g), followed by MF20 (23.8 g/100 g). The MF40 and MF57 treatments showed no significant differences (p≥0.05) in TS content compared to the control (32.8 g/100 g), while MF75 exhibited a significantly higher TS content (38.7 g/100 g) (Figure 1B). Comparable TS values, reaching up to 36 g/100 g, have been reported for labneh produced from goat’s milk, as well as for labneh made from bovine, caprine, ovine, and mixed cow’s milk sources [Aloğlu & Öner, 2013; Atamian et al., 2014; Bhaskaracharya et al., 2024; Tawfek & Ali, 2022]. Shamsia & El-Ghannam [2012] reported 22.2 g/100 g for labneh produced via ultrafiltration. Additionally, Habib et al. [2017] found TS content ranging from 23 to 29 g/100 g of labneh processed using cotton bags.
The high yield and low TS content observed in MF10 and MF20 treatments may be attributed to the smaller pore sizes, which likely became partially blocked by aggregated casein–fat complexes and other suspended solids. In contrast, serum proteins (3–6 nm) readily pass through even the finest MF (MF10) membranes [Reig et al., 2021]. This partial clogging likely resulted in greater moisture retention within the curd. While the control (cheesecloth) allowed for more efficient whey drainage and would theoretically produce higher TS content, this was not observed due to strong curd adhesion to the cheesecloth fibers, leading to product loss and lower overall yield. In contrast, labneh was easily released from the MF bags without significant losses.
The final TS content of labneh strained through cheesecloth can vary considerably depending on several factors, including the type of milk, starter culture composition, and straining duration, all of which may differ widely among processors [Bhaskaracharya et al., 2024]. Nevertheless, all labneh samples in the present study met the minimum TS requirement of 23 g/100 g for full-fat labneh made from cow’s milk, as specified by the Jordanian Standard for fresh labneh [JS 108, 2003].
Fat content of labneh and content of total solids of whey
The fat content in the labneh samples ranged from 7.9 g/100 g in MF10 to 12.5 g/100 g in the control sample (Figure 1C) and showed a strong positive relationship with TS content (r=0.95). No significant differences (p≥0.05) in fat content were observed among treatments, except for MF10 and MF20, which exhibited significantly lower (p<0.05) fat content. The fat content reported here is consistent with findings from previous studies. Atamian et al. [2014] reported fat contents of 9.18 g/100 g for full-fat, 4.79 g/100 g for reduced-fat, and 0.35 g/100 g for low-fat labneh prepared using cloth bags. Shamsia & El-Ghannam [2012] found no significant differences in fat content (8.6–8.7 g/100 g) between traditionally strained and ultrafiltered labneh. A broad range of fat contents (5.5–45.6 g/100 g) was recently reported by Bhaskaracharya et al. [2024] in a market survey of 116 labneh products from multinational and small-to-medium enterprises in the United Arab Emirates. These products were categorized as high-fat (17–18 g/100 g), full-fat (7.1–8 g/100 g), and low-fat (3.5–4.5 g/100 g), depending on their composition.
The TS content of whey did not differ significantly (p≥0.05) among MF treatments, but all significantly differed (p<0.05) from the control (Figure 1D). These findings suggest that while pore size influences moisture and whey retention in the labneh curd, it does not significantly alter the composition of the expelled whey (e.g., whey proteins, lactose, or lactic acid residues). This indicates that MFs primarily affect the quantity of retained whey rather than its composition.
There was a noticeable trend of increasing TS and fat content in labneh with larger pore sizes. This pattern is likely due to a dilution effect, where greater whey retention in treatments with finer pore sizes leads to lower TS and fat content in the final product. Conversely, larger pore sizes promote more effective whey drainage, resulting in higher TS and fat content relative to the retained solids. These findings are further supported by the consistent TS values observed in the whey across all treatments, indicating that pore size primarily influences the amount of whey retained within the curd rather than altering whey composition.
pH and titratable acidity
On day 0, pH values ranged from 3.4 to 3.5 (Figure 2A). A similar pattern was observed throughout storage, with pH values declining significantly (p<0.05) to 3.0–3.2 by day 7, followed by a slight decrease to 2.8 to 3.1 by day 15. A general trend was evident across all treatments: a pH reduction by day 7 and 15, likely due to continued acid production by residual lactic acid bacteria. However, no significant differences (p≥0.05) in pH were detected among treatments or compared to the control at any time point during storage. These pH fluctuations may be attributed to the acid–base buffering capacity of milk proteins, as well as changes in protein structure and solubility following heat treatment and acid development [Lange et al., 2020]. The pH values recorded in this study were slightly lower than those reported in earlier works. For instance, Atamian et al. [2014] documented pH values around 3.7, while Hassabo [2017] observed values near 4.63 in labneh produced using traditional methods. However, the pH readings in the current study were more comparable to those reported by Haddad et al. [2017], who found values around 3.6 for both low-sodium (0.5 g NaCl/100 g) and full-sodium (1 g NaCl/100 g) labneh.
Figure 2
pH (A) and titratable acidity (B) of labneh strained through cheesecloth (control) and polyamide microfilters (MFs) with different pore sizes (10–75 μm) during storage at 5°C for 15 days. Different lowercase letters above bars indicate significant differences (p<0.05) among treatments within the same storage day, while different uppercase letters indicate significant differences (p<0.05) among storage days within the same treatment.
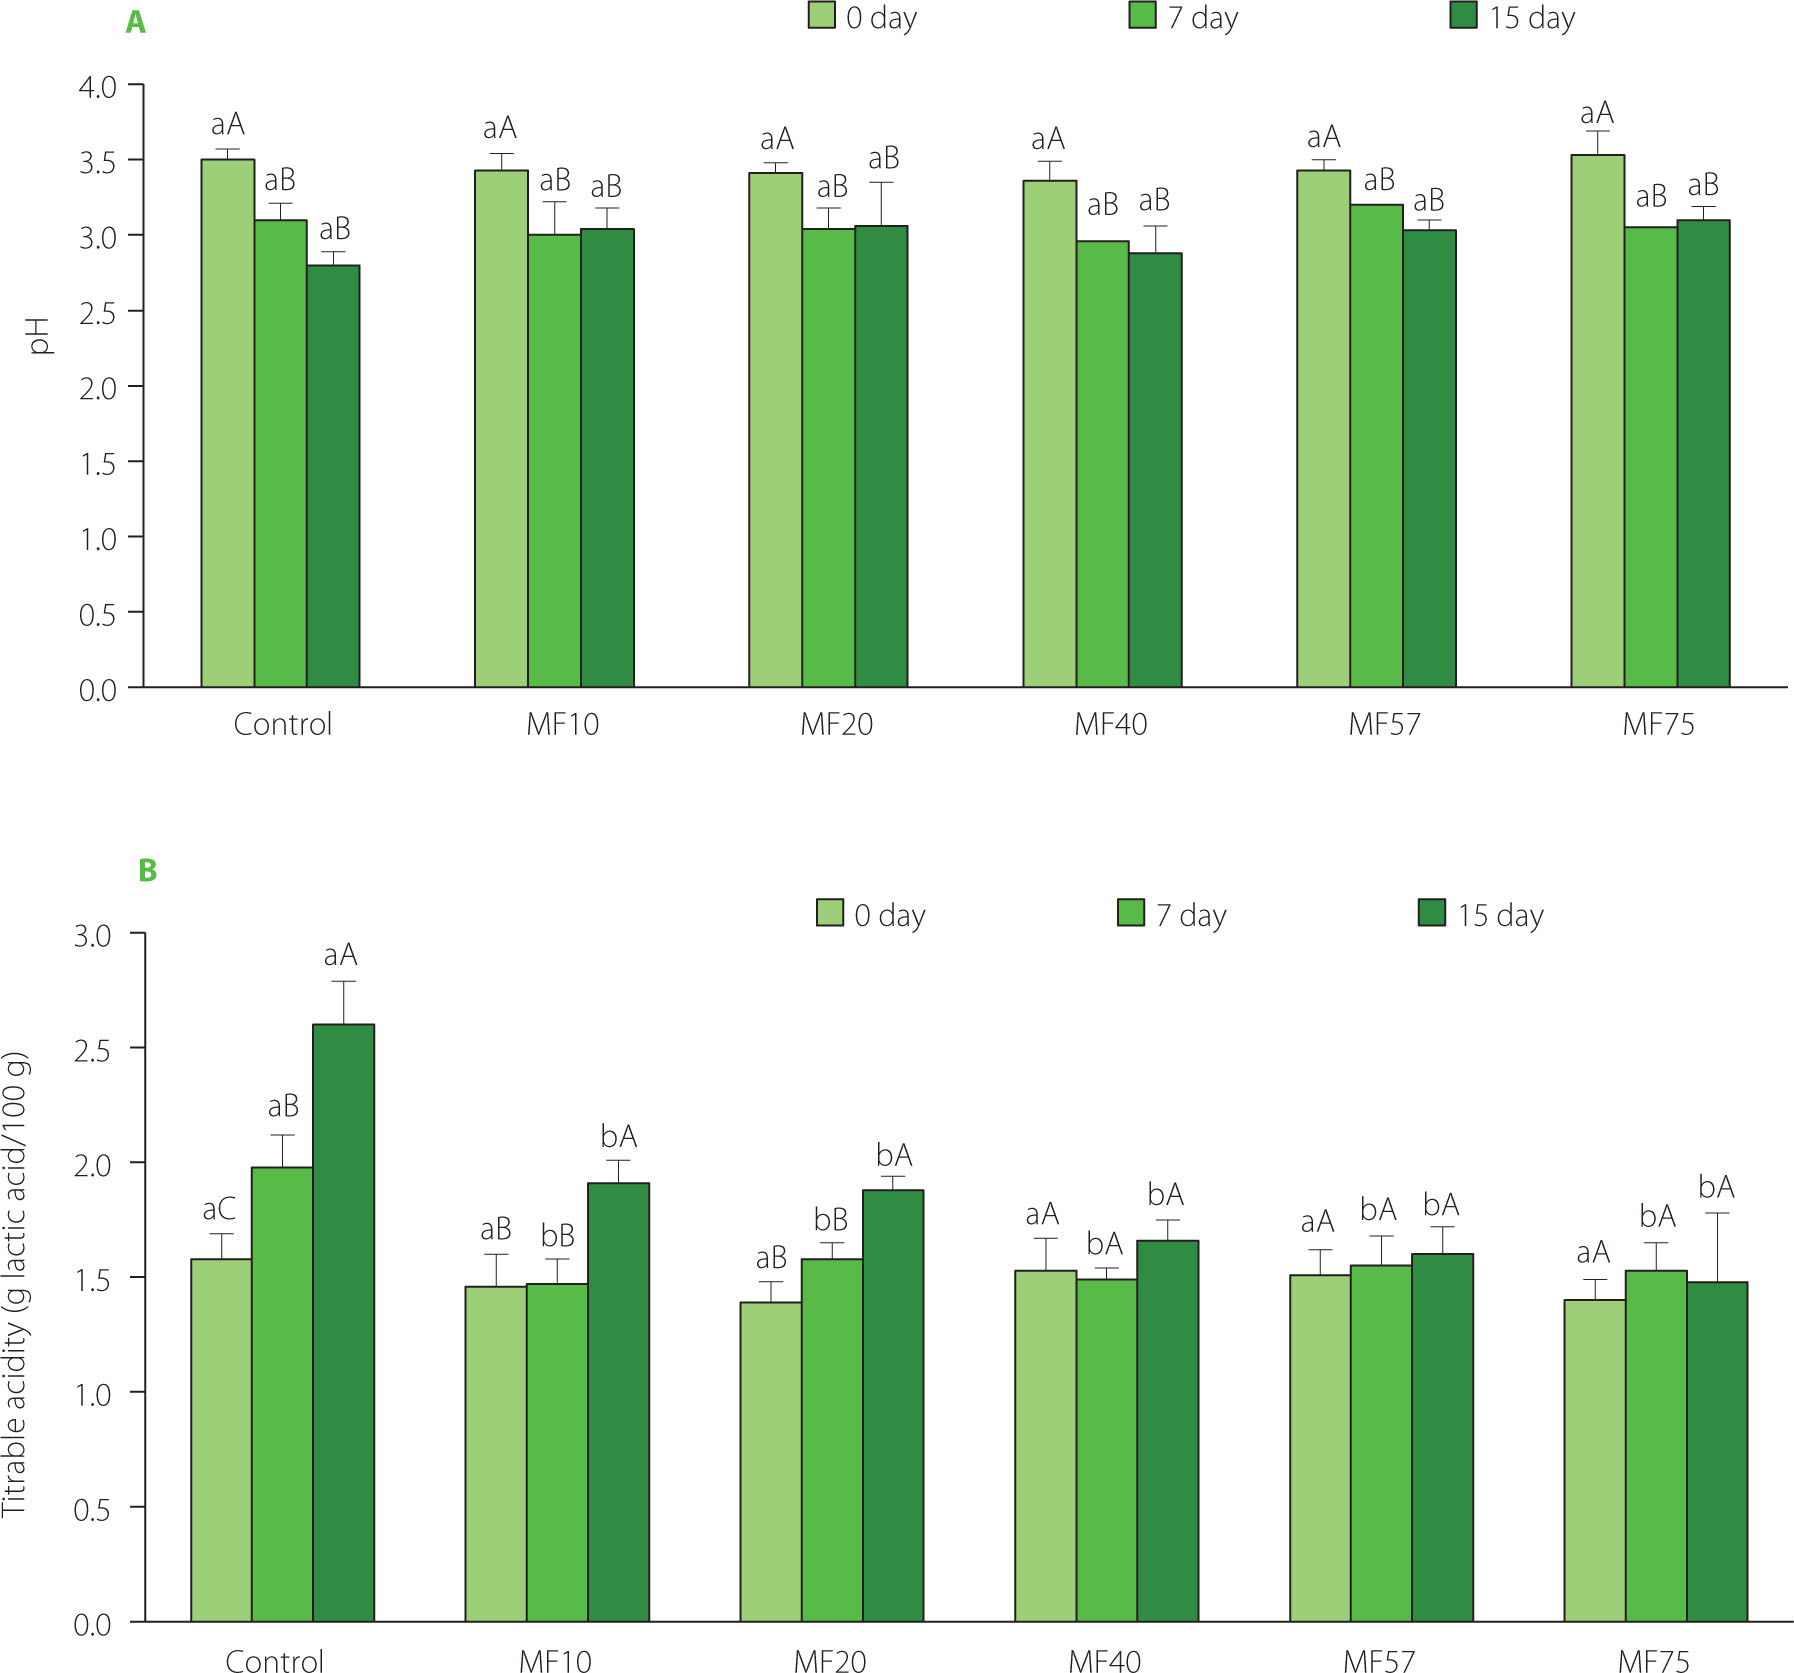
Titratable acidity ranged from 1.39 to 1.58 g lactic acid/100 g on day 0, from 1.47 to 1.98 g lactic acid/100 g on day 7, and from 1.48 to 2.60 g lactic acid/100 g on day 15 (Figure 2B). These values align with the range reported by Sumarmono et al. [2019], who found acidity levels between 1.30 and 1.45 g/100 g in labneh prepared using in-bag straining. Tawfek & Ali [2022] reported lower initial acidity values (0.95 g/100 g) for fresh cow’s milk labneh, which increased to 1.45 g/100 g after 40 days of storage at 5°C. In contrast, Shamsia & El-Ghannam [2012] reported higher acidity levels (1.54–2.47 g/100 g) in labneh produced via ultrafiltration. While no statistically significant differences (p≥0.05) in pH or titratable acidity were detected among treatments throughout storage, the control product showed significantly higher acidity values (p<0.05) between days 7 and 15. This suggests that microfiltration may moderate acid development during storage by limiting microbial activity. Similar findings were reported by El-Sayed & El-Sayed [2021], who attributed higher acidity in control ultrafiltered labneh to more active lactic acid bacteria compared to samples treated with essential oil nanoemulsions.
All acidity values in this study complied with the Jordanian Standard for fresh labneh [JS 108, 2003], which specifies a maximum titratable acidity of 3.5 g/100 g as lactic acid. The increase in acidity observed in the control group after 7 days may be attributed to the metabolic activity of contaminating yeasts, which exhibit high oxidative capacity by generating additional organic acids [Abd El-Montaleb et al., 2022; Ayyad et al., 2015; El-Sayed & El-Sayed, 2021]. By contrast, Habib et al. [2017] reported stable acidity (1.25 g/100 g) in sage-fortified labneh stored at 5°C for 20 days, underscoring the role of additives and microbial composition in modulating acid development during storage. Overall, the consistent acidity trends observed in this study suggest microbial and chemical stability in MF-treated labneh samples throughout the storage period, regardless of pore size.
Microbiological analysis
Mesophilic aerobe counts in labneh samples ranged from 3.31 log10 cfu/g in the MF10 treatment to 4.63 log10 cfu/g in the control. Yeast and mold counts varied from 1.11 log10 cfu/g (MF10) to 3.58 log10 cfu/g (control) (Table 1). ANOVA confirmed significantly higher microbial loads in the control compared to all MF treatments (p<0.05), with differences reaching up to 1.2 log10 cfu/g for mesophilic aerobes and 2.3 log10 cfu/g for yeasts and molds. These statistically significant differences are relevant for product safety and shelf life. In contrast, no significant variation (p≥0.05) was detected among MF10–MF75, underscoring the consistent hygienic performance of polyamide filters regardless of pore size. These results suggest that, despite the higher TS content in MF57 and MF75-treated labneh (Figure 1B), which could theoretically promote yeast growth due to increased nutrient availability and reduced water activity, the use of microfilters markedly improves the microbial quality of labneh relative to traditional cheesecloth methods. This improvement is likely attributable to the superior hygienic properties of synthetic polyamide MFs, which resist microbial adhesion and facilitate more thorough cleaning and sanitation protocols.
Table 1
Mesophilic aerobes (MA) and yeasts and molds (Y&M) counts in fresh labneh strained through cheesecloth (control) and polyamide microfilters (MFs) with different pore sizes (10–75 μm), and microbial counts on cheesecloth and MF surfaces after four consecutive cycles of use, cleaning, and sanitization.
The microbial counts observed in this study were generally lower than those reported in previous research. Hassabo [2017], investigating labneh supplemented with palm oil, reported total bacterial counts ranging from 4.8 to 6.9 log10 cfu/g, with the highest levels found in control samples made from milk with standardized fat content of 4 g/100 g. Similarly, Elkot & Khalil [2022] and Tawfek & Ali [2022] documented total bacterial loads between 5.5 and 7.5 log10 cfu/g in traditionally strained labneh. However, unlike our findings, these studies reported no detectable yeast or mold growth in fresh samples. Ayyad et al. [2015] also observed no yeast or mold growth during 24 days of refrigerated storage in labneh produced via in-bag straining. Gharaibeh [2017] reported substantially higher microbial loads, with aerobic plate counts between 7.7 and 8.5 log10 cfu/mL and yeast and mold counts ranging from 6.0 to 7.1 log10 cfu/mL, in unbranded labneh samples collected from local markets in Irbid, which were produced at a small scale. Furthermore, Tawfek & Ali [2022] found that yeast and mold counts remained undetectable in traditionally strained labneh until day 20 of storage at 5°C. These discrepancies among studies may be attributed to differences in production scale, post-pasteurization handling, sanitation practices, and storage conditions.
To further investigate the role of straining tools in microbial contamination, mesophilic aerobes and yeast and mold counts were measured on cheesecloth and MFs after four consecutive cycles of use, cleaning, and sanitization. As shown in Table 1, microbial loads were significantly higher (p<0.05) in the cheesecloth compared to the MFs, indicating inadequate sanitization and higher microbial retention in traditional materials. This suggests that cheesecloth can serve as a reservoir for cross-contamination between batches, whereas MFs, made from hydrophobic synthetic polyamide and certified for food contact, provide a more hygienic alternative. These findings underscore the importance of enhanced hygiene control in traditional labneh processing and support the adoption of synthetic microfiltration tools to improve food safety and product consistency.
Microscopic observations of cheesecloth and polyamide microfilters
Representative microscopic images of MF10, MF57, and traditional cheesecloth (control) at 2× and 4× magnifications are shown in Figure 3. The visual comparison indicates that the pore size of MF57 was approximately ten times smaller than that of the cheesecloth at both magnification levels. These differences became even more pronounced when comparing the finerstructured MF10 membranes with the control, highlighting substantial variation in pore geometry among the materials.
Figure 3
Microscopic images of polyamide microfilters with pore sizes of 10 μm, MF10 (A and B), and 75 μm, MF57 (C and D), and cheesecloth (E and F) at 2× and 4× magnification, respectively.
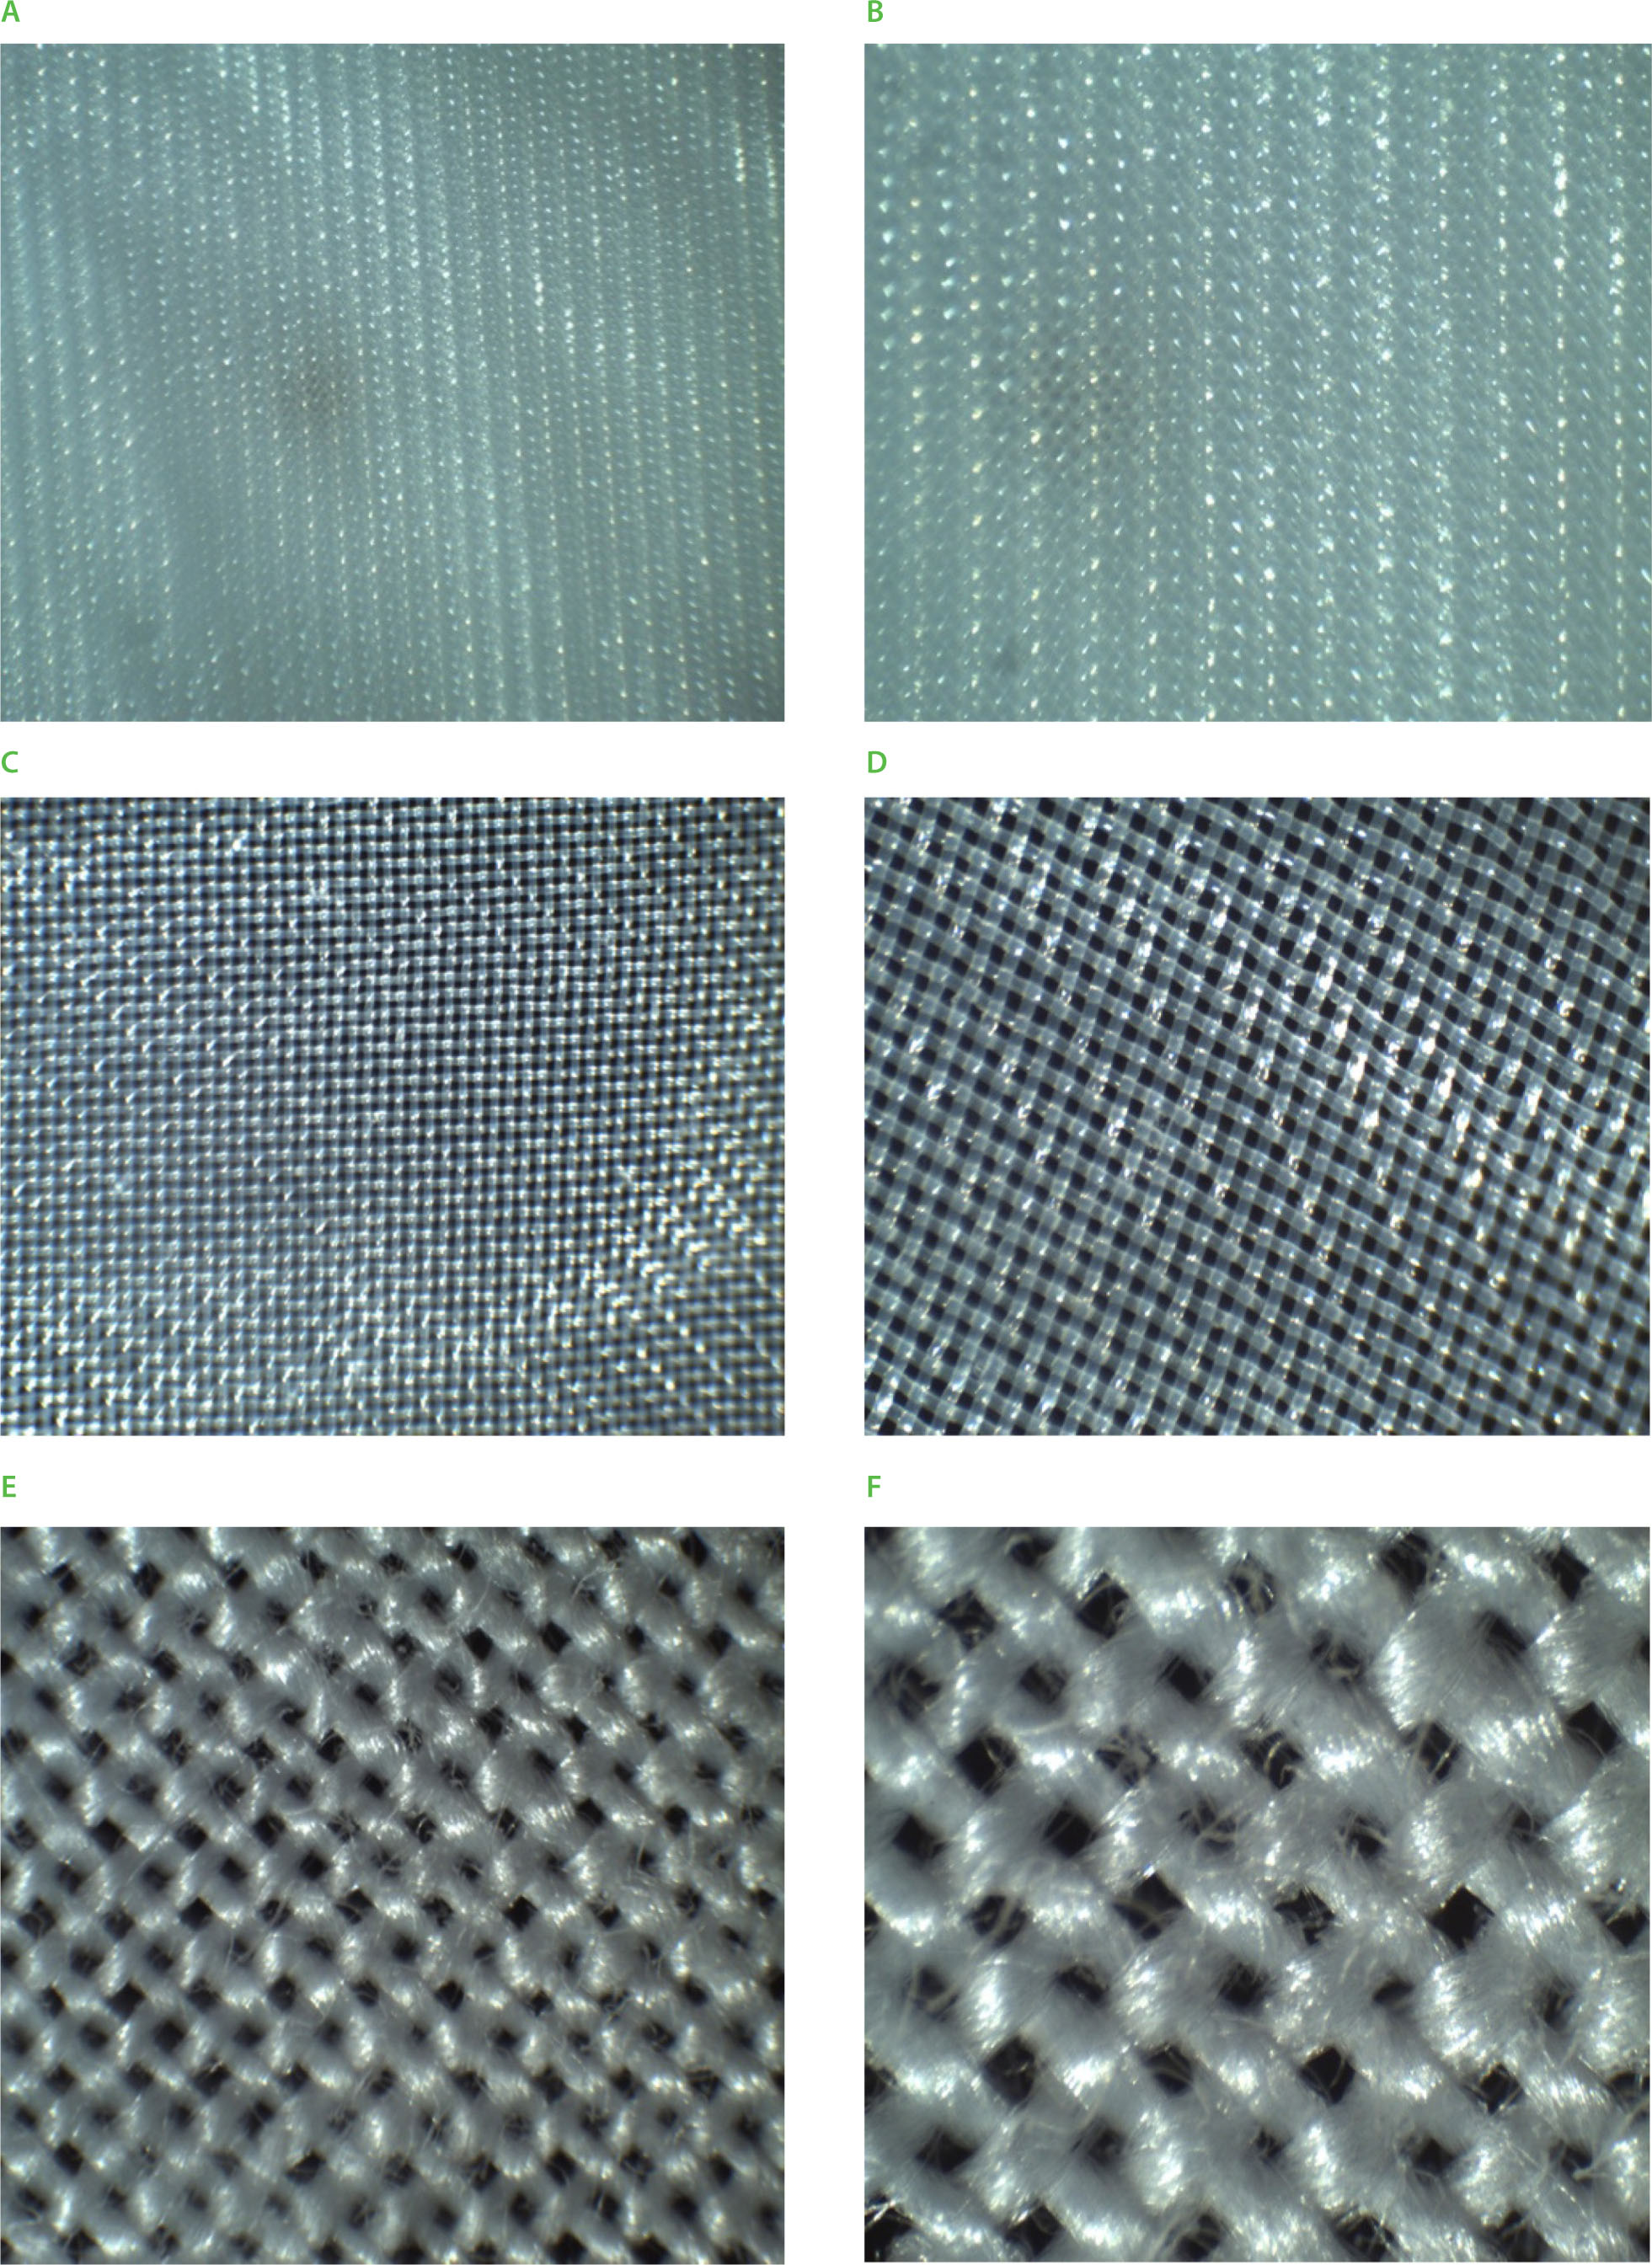
The MFs displayed uniform, smooth surfaces without visible fiber bundles or microfibers. In contrast, the cheesecloth was composed of loosely arranged cellulose fibers and microfibers, resulting in an inherently variable and rough pore architecture. These structural differences have important implications for whey separation performance and microbial contamination. The cellulose-based cheesecloth, being hydrophilic, absorbs whey during straining, causing fiber swelling that reduces the effective pore size over time and potentially impairs drainage efficiency. This swelling likely contributed to the lower yields and the higher product adhesion observed in the control samples (Figure 1A).
Conversely, polyamide-based microfilters, which are hydrophobic and resistant to moisture absorption, maintained stable pore dimensions throughout the straining process. This stability likely contributed to the higher and more consistent labneh yields achieved with MF treatments. Furthermore, the smooth, non-fibrous surfaces of the microfilters likely inhibited microbial attachment and biofilm formation during repeated cycles of use, cleaning, and sanitization. In contrast, the rough, porous surface of cheesecloth fibers provides an ideal environment for microbial colonization, especially within microfibers and microcracks that are difficult to reach with standard cleaning protocols. Surface roughness and porosity are well-documented factors that enhance microbial adhesion and biofilm development, reducing the effectiveness of conventional sanitization measures [Cheng et al., 2019; Zheng et al., 2021]. This phenomenon may also help explain the significantly higher microbial counts observed in the cheesecloth samples compared to those treated with microfilters (Table 1).
Kinetics of whey drainage
Although statistical analysis revealed no significant differences (p≥0.05) in the volume of whey drained among treatments at individual time points up to 180 min, a clear overall pattern emerged: microfilters with larger pore sizes promoted faster whey separation (Figure 4). This trend is consistent with the results shown in Figure 1B, where MFs with smaller pore sizes retained more moisture, leading to reduced whey drainage and consequently lower TS and fat content in the final product. In contrast, MF75 and the traditional cheesecloth demonstrated greater drainage efficiency, facilitating faster whey removal and yielding products with higher TS and fat contents.
Figure 4
Kinetics of whey drainage of labneh produced by straining through polyamide microfilters (MFs) with different pore sizes (10–75 μm) and the traditional cheesecloth (control).
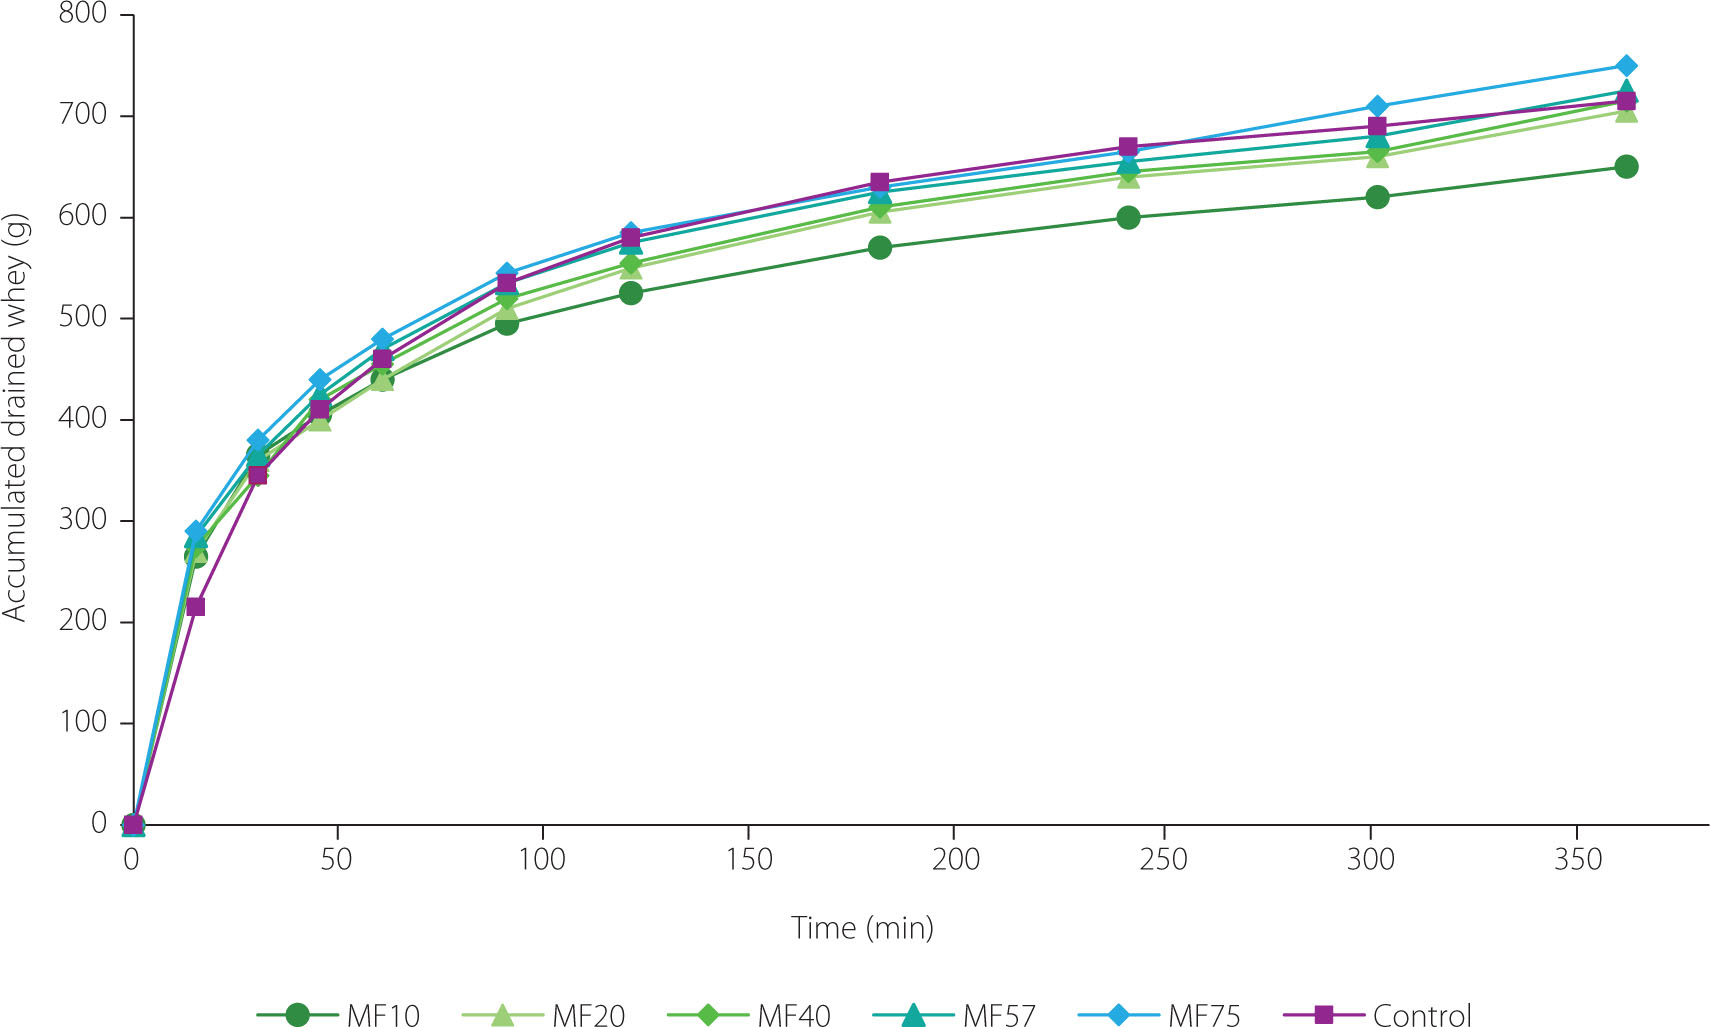
The cotton-based cheesecloth, composed of hydrophilic cellulose fibers, displayed dynamic pore behavior during straining. As whey was absorbed by the fibers, the cellulose swelled, effectively reducing the pore size and slowing the drainage rate over time. This phenomenon likely explains the more pronounced slope reduction of the drainage curve during the whey separation period compared to the MF treatments (Figure 4). Nevertheless, the control sample maintained the highest whey drainage rate beyond 120 min, suggesting that despite fiber swelling, the effective pore size remained larger than that of most synthetic MFs. Whey separation via cheesecloth may also be influenced by capillary and osmotic forces acting across the hydrophilic membrane. The continuous diffusion of whey through the cellulose matrix, possibly driven by concentration gradients and osmotic flow, adds to the complexity of the drainage mechanism [Fauzi et al., 2020].
Regardless of the treatment, the drainage curves (Figure 4) consistently showed a declining slope over time, reflecting reduced whey flow as the labneh structure became denser. This effect was especially pronounced in MFs with larger pores (MF40–MF75), where increased gel network strength, resulting from progressive whey loss, reduced the availability of free water and slowed syneresis. This mechanism is consistent with findings in similar dairy gels, where gel strengthening and reduced gravitational flow over time were associated with lower whey mobility and syneresis [Reig et al., 2021]. Results of regression analysis in Table 2 show that the cheesecloth demonstrated the highest drainage rate (slope =156.67), whereas MF10 showed the lowest one (117.81), highlighting an inverse relationship between filter fineness and whey flow rate. All treatments exhibited excellent linear fit (R2>0.99), confirming that a linear model could accurately describe drainage behavior over time. The intercept values further suggest lower initial whey loss when using finerpore filters.
Table 2
Linear regression parameters of whey drainage kinetics for labneh strained using cheesecloth (control) and polyamide microfilters (MFs) with different pore sizes (10–75 μm).
| Parameter | Control | MF10 | MF20 | MF40 | MF57 | MF75 |
|---|---|---|---|---|---|---|
| Slope | 156.67 | 117.81 | 131.09 | 137.66 | 137.75 | 141.07 |
| Interception | −188.32 | −43.22 | −75.76 | −106.70 | −93.58 | −98.19 |
| R-square | 0.9925 | 0.9975 | 0.9976 | 0.9961 | 0.9969 | 0.9973 |
Apparent viscosity and flow behavior
All samples exhibited non-Newtonian shear-thinning behavior (n<1), with viscosity decreasing from 8.33 Pa×s at 36 s-1 to 0.10 Pa×s at 3,600 s-1 (Figure 5). This pattern is characteristic of pseudoplastic (shear-thinning) flow behavior, where increasing shear disrupts the internal structural network, reduces resistance, and enhances spreadability [Yang et al., 2021].
Figure 5
Apparent viscosity of labneh prepared by straining through cheesecloth (control) and polyamide microfilters (MFs) with different pore sizes (10–75 μm).
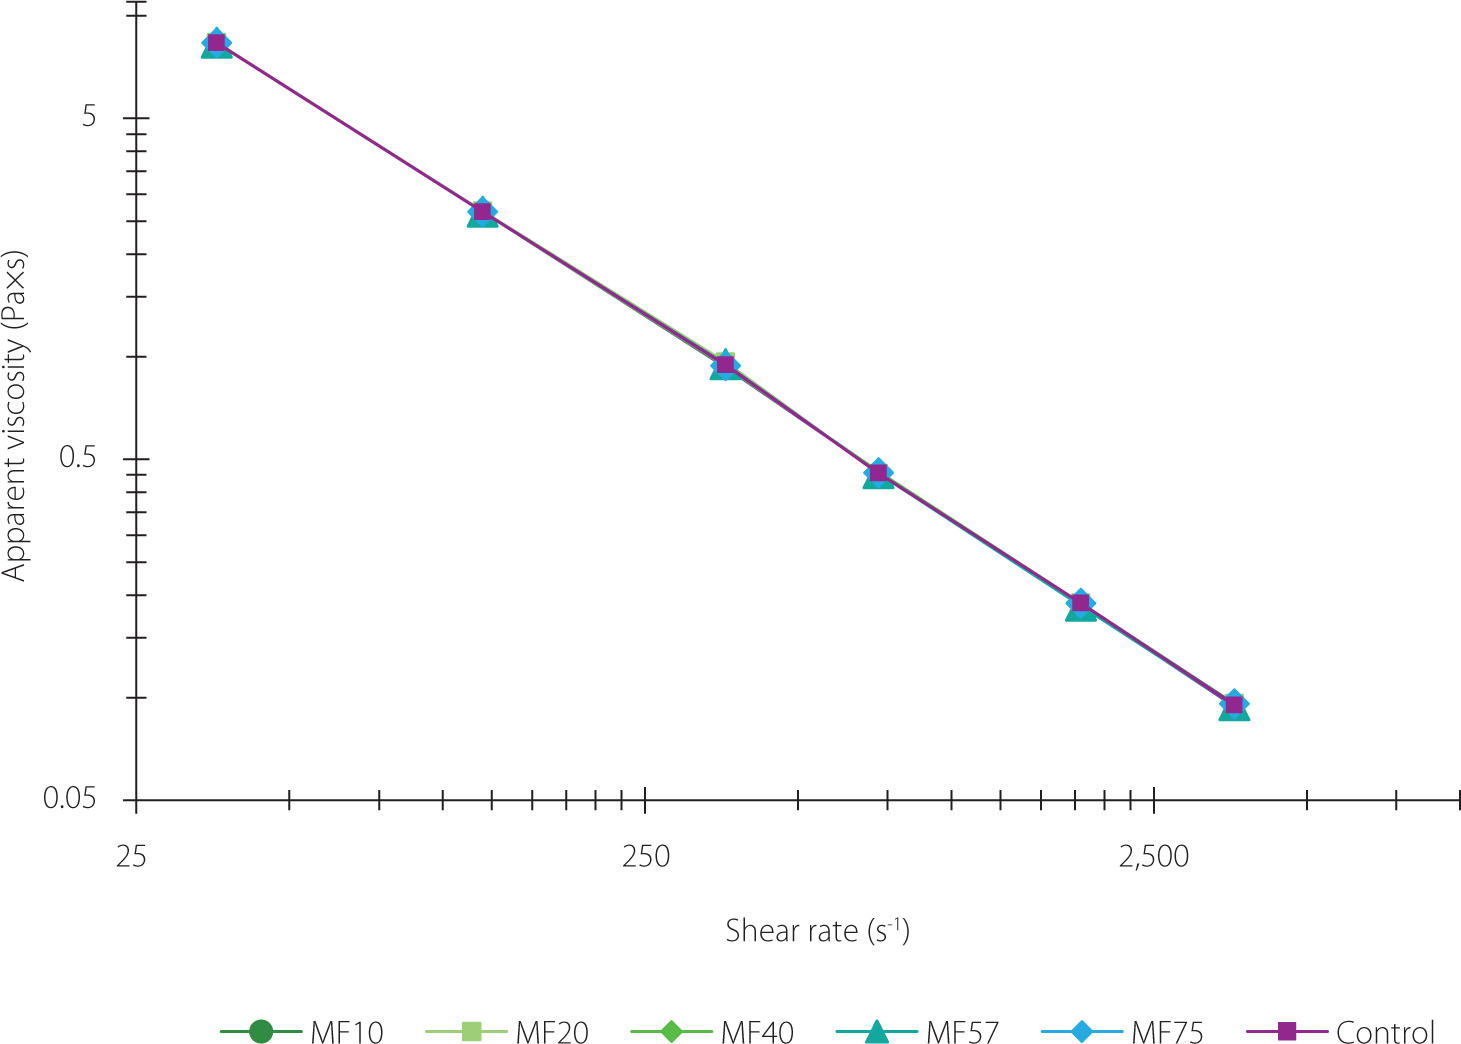
The observed decline in apparent viscosity at higher shear rates can be attributed to the progressive disruption of weak electrostatic and hydrophobic interactions within the protein matrix, leading to the breakdown of the gel structure and facilitating easier flow. Comparable behavior has been reported in dairy emulsions, where shear disrupts fat globule membranes and protein aggregates, resulting in reduced viscosity under high shear conditions [Biglarian et al., 2022]. No significant differences (p≥0.05) were observed in the viscosity-shear rate trends between MF-treated and control samples, suggesting that the overall structural integrity remained consistent regardless of filtration method. This observation is consistent with previous studies on traditional labneh produced by cheesecloth, which also exhibited shear-thinning and thixotropic behavior, fitting well with power-law rheological models [Mohameed et al., 2004].
TS content is a critical factor influencing labneh’s rheological characteristics. Mohameed et al. [2004] reported that a 5 g/100 g increase in TS nearly doubled the apparent viscosity (from 26 to 60 Pa×s at 2.2 s-1), highlighting the importance of solids concentration. In the present study, although TS varied slightly due to differences in filter pore size, these variations were statistically insignificant (p≥0.05) and did not substantially affect viscosity outcomes. Bhaskaracharya et al. [2024] confirmed that labneh rheology is strongly influenced by fat content, moisture level, and hydrocolloid presence. Furthermore, Vareltzis et al. [2016] emphasized the principal role of the casein matrix in water retention and viscosity maintenance, suggesting that whey separation is predominantly controlled by protein network dynamics rather than by the diffusion of free water.
Texture properties
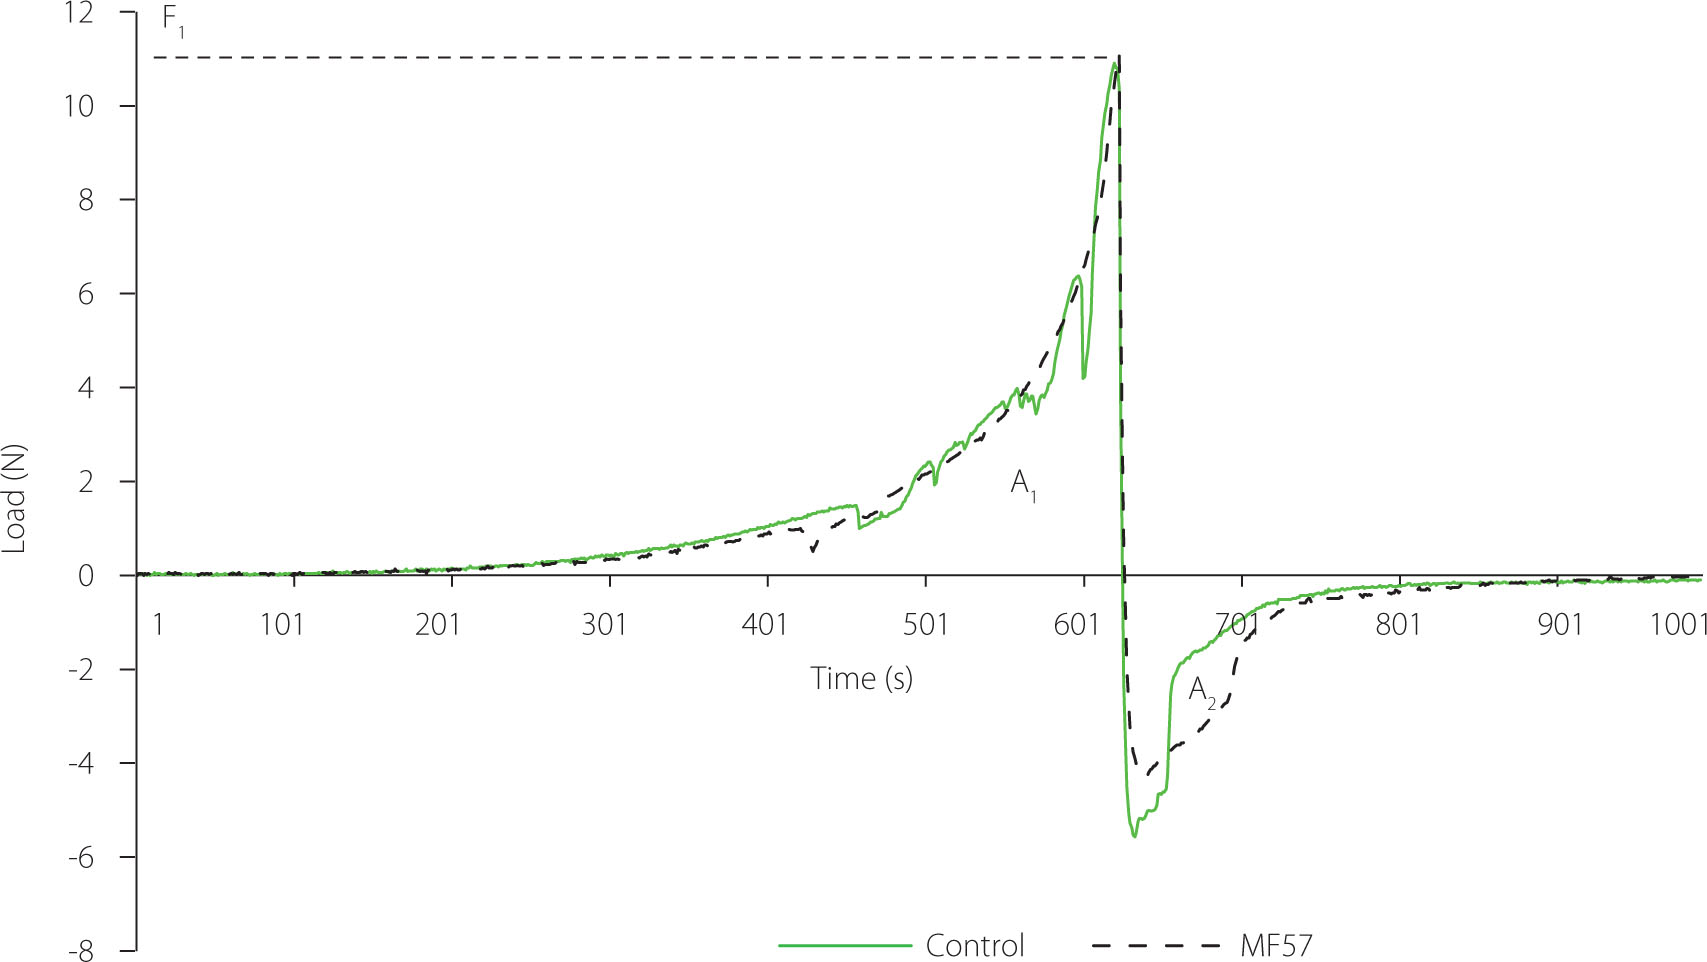
During texture analysis, the probe was initially positioned 7 mm above the sample surface and moved downward to a depth of 47 mm, corresponding to the bottom of the test container. As the probe compressed the sample, the force required to deform it was continuously recorded over the deformation time. The peak force observed during this downward motion represents the hardness (F1) at the time-force curve (Figure 6). Following maximum compression, the probe began to withdraw from the sample. During this phase, two additional mechanical parameters were derived: hardness work (HW), measured as the area under the positive region of the curve (A1), and adhesion, represented by the negative area (A2). The representative time-force profiles of control and labneh produced using MF57 (Figure 6) showed similar overall patterns; however, the control sample exhibited a more spiked curve during compression, suggesting a less uniform internal structure and the presence of local weaker points [Ahmed et al., 2020]. This elevated variability likely reflects inconsistencies in the internal structure and reduced compositional uniformity in labneh produced using cheesecloth. In contrast, MF57 samples demonstrated more consistent textural measurements, indicating improved homogeneity and reproducibility.
Figure 6
Texture analysis profile (load vs. time) of labneh prepared by straining through cheesecloth (control) and polyamide microfilter with pore size 57 μm (MF57). Hardness (F1) corresponds to the peak force, hardness work (HW) is the area under the positive curve (A1), and adhesion is the negative area (A2).
Key texture attributes, hardness, HW, and adhesion, were significantly influenced by the pore size of the microfilters. Hardness ranged from 4.3 N (MF10) to 24.7 N (MF75), with the control sample showing an intermediate value of 11.6 N (Figure 7A). The control’s hardness was significantly (p<0.05) higher than that of MF10 and MF20 but lower than that of MF75, and not significantly different from that of MF40 and MF57. In comparison, lower hardness values (0.3–1.6 N) have been reported for commercial labneh and for overrun dairy cream (1.1–4.5 N), likely due to their lower total solids content, simpler structural composition, differences in processing conditions, and the influence of product temperature at the time of measurement [Bhaskaracharya et al., 2024; Biglarian et al., 2022].
Figure 7
Texture parameters of labneh prepared by straining through cheesecloth (control) and polyamide microfilters (MFs) with different pore sizes (10–75 μm): (A) hardness and (B) hardness work (HW) and adhesion. Different letters indicate significant differences (p<0.05) among treatments within the same parameter.
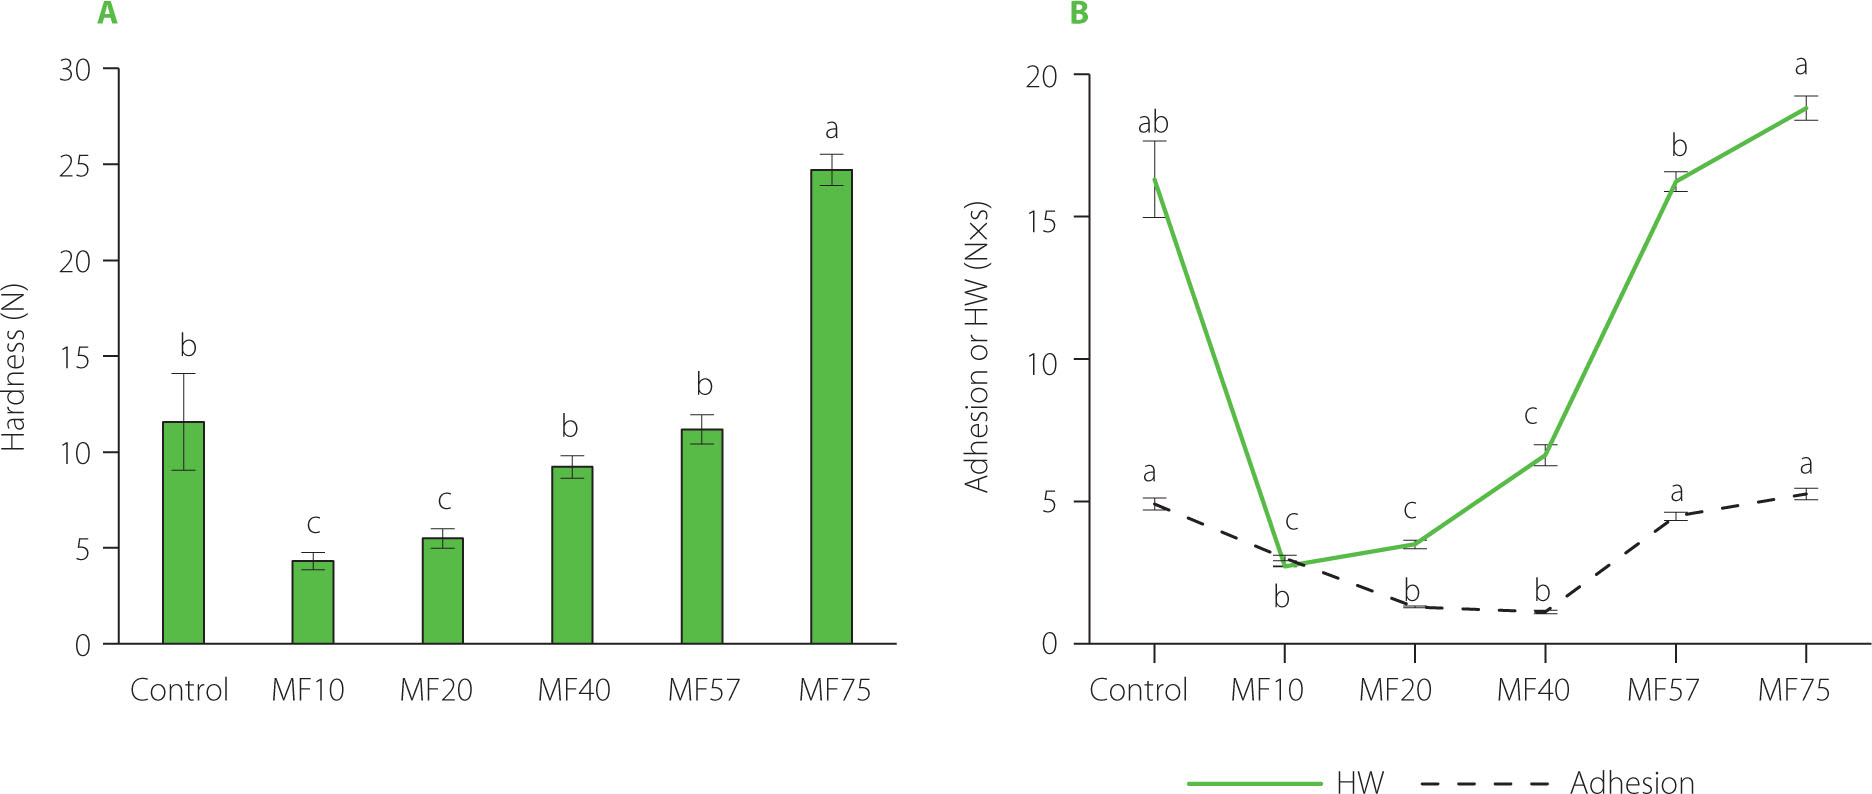
HW for labneh samples ranged from 2.7 N×s (MF10) to 18.8 N×s (MF75) (Figure 7B). Statistical analysis demonstrated that HW, likewise hardness, increased significantly with larger pore size (p< .05) from MF40 to MF75, suggesting that smaller pore sizes enhance spreadability. The control exhibited the value of 16.3 N×s, which was not significantly different (p≥0.05) from those of MF57 and MF75, suggesting these filters most closely replicate traditional texture. In contrast, MF10 and MF20 had significantly lower (p<0.05) HW, consistent with their higher moisture retention (Figure 1B). These findings align with ranges reported for commercial full-fat cream cheese, where HW varies from 10.6 to 85 N×s and hardness from 3.7 to 26.5 N depending on fat content and temperature [Brighenti et al., 2008]. Moisture content played a critical role; samples with lower TS exhibited reduced hardness and HW, supporting the plasticizing effect of moisture [Singh et al., 2013]. The control labneh also demonstrated greater variability, with coefficients of variation of 21.7% for hardness and 8.2% for HW, whereas the MF-treated samples displayed lower variability, suggesting more consistent texture and internal structure in the MF-treated groups.
Adhesion of labneh ranged from 1.1 N×s (MF40) to 5.3 N×s (MF75) (Figure 7B). The control sample showed an adhesion value of 4.9 N×s, not significantly different (p≥0.05) from MF57 and MF75 (4.5 N×s). Comparable adhesion ranges (2.5–14.2 N×s) have been reported for spreadable processed goat cheese, while lower values (0.05–0.79 N×s) have been observed in commercial labneh [Bhaskaracharya et al., 2024; Burgos et al., 2020]. The observed variations in adhesion are influenced by chemical composition, test conditions, measurement parameters, and fixture geometry [Khule, et al., 2024].
Sensory analysis
Sensory attributes assessed included overall acceptability, softness, color, taste, granulation, and saltiness (Figure 8). Overall acceptability scores ranged from 6.63 to 7.30 out of 9, while softness, taste, and saltiness also fell within relatively narrow ranges, indicating comparable sensory performance across treatments. All samples and the control exhibited a clean, natural white appearance, with color scores ranging from 7.73 to 8.13. No statistically significant differences (p≥0.05) were observed among treatments for most sensory attributes, except for granulation, where the control sample scored significantly higher (p<0.05) than the MF-treated samples. This indicates that the use of MFs not only maintained labneh’s sensory quality but also contributed to a reduction in granulation, enhancing overall textural smoothness.
Figure 8
Sensory evaluation scores of labneh produced by straining through the cheesecloth (control) and polyamide microfilters (MFs) with different pore sizes (10–75 μm).
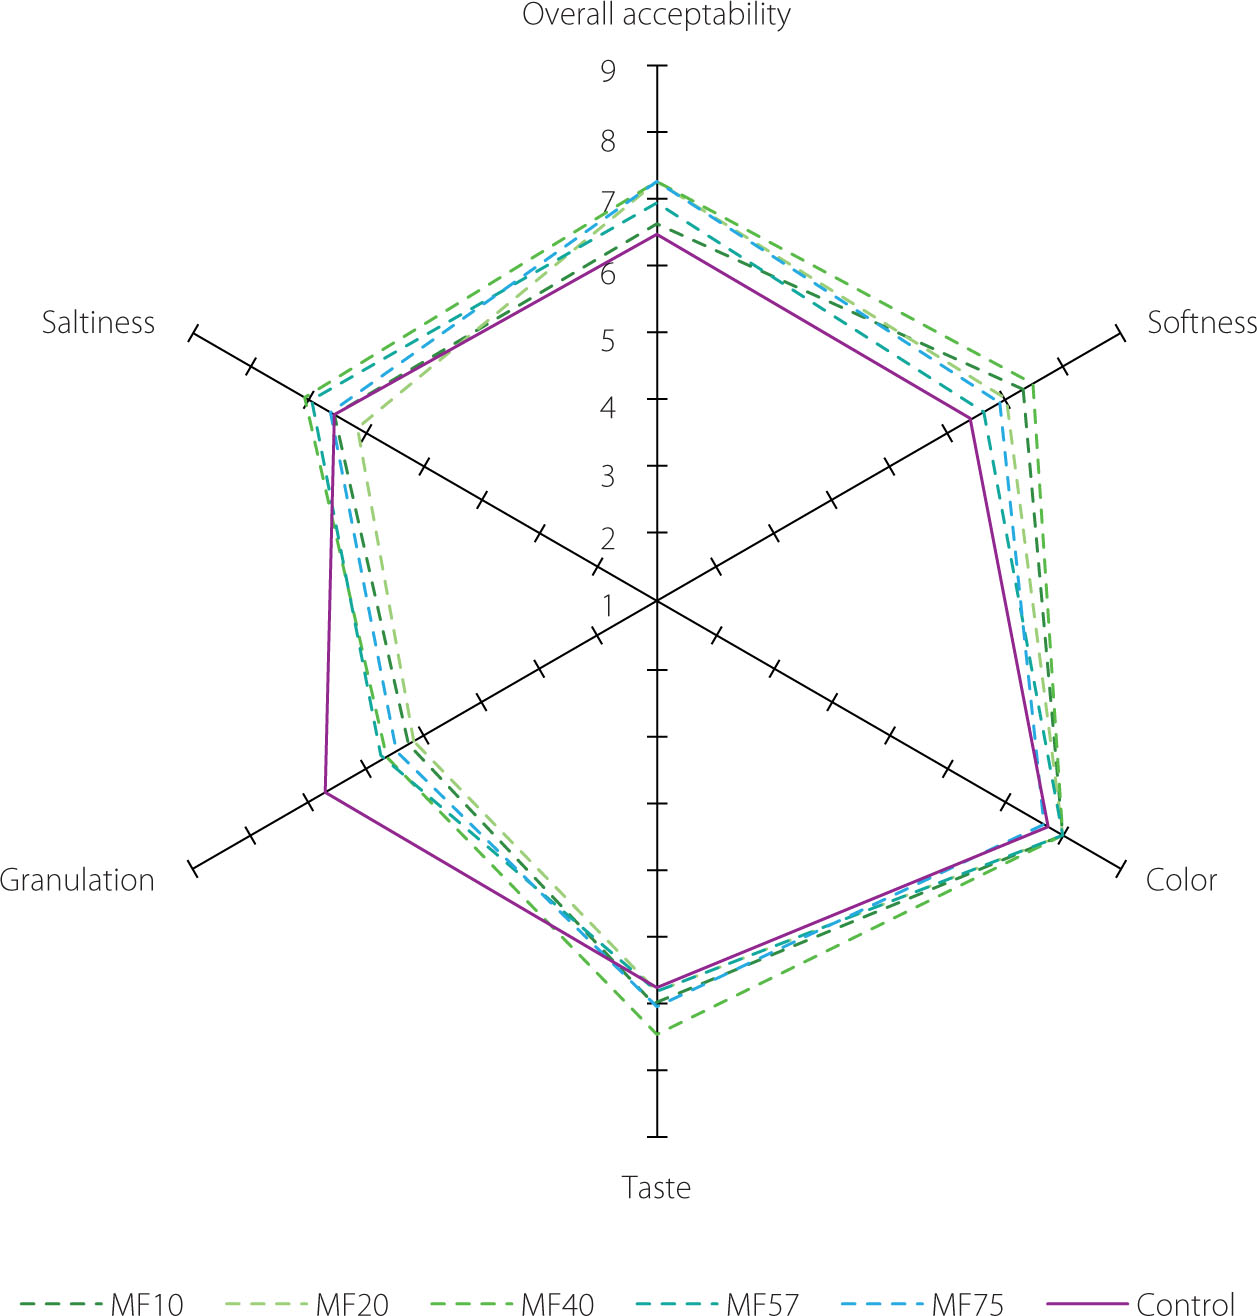
These findings are consistent with previous studies. Shamsia & El-Ghannam [2012] found no significant sensory differences between labneh prepared by traditional methods and labneh made from ultrafiltration (UF) retentate. In turn, Khider et al. [2022] reported that labneh produced via UF concentration was favored for its smooth texture, appealing appearance, and superior organoleptic properties than the traditional labneh. These results suggest that substituting cheesecloth with MFs does not compromise labneh’s sensory profile. The strong sensory acceptability observed across MF-treated samples supports their potential for maintaining consumer satisfaction. Moreover, the relatively low perception of acidity despite lower pH and higher titratable acidity values (Figure 2) may be explained by the masking effect of higher fat content, which has been shown to suppress sour flavor perception in dairy products [Zhou et al., 2022].
CONCLUSIONS
This study demonstrates that polyamide microfilters (MFs) provide a novel and superior alternative to traditional cheesecloth in labneh production. Their use improved yield recovery, enhanced hygienic performance, and preserved desirable sensory qualities without compromising product identity, while also providing more uniform hardness and spreadability. Labneh produced using MFs demonstrated, in general, consistent quality across treatments. Among them, MF57 was the most comparable to cheesecloth in terms of total solids, fat content, hardness, hardness work, and adhesion. In other attributes, all MFs either matched the performance of cheesecloth (e.g., drainage kinetics and apparent viscosity) or outperformed it (e.g., microbial quality). In addition to these quality improvements, polyamide MFs offer clear economic and operational advantages. Unlike cheesecloth, which deteriorates quickly, MFs are durable, reusable, and withstand repeated cleaning and sanitization, thereby reducing replacement costs and chemical use. Their standardized pore sizes and mechanical strength enable integration into automated dairy lines, supporting industrial scale-up without compromising quality. Furthermore, FDA food-contact certification and resistance to microbial adhesion enhance safety and compliance, positioning MFs as a sustainable and scalable solution for commercial labneh production. Future work should validate these results under industrial-scale conditions and evaluate long-term cost savings to support commercial adoption.