ABBREVIATIONS
ABTS, 2,2′-azino-bis(3-ethylbenzothiazoline-6-sulfonic acid); BSA, bovine serum albumin; DPPH radical, 2,2-diphenyl-1-picrylhydrazyl radical; FTIR, Fourier transform infrared; HG, homogalacturonan; HPGPC, high-performance gel permeation chromatography; PCA, principal component analysis; pNPG, p-nitrophenyl-α-d-glucopyranoside; RG-I, rhamnogalacturonan-I; RG-II, rhamnogalacturonan-II; RRTPs, Rosa roxburghii Tratt. polysaccharides; TGA, thermogravimetric analysis; XRD, X-ray diffraction.
INTRODUCTION
Rosa roxburghii Tratt., commonly known as Cili because of its thorny fruits, is an edible fruit species mainly cultivated in the mountainous regions of southwestern China. Guizhou Province is the core area of commercial production, where large differences in altitude, climate, and cultivation conditions may contribute to variation in fruit quality and bioactive composition [Jain et al., 2024]. The fruit is valued as a functional food resource because it is rich in ascorbic acid, phenolic compounds, organic acids, triterpenoids, superoxide dismutase, and polysaccharides [Wang et al., 2021; Wang et al., 2022a]. Several cultivars or types, including ‘Guinong 1’, ‘Guinong 5’, ‘Guinong 7’, and ‘Seedless Cili’, are currently used in production. Among them, ‘Guinong 5′ is widely cultivated in Guizhou because of its strong adaptability, disease resistance, stable yield, and good processing suitability [Li et al., 2022]. Therefore, using this cultivar as a unified material can reduce cultivar-related interference and allow a more focused comparison of source-associated variation among producing areas.
Within this compositional background, R. roxburghii Tratt. polysaccharides (RRTPs) deserve particular attention because they represent one of the major macromolecular bioactive compounds of the fruit. Previous studies have shown that RRTPs can exhibit antioxidant activity, prebiotic potential, and hypoglycemic and hypolipidemic effects in experimental models [Wang et al., 2020; Wang et al., 2023]. These activities are closely related to structural features, such as monosaccharide composition, uronic acid content, molecular weight, glycosidic linkages, and chain conformation. Many RRTPs are acidic pectic polysaccharides. Pectin generally contains homogalacturonan (HG), rhamnogalacturonan-I (RG-I), and rhamnogalacturonan-II (RG-II) domains; HG is mainly formed by linear α-(1→4)-linked d-galacturonic acid residues, whereas RG-I contains alternating rhamnose and galacturonic acid residues with arabinose- and galactose-rich side chains [Voragen et al., 2009]. Therefore, differences in HG/RG-I domain distribution may strongly influence the physicochemical behavior and bioactivity of RRTPs.
The antioxidant capacity and carbohydrate-hydrolyzing enzyme inhibitory activity of plant polysaccharides are especially relevant for functional food development. Polysaccharides may prevent oxidative damage by donating hydrogen or electrons and by chelating pro-oxidant metal ions; these effects are often affected by uronic acid content, molecular weight, charge density, and chain exposure [Fernandes & Coimbra, 2023]. In addition, inhibition of α-amylase and α-glucosidase can slow starch digestion and glucose release, thereby helping to attenuate postprandial hyperglycemia [Gong et al., 2020; Zheng et al., 2019]. For R. roxburghii, purified acidic polysaccharides and crude polysaccharide fractions have shown α-glucosidase inhibitory activity and glucose-modulating effects, indicating that RRTPs may be useful as food-derived ingredients for glycemic management [Wang et al., 2018a; Wang et al., 2019].
Source-associated variation is an important issue for plant polysaccharides because raw material origin can affect the extraction yield, structural characteristics, physicochemical properties, and bioactivity of the resulting polysaccharides. Such effects have been reported for pectins and polysaccharides from mango peel, jujube fruit, and Gracilaria chouae, where cultivar, growth region, or producing area influenced chemical composition, molecular characteristics, rheological behavior, and bioactivity of the resulting pectin or polysaccharide preparations [Deng et al., 2020; Feng et al., 2025; Li et al., 2024]. However, most studies on RRTPs have used materials from a single location or have focused on extraction methods and processing conditions. Systematic comparison of RRTPs from major commercial sources under a unified cultivar background remains limited. It is therefore unclear whether RRTPs from different producing areas differ in pectic domain composition, molecular weight distribution, physicochemical properties, antioxidant capacity, and digestive enzyme inhibitory activity. Accordingly, this study compared RRTPs extracted from ‘Guinong 5’ fruits collected from eight major producing areas in Guizhou Province. The polysaccharides were evaluated for extraction yield, chemical composition, monosaccharide profile, pectic domain distribution, molecular weight, Fourier transform infrared spectra, crystallinity, particle behavior, thermal stability, antioxidant capacity, and inhibition of α-amylase and α-glucosidase. Correlation analysis and principal component analysis were further used to explore structure-activity relationships. This study aimed to identify source-associated differences among RRTPs and to provide a scientific basis for raw-material selection, quality standardization, and targeted development of R. roxburghii polysaccharides as functional food ingredients.
MATERIALS AND METHODS
Materials and chemicals
All Rosa roxburghii Tratt. fruits (RRT) used in this study were collected from the same cultivar (‘Guinong 5’) within a single harvest year from eight major producing areas in Guizhou Province, China: Panzhou, Shuicheng, Longli, Hezhang, Qixingguan, Sinan, Congjiang, and Zheng’an. To improve representativeness and reduce individual-plant bias, fruits from multiple healthy plants within each region were pooled to prepare a composite regional sample. This sampling strategy was adopted to better reflect source-associated characteristics at the regional level under a controlled cultivar background. The sampling sites, geographic coordinates, and altitudes are presented in Table 1. Because the present work was designed as a comparative study of source-associated variation rather than a direct environmental causality analysis, site-specific soil and meteorological parameters were not monitored. All fruit batches were transported under refrigerated conditions (4–8°C) before drying and extraction.
Table 1
Collection sites of Rosa roxburghii Tratt. (RRT) fruits and corresponding polysaccharide sample codes.
Monosaccharide standards, including galactose (Gal), mannose (Man), rhamnose (Rha), xylose (Xyl), glucose (Glc), arabinose (Ara), fucose (Fuc), glucuronic acid (GlcA), galacturonic acid (GalA), ribose (Rib), fructose (Fru), glucosamine (GlcN), galactosamine (GalN), guluronic acid (GulA), mannuronic acid (ManA), and N-acetyl-d-glucosamine (GlcNAc), were obtained from Tokyo Chemical Industry Co., Ltd. (Tokyo, Japan). α-Amylase, α-glucosidase, p-nitrophenyl-α-d-glucopyranoside (pNPG), and bovine serum albumin (BSA) were purchased from Yuanye Biotechnology Co., Ltd. (Shanghai, China). All remaining reagents were of analytical or chromatographic grade and were procured from local suppliers.
Isolation of polysaccharides from Rosa roxburghii Tratt. fruits
Polysaccharides were isolated by ultrasonic-assisted hot-water extraction under our previously optimized conditions [Chen & Kan, 2018]. Fresh fruits from the eight regions were rinsed to remove surface debris, the calyx and stem ends were trimmed, and tissues were cut into small pieces. Material was dried in a hot-air oven (DHG-9240, Shanghai Jinghong Instrument Equipment Co., LTD, Shanghai, China) at 50°C, milled, and sieved (60 mesh). Defatting and decolorization were performed by soaking the powder in petroleum ether at a solid to liquid ratio of 1:4 (w/v) at room temperature for 24 h with continuous stirring. Solvent was refreshed every 8 h. The mixture was vacuum-filtered, and the residue was soaked in 95% ethanol under identical conditions, followed by vacuum filtration and drying. Pretreated powder (10 g) was suspended in distilled water (400 mL) and subjected to ultrasonication (40 kHz, 150 W) at 80°C for 33 min using an SC25-12 DTD bath sonicator (Ningbo Scientz Biotechnology Co., Ltd., Ningbo, China). The extract was concentrated to one-quarter of the initial volume using a rotary evaporator (R-215, Buchi, Flawil, Switzerland) at 54°C under reduced pressure. Proteins were removed by the Sevag method: Sevag reagent (chloroform : n-butanol, 4:1, v/v) was added, the mixture was agitated at 180 rpm for 10 min, and phases were allowed to separate; the lower organic phase and interfacial protein layer were discarded, and the upper aqueous phase was retained. This step was repeated until no protein emulsion remained. The aqueous phase was transferred into regenerated cellulose dialysis tubing with a molecular weight cutoff of 8,000–14,000 Da (Yuanye Bio-technology Co., Ltd., Shanghai, China) and dialyzed against distilled water for 48 h. Polysaccharides were precipitated by adding four volumes of ethanol, collected, and freeze-dried to yield the final products. Samples of Rosa roxburghii Tratt. polysaccharides (RRTP) obtained from fruits collected in different areas of Guizhou were designated as RRTP-CJ (Congjiang), RRTP-HZ (Hezhang), RRTP-LL (Longli), RRTP-PZ (Panzhou), RRTP-QXG (Qixingguan), RRTP-SC (Shuicheng), RRTP-SN (Sinan), and RRTP-ZA (Zhen’an). The extraction yield (%, w/w) was calculated as according to Equation (1):
Analysis of chemical composition of polysaccharides from Rosa roxburghii Tratt. fruits
Neutral sugar, uronic acid, and protein contents
Neutral sugar, uronic acid, and protein contents were determined colorimetrically. For neutral sugar determination, an RRTP solution was mixed with a phenol solution and concentrated sulfuric acid, incubated for color development, and measured at 490 nm using Glc as the standard [DuBois et al., 1956]. Uronic acid content was determined by the m-hydroxydiphenyl method; briefly, an RRTP solution was reacted with a sulfuric acid–borate reagent, followed by the addition of the m-hydroxydiphenyl reagent, and absorbance was recorded at 525 nm using GalA as the standard [Blumenkrantz & Asboe-Hansen, 1973]. Protein content was measured using the Coomassie Brilliant Blue G-250 method (Bradford protein assay), with absorbance recorded at 595 nm and BSA used as the standard [Zor & Selinger, 1996]. Results were calculated from the corresponding calibration curves and expressed as g of standard equivalent per 100 g of dried RRTP sample: g glucose equivalent/100 g for neutral sugars, g galacturonic acid equivalent/100 g for uronic acids, and g BSA equivalent/100 g for proteins. Results were calculated based on calibration curves using Glc for neutral sugars, yielding y = 0.0054 x + + 0.0711 (R2 = 0.9987, n = 6); BSA for protein, yielding y = 0.0039 x + + 0.4173 (R2 = 0.9985, n = 6); and GalA for uronic acids, yielding y = 0.0285 x + 0.0311 (R2 = 0.997, n = 6).
Monosaccharide composition
Monosaccharide profiles were determined by high-performance anion-exchange chromatography (HPAEC) on a Thermo Dionex ICS-6000 system (Thermo Scientific, Waltham, MA, USA) following a validated procedure [Shi et al., 2025]. Each RRTPs sample (6 mg) was hydrolyzed in 2 M trifluoroacetic acid (4 mL) at 121°C for 3 h. Following acid removal, hydrolysates were diluted to 50 mL with distilled water, filtered (0.22 μm), and injected (25 μL) onto a Dionex CarboPac PA20 analytical column (3×150 mm; Thermo Scientific) equipped with a guard cartridge. Separation was performed at 30°C, 0.5 mL/min, using ultrapure water (A), 40 mM NaOH (B), 500 mM sodium acetate (C), and 250 mM NaOH (D) under the following gradient program: 0–20.05 min, 90% A and 10% B; 20.05–53.05 min, 70% A, 20% B and 10% C; 53.05–60.00 min, 50% A and 50% D. Peak identification and compound quantification were carried out using sixteen monosaccharide standards (Tokyo Chemical Industry Co., Ltd., Tokyo, Japan) analyzed under identical conditions. The amount of each monosaccharide was calculated from its corresponding external calibration curve and converted to molar amount. Results were expressed as relative molar fractions (mol%), calculated as ni/Σni, where ni represents the molar amount of an individual monosaccharide and Σni represents the total molar amount of all identified monosaccharides in the same sample. For each RRTP sample, the sum of the identified monosaccharide fractions was normalized to 100. Pectic structural parameters were estimated from the relative molar fractions; HG and RG-I were calculated according to Equations (2) and (3), respectively:
Rha/GalA was used to indicate the relative contribution of the RG-I backbone; and (Ara + Gal)/Rha was used to indicate the relative degree of RG-I side-chain branching.
Determination of physicochemical properties of polysaccharides from Rosa roxburghii Tratt. fruits
Molecular weight distribution
Molecular-weight distributions were assessed by high-performance gel permeation chromatography (HPGPC) using Agilent 1260 system with a refractive-index detector (Agilent Technologies, Santa Clara, CA, USA) [Shi et al., 2025]. RRTPs were dissolved in a 0.1 M NaNO3 solution at 5 mg/mL and filtered through 0.45 μm membranes. Samples were separated on a TSK-Gel GMPWXL column (7.8 × 300 mm; Tosoh Bioscience, Tokyo, Japan) at 30°C. A 0.1 M NaNO3 solution was used as the mobile phase at a flow rate of 0.5 mL/min, and the injection volume was 25 μL. A calibration curve relating retention time to the logarithm of molecular weight (log Mw) was generated using dextran standards (6.3–739 kDa; Agilent Technologies).
Fourier transform infrared spectroscopy
Fourier transform infrared (FT-IR) spectra of RRTPs were acquired by the KBr-pellet method on a Spectrum Two FT-IR spectrometer (PerkinElmer, Waltham, MA, USA) as described by Shi et al. [2025]. For each run, RRTP samples (2 mg) were mixed with dry KBr (200 mg), finely ground in an agate mortar, and pressed into translucent disks. A blank KBr pellet was recorded as the background. Spectra were collected from 4,000 to 400 cm−1 at 4 cm−1 resolution to assign functional groups and backbone features.
Thermal stability
Thermal stability of RRTPs was evaluated by thermogravimetric analysis (TGA) on a DTG-60A instrument (Shimadzu, Kyoto, Japan) [Chen et al., 2025]. Approximately 5 mg of the sample was sealed in a high-purity aluminum crucible, with an empty crucible used as the reference. Heating was performed from 25°C to 800°C at 10°C/min under nitrogen (50 mL/min). The thermogravimetric (TG) curve and the derivative thermogravimetric (DTG) curve were calculated separately to resolve mass-loss stages and peak decomposition temperatures.
Structural characterization by X-ray diffraction analysis
X-ray diffraction (XRD) analysis of RRTPs was performed using a D8 Advance diffractometer (Bruker, Leipzig, Germany) equipped with a copper anode producing Cu Kα radiation (λ=1.5406 Å) and operated at 40 kV and 40 mA. Diffraction patterns were collected over 2θ = 5°–60° at a scan speed of 10°/min. Peak deconvolution analysis was performed to resolve the crystalline (Ab) and amorphous (Aa) regions within the polysaccharide samples. The crystallinity index (CrI, %) was calculated according to Equation (4) [Wang et al., 2022b]:
Zeta potential and particle size distribution
Surface charge and hydrodynamic size of RRTPs (2 mg/mL in Milli-Q water) were determined at 25°C by dynamic light scattering on a Nano ZS90 analyzer (Malvern Instruments, Worcestershire, UK), following Shi et al. [2025]. Zeta potential was reported in mV, and particle size was expressed as the intensity-weighted Z-average diameter (nm). To ensure reproducibility, polydispersity indices (PDI) were maintained below 0.40 for all preparations. Measurement parameters were as follows: refractive indices of 1.414 (dispersed phase) and 1.330 (continuous phase), solvent viscosity of 0.8872 cP, and a target signal intensity of 80 counts/s.
Antioxidant capacity analysis of polysaccharides from Rosa roxburghii Tratt. fruits
The antioxidant capacity of RRTPs was evaluated by DPPH•−, ABTS•+−, and O2•−-scavenging assays and by Fe2+-chelating assay. RRTP solutions were prepared in distilled water at 0.25, 0.50, 1.00, 1.50, 2.00, and 2.50 mg/mL. Ascorbic acid was used as the positive control for radical-scavenging assays, and ethylenediaminetetraacetic acid (EDTA) was used as the positive control for the Fe2+-chelating assay.
The DPPH•−scavenging assay was performed according to Brand-Williams et al. [1995], with appropriate modifications. An RRTP solution was mixed with a DPPH• ethanol solution and incubated in the dark at room temperature, after which the absorbance was measured at 517 nm. A reaction mixture in which the RRTP solution was replaced with distilled water served as the control, and a sample blank without DPPH• was used to correct the background absorbance of each RRTP solution. DPPH• scavenging activity was calculated as follows (Equation (5)):
where As is the absorbance of the sample reaction mixture, Ab is the absorbance of the sample blank, and A0 is the absorbance of the control.The ABTS•+-scavenging assay was performed according to Re et al. [1999], with appropriate modifications. The ABTS•+ working solution was prepared by reacting ABTS with potassium persulfate in the dark and subsequently diluting the mixture to an absorbance of 0.70 ± 0.02 at 734 nm. The RRTP solution was mixed with the ABTS•+ working solution and incubated at room temperature, after which the absorbance was measured at 734 nm. ABTS•+ scavenging activity was calculated using Equation (5).
The O2•−-scavenging assay was performed using the phenazine methosulfate (PMS) – reduced nicotinamide adenine dinucleotide (NADH) – nitroblue tetrazolium (NBT) system described by Nishikimi et al. [1972], with appropriate modifications. The reaction mixture contained the RRTP solution, NBT, NADH, and PMS in phosphate buffer. The reaction was initiated by adding PMS. Following incubation at room temperature, the absorbance was measured at 560 nm. A reaction mixture without RRTPs served as the control, and a sample blank without PMS was prepared to correct the background absorbance. O2•− scavenging activity was calculated using Equation (5).
The Fe2+ chelating assay was performed according to Dinis et al. [1994], with appropriate modifications, based on competition between RRTPs and ferrozine for Fe2+. Formation of the Fe2+–ferrozine complex was monitored at 562 nm, as originally described by Stookey [1970]. Briefly, the RRTP solution was mixed with the FeCl2 solution, and the reaction was initiated by adding the ferrozine solution. Following incubation at room temperature, the absorbance of the Fe2+–ferrozine complex was measured at 562 nm. A reaction mixture containing Fe2+ and ferrozine without RRTPs served as the control and represented 0% chelating activity. A sample blank without Fe2+ was used to correct the background absorbance of each RRTP solution. Fe2+-chelating activity was calculated according to Equation (6):
where As is the absorbance of the sample reaction mixture, Ab is the absorbance of the sample blank, and A0 is the absorbance of the control. In this assay, 100% chelating activity represents complete prevention of Fe2+–ferrozine complex formation after background correction.Dose–response curves were constructed using the activity values obtained at different RRTP concentrations. The concentration required to achieve 50% radical-scavenging activity was expressed as the half-maximal inhibitory concentration (IC50), whereas the concentration required to achieve 50% Fe2+-chelating activity was expressed as the half-maximal effective concentration (EC50).
Determination of in vitro hypoglycemic activity of polysaccharides from Rosa roxburghii Tratt. fruits
α-Glucosidase inhibitory activity
The α-glucosidase inhibitory activity of RRTPs was evaluated using a pNPG-based assay according to Tadera et al. [2006], with appropriate modifications. RRTP solutions were prepared in phosphate-buffered saline (PBS; 100 mM, pH 6.9) at concentrations of 0.5–7.0 mg/mL. α-Glucosidase solution (0.5 U/mL) and pNPG solution (6 mM) were also prepared in the same buffer. For each assay, 100 μL of the RRTP solution was combined with 100 μL of α-glucosidase solution and incubated at 37°C for 10 min. Subsequently, 100 μL of pNPG solution was added, and incubation was continued for 20 min at 37°C. Parallel controls were run in the absence of RRTPs and in the absence of enzyme; acarbose served as the positive control. Reactions were terminated with 1 mL of 1 M Na2CO3. Formation of p-nitrophenol was quantified at 405 nm using a microplate reader (Model 1500, Thermo Multiskan SkyHigh, Waltham, USA). Percentage inhibition was calculated according to Equation (7):
where Asample denotes the absorbance of the complete system (RRTP + enzyme + substrate), Acontrol-1 denotes the absorbance of the mixture in which α-glucosidase was replaced with the buffer, and Acontrol-2 denotes the absorbance of the mixture in which RRTP was replaced with the buffer. The IC50 value was defined as the RRTP concentration required to inhibit 50% of α-glucosidase activity. IC50 values were calculated from dose–response curves by plotting inhibition (%) against RRTP concentration and fitting the data by nonlinear regression.Inhibitory kinetics toward α-glucosidase
The inhibition kinetics of RRTPs against α-glucosidase (0.5 U/mL) were evaluated by measuring enzyme activity at different pNPG concentrations (1–4 mM) in the absence or presence of RRTPs (0, 3, and 5 mg/mL). The inhibition mode and mechanism were analyzed using Lineweaver–Burk double-reciprocal plots within the Michaelis–Menten framework [Lineweaver & Burk, 1934]. The data were analyzed according to the mixed-inhibition equation (Equation (8)), from which the Michaelis constant (Km) and maximal velocity (Vmax) were obtained. The slope and y-intercept of the Lineweaver–Burk plot were determined for each RRTP concentration. The dissociation constant for inhibitor binding to the free enzyme (Ki) was obtained from the absolute value of the x-intercept of the secondary plot of the Lineweaver–Burk slope versus inhibitor concentration (Equation (9)). The dissociation constant for inhibitor binding to the enzyme–substrate complex (Kis) was obtained from the absolute value of the x-intercept of the secondary plot of the Lineweaver–Burk y-intercept versus inhibitor concentration (Equation (10)) [Cornish-Bowden, 1974]. In Equations (8)–(10), v denotes the initial reaction rate, [S] stands for the substrate concentration, and [I] indicates the inhibitor concentration.
α-Amylase inhibitory activity
The α-amylase inhibitory activity of RRTPs was determined using the 3,5-dinitrosalicylic acid (DNS)-based amylase assay described by Bernfeld [1955], with appropriate modifications. Sample solutions were prepared in 0.02 M phosphate buffer (pH 6.9). Equal volumes of the RRTP solution (500 μL) and α-amylase (10 U/mL) were combined and incubated at 37°C for 10 min. Soluble starch (1%, 500 μL) was then added as a substrate, and incubation was continued for 10 min at 37°C. Reactions were terminated by adding the DNS reagent (1 mL) and heating in a boiling water bath for 5 min. After dilution with distilled water (10 mL) and cooling to ambient temperature, absorbance was recorded at 540 nm. Percent inhibition was calculated according to Equation (7). Acarbose was used as the positive control. The IC50 value was defined as the RRTP concentration required to inhibit 50% of α-amylase activity. IC50 values were calculated from dose–response curves by plotting inhibition (%) against RRTP concentration and fitting the data by nonlinear regression.
Statistical analysis
Data were presented as mean and standard deviation (SD). Before analysis, the normality of the residuals and homogeneity of variances were assessed using the Shapiro-Wilk and Levene tests, respectively. When these assumptions were satisfied, differences among the RRTP samples were evaluated by one-way analysis of variance (ANOVA). Duncan’s multiple range test was used for multiple comparisons among samples, whereas the least significant difference (LSD) test was used only for predefined pairwise comparisons. Differences were considered statistically significant at p<0.05, and all statistical tests were two-sided. Pearson correlation analysis was performed to examine the relationships among chemical composition, structural parameters, physicochemical properties, antioxidant capacity, and digestive-enzyme inhibitory activity of RRTPs. Correlations were expressed as Pearson’s correlation coefficients (r), with significance determined at p<0.05 or p<0.01. Principal component analysis (PCA) was performed on standardized variables using the correlation matrix to visualize the overall relationships and differences among the RRTP samples. Statistical analyses were conducted using IBM SPSS Statistics 23.0 (IBM Corp., Armonk, NY, USA), and figures were prepared using OriginPro 2021 (OriginLab Corp., Northampton, MA, USA).
RESULTS AND DISCUSSION
Yield and chemical composition of polysaccharides from Rosa roxburghii Tratt. fruits
Substantial differences in extraction yield (3.29% to 4.64%, w/w) were observed among RRTPs from different production areas (Table 2). The highest yield was obtained for RRTP-LL, followed by RRTP-SN, RRTP-CJ, and RRTP-ZA, whereas the lowest yields were recorded for RRTP-HZ and RRTP-QXG. Under the present sampling framework, these findings indicate marked source-associated heterogeneity among RRTPs from commercially-relevant producing areas. Because site-level environmental variables were not directly monitored, and all samples were collected from the same cultivar (‘Guinong 5’) within one harvest year, the observed differences are interpreted here as comparative production-source variation rather than evidence of specific climatic or edaphic effects. The results highlight production-source-associated variability of practical relevance to raw-material selection and quality standardization.
Table 2
Extraction yields, chemical composition, monosaccharide profile, pectic structural parameters, average molecular weight, particle size, and zeta potential of polysaccharides from Rosa roxburghii Tratt. fruits (RRTP) collected in different producing areas of Guizhou Province in China.
[i] Values are presented as mean ± standard deviation (SD) (n=3). Different letters within the same row indicate significant differences among samples (p<0.05). Fuc, fucose; Rha, rhamnose; Ara, arabinose; Man, mannose; Gal, galactose; Glc, glucose; Xyl, xylose; GalA, galacturonic acid; HG, homogalacturonan; RG-I, rhamnogalacturonan-I. Sample codes are listed in Table 1.
Neutral sugar contents varied significantly among the RRTP samples, ranging from 57.32 to 66.59 g/100 g (Table 2). RRTP-LL and RRTP-SC contained the highest levels and did not differ significantly (p≥0.05) from each other, whereas RRTP-QXG and RRTP-SN constituted the lowest-content group. RRTP-ZA, RRTP-PZ, RRTP-CJ, and RRTP-HZ showed intermediate values with partially overlapping significance groups. The observed range is comparable to the carbohydrate content reported for a hot-water-extracted RRT polysaccharide fraction (63.79 g/100 g) [Wang et al., 2018b] and to the range of 57.47–68.56 g/100 g observed in RRTPs obtained from fruits subjected to different drying treatments [Zhang et al., 2024]. These comparisons indicate that the present samples fall within the compositional range previously reported for water-extractable RRT polysaccharides, although direct quantitative comparisons should be made cautiously because raw-material pretreatment, extraction, purification, and analytical procedures differ among studies. Protein contents were uniformly low, ranging from 2.92 to 3.19 g/100 g, with no significant (p≥0.05) differences among the eight RRTP samples (Table 2). This result indicates a relatively small and consistent amount of co-extracted or retained protein. Uronic acid content displayed a broader range of 13.16–30.14 g/100 g and provided clearer compositional differentiation among the RRTP samples. RRTP-CJ contained significantly (p<0.05) more uronic acid than all the other samples. RRTP-LL, RRTP-PZ, RRTP-SC, and RRTP-ZA formed a statistically comparable intermediate group, followed by RRTP-HZ, whereas RRTP-QXG and RRTP-SN contained the lowest levels. Previous studies have reported a uronic acid content of 14.78 g/100 g in a hot-water-extracted RRT polysaccharide fraction [Wang et al., 2018a] and values of 15.46–22.16 g/100 g for RRTPs prepared from differently dried fruits [Zhang et al., 2024]. Thus, most of the present samples were within or close to the previously reported range, while the comparatively high value of RRTP-CJ suggests a greater abundance of acidic carbohydrate components. Given that uronic acid-rich pectic polysaccharides have been positively associated with antioxidant activities [Fernandes & Coimbra, 2023], the present data suggest that RRTPs from specific regions may possess enhanced functional properties and greater therapeutic potential.
Structural features of polysaccharides from Rosa roxburghii Tratt. fruits
Monosaccharide composition
The monosaccharide profile of RRTPs was analyzed using HPAEC. Representative chromatograms are presented in Figure S1 (Supplementary Materials), and the relative contents of identified monosaccharides are shown in Table 2. All eight RRTP samples contained the same eight monosaccharides, namely Rha, Fuc, Glc, Man, Xyl, Ara, Gal, and GalA. Despite this qualitative similarity, significant differences in their molar proportions were observed among the samples from different production sites, particularly for Ara, Gal, and GalA (Table 2). RRTP-CJ exhibited the highest GalA content (49.72 mol%), whereas RRTP-QXG and RRTP-SN had the lowest (21.92 and 22.76 mol%, respectively). These trends paralleled the uronic acid content, thereby reinforcing the regional structural heterogeneity of RRTPs. The predominance of GalA, Gal, and Ara – monosaccharides characteristic of pectic polysaccharides – indicated that RRTPs were primarily composed of pectin-type structures. Generally, three main domains are distinguished in the pectin structure: homogalacturonan (HG), rhamnogalacturonan-I (RG-I), and rhamnogalacturonan-II (RG-II). HG consists mainly of linear chains of α-(1→4)-linked GalA residues that may be partially methyl-esterified or acetylated, whereas RG-I contains an alternating Rha–GalA backbone bearing Ara- and Gal-rich side chains [Voragen et al., 2009]. Quantitative analysis revealed that RG-I constituted a substantial portion of the RRTPs, ranging from 46.24 to 76.17 mol% (Table 2). The highest RG-I contents were found in RRTP-QXG (76.17 mol%) and RRTP-SN (67.90 mol%), whereas RRTP-CJ exhibited the lowest value (46.24 mol%).
The Rha/GalA and (Ara + Gal)/Rha ratios were further calculated as compositional indicators of the relative contribution of RG-I backbone residues and the abundance of Ara- and Gal-containing side chains, respectively [Dimopoulou et al., 2019]. The Rha/GalA ratios of all RRTPs ranged from 0.09 to 0.25, consistent with the range of 0.05–1.00 commonly reported for RG-I-containing pectins [Schols & Voragen, 1996]. RRTP-QXG had the highest Rha/GalA ratio, whereas RRTP-QXG and RRTP-SN had the highest (Ara+Gal)/Rha ratios. In contrast, RRTP-CJ showed the lowest values for both indices and the highest estimated HG proportion (45.07 mol%), indicating a comparatively greater contribution of GalA-rich, less-branched regions. Together, these results demonstrate clear source-associated differences in monosaccharide composition and pectic domain distribution among RRTPs. RRTP-CJ had an elevated HG content and a relatively linear conformation, while RRTP-QXG exhibited the most extensive RG-I branching. Despite these architectural distinctions, all samples maintained high pectin purity. Such structural heterogeneity is expected to influence the physicochemical and functional properties of the polysaccharides and is therefore relevant to their targeted utilization in food and nutraceutical applications.
Molecular weight distribution
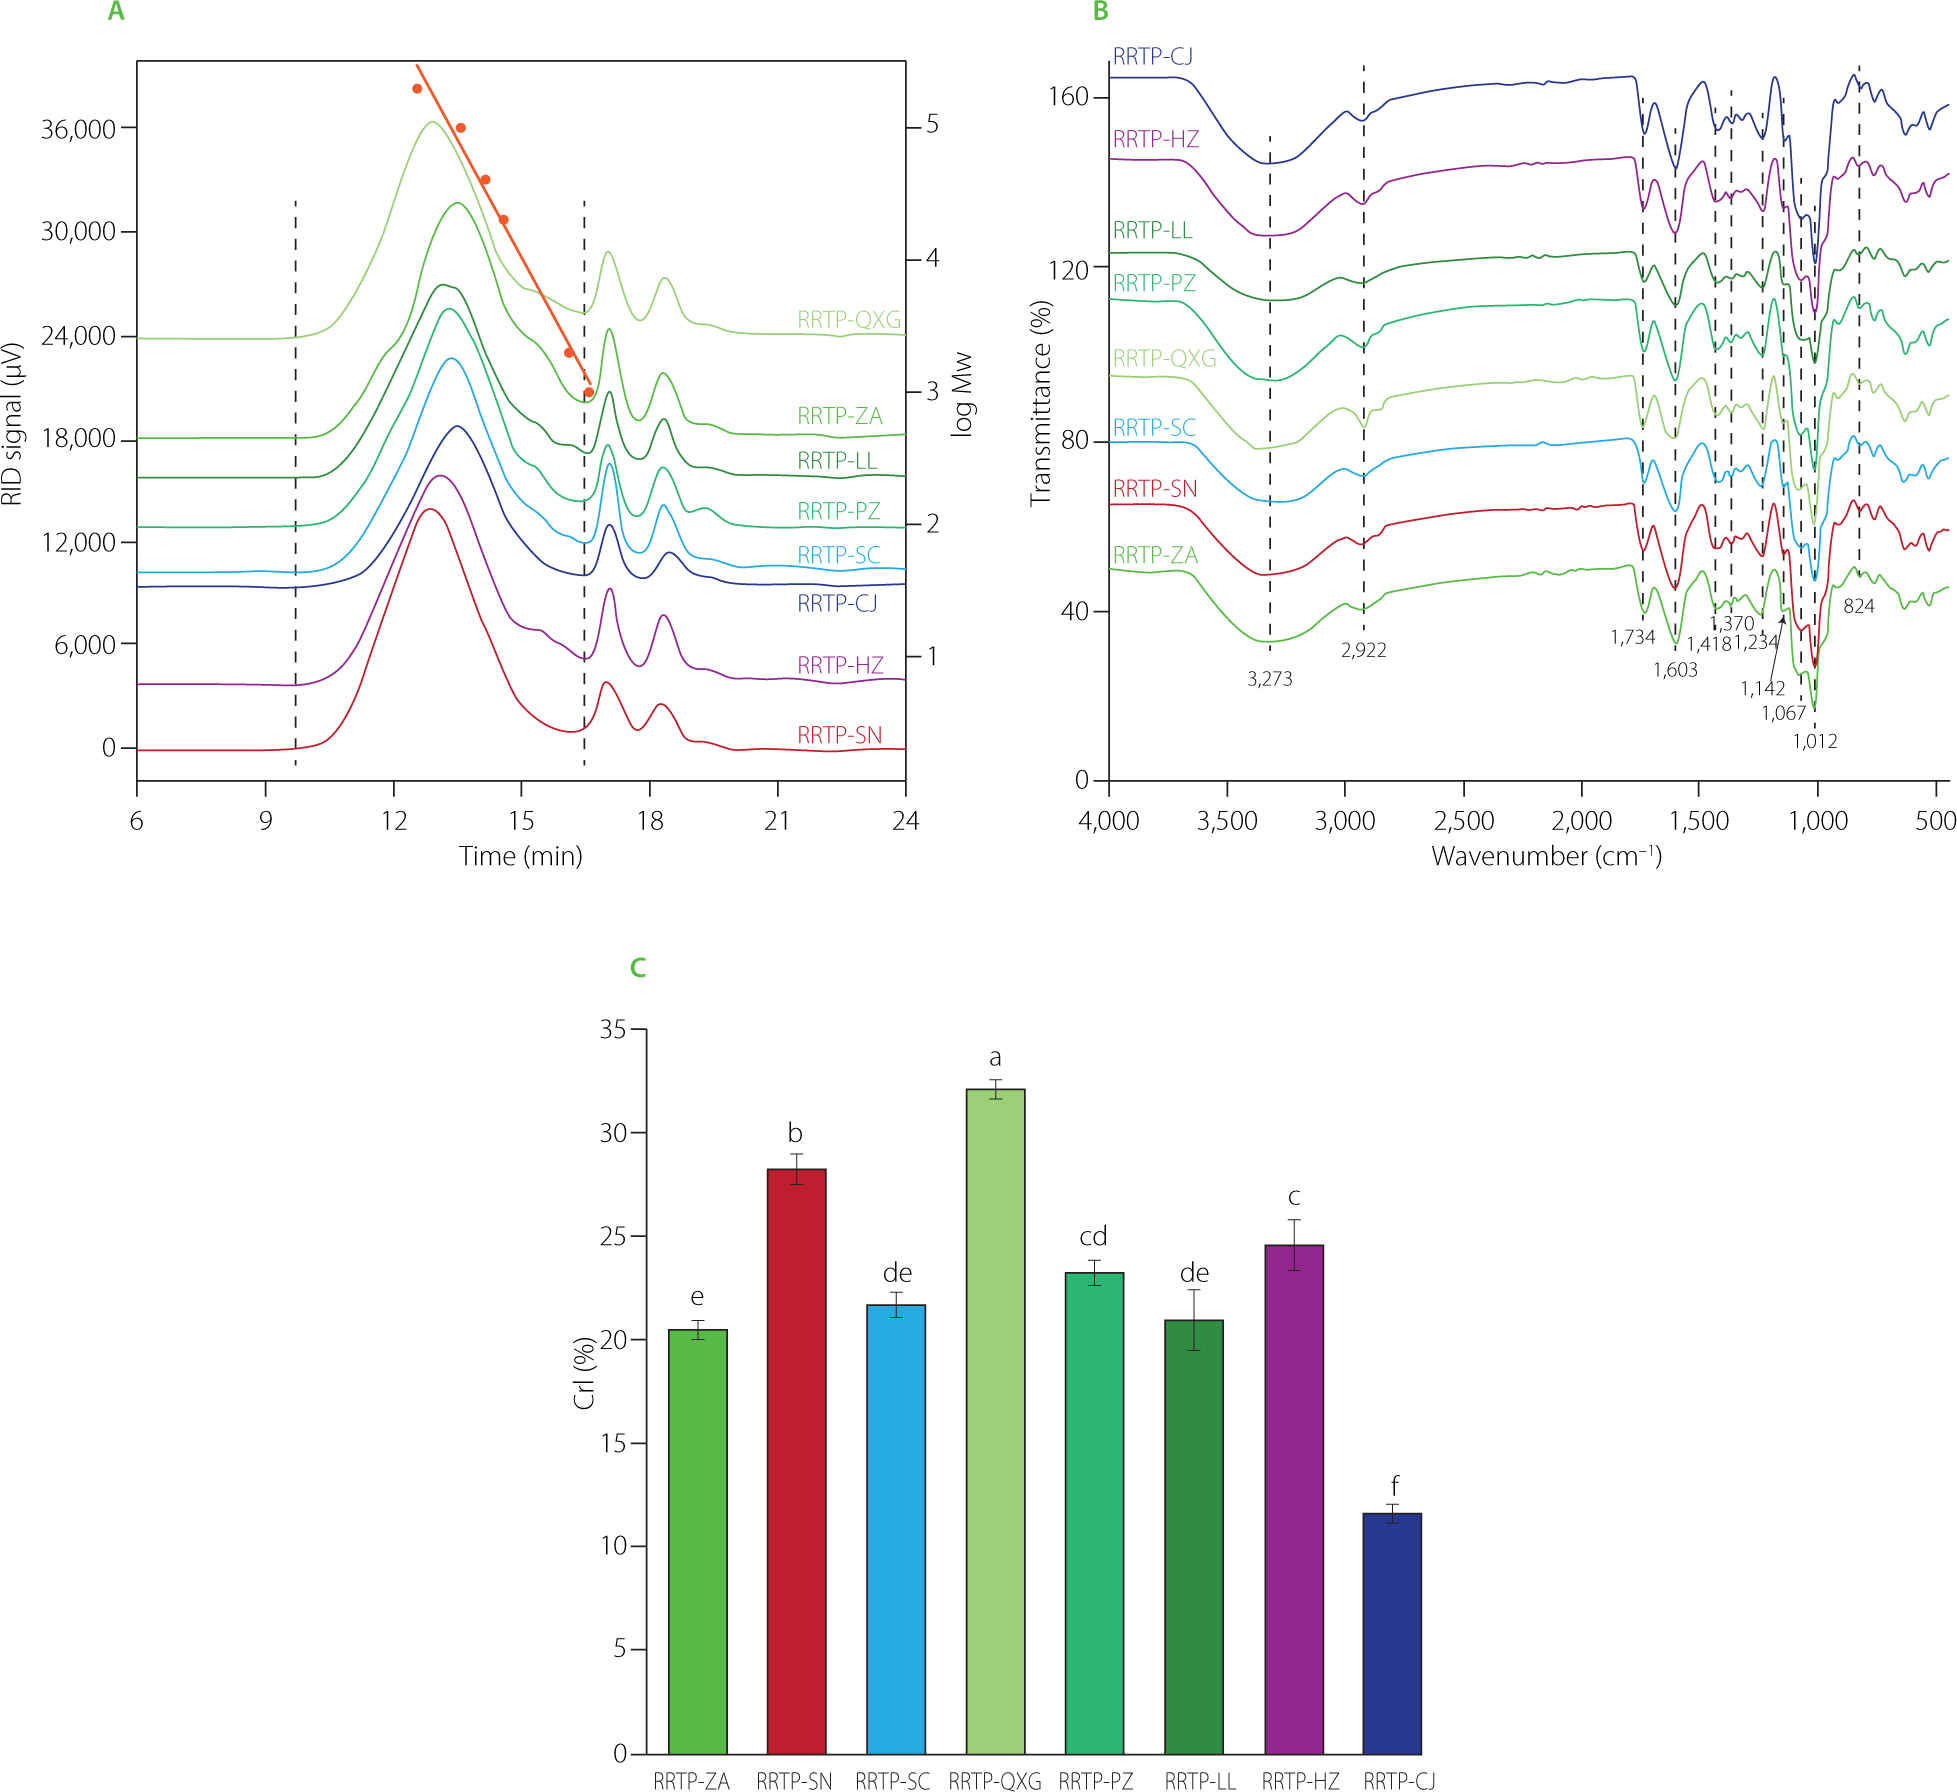
To evaluate source-associated variation, the molecular-weight characteristics of RRTPs from eight producing areas were analyzed by HPGPC. Calibration was performed using a dextran-based standard curve (Figure S2 in Supplementary Materials). Each chromatogram of RRTP separations showed a single dominant, near-Gaussian peak (Figure 1A), suggesting a relatively narrow apparent molecular weight distribution within each RRTP preparation. However, shifts in the retention time of the main peak were observed among samples, indicating significant differences in average molecular weight, which ranged from 77.8 to 181.1 kDa (Table 2). For comparison, the average molecular weights of R. roxburghii fruit polysaccharides obtained by hot-water, saline, alkaline, and citric-acid extraction were previously reported to range from 80.53 to 97.22 kDa [Chen et al., 2025]. The lower molecular weights observed in the present study were comparable to this range, whereas RRTP-LL, RRTP-HZ, RRTP-QXG, and RRTP-SN exhibited higher values. In turn, the average molecular weights observed here were lower than the value of 513.02 kDa reported for water-soluble polysaccharides from R. roxburghii by Wang et al. [2018b]. Therefore, the difference may be attributable to the variation in fruit material, extraction and post-extraction processing, which can influence the molecular-weight distribution of the recovered polysaccharides. Among the analyzed samples, RRTP-ZA and RRTP-CJ displayed the lowest average molecular weights (77.8 kDa and 80.6 kDa, respectively), whereas RRTP-QXG and RRTP-SN exhibited the highest values (179.4 kDa and 181.1 kDa, respectively). The higher average molecular weights of RRTP-QXG and RRTP-SN coincided with their higher Ara and Gal proportions and higher (Gal+Ara)/Rha ratios. This association is structurally plausible because the controlled enzymatic removal of specific pectic domains, including arabinan and galactan side chains, has been shown to progressively decrease the molecular weight of RG-I-rich citrus pectin [Wu et al., 2020]. Overall, these findings demonstrate clear source-associated differences in molecular-weight profiles among RRTPs, further supporting substantial supramolecular heterogeneity among samples from different producing areas.
Figure 1
High-performance gel permeation chromatography (HPGPC) separations of polysaccharides from Rosa roxburghii Tratt. fruits (RRTP) collected in different producing areas of Guizhou Province in China and the corresponding molecular-weight calibration curve (A), Fourier-transform infrared (FT-IR) spectra of RRTPs (B), and crystallinity index (CrI) obtained by X-ray diffraction (XRD) analysis. CrI values not sharing a common letter differ significantly (p<0.05). Mw, molecular weight; RID, refractive-index detector. Sample codes are listed in Table 1.
Fourier transform infrared spectroscopic characterization
Fourier-transform infrared spectroscopy was employed to identify the functional groups and backbone features of the RRTPs. The spectra of all eight samples showed a high degree of overlap (Figure 1B), indicating broadly similar functional-group profiles among the production sources. A broad, intense absorption band at 3,273 cm−1 was attributed to O–H stretching vibrations, while a peak at 2,922 cm−1 corresponded to aliphatic C–H stretching, confirming the polysaccharidic nature of the samples [Chen et al., 2025]. Signals at 1,734 cm−1 and 1,603 cm−1 were assigned to ester carbonyl stretching and asymmetric stretching of ionized carboxylate groups, respectively [Synytsya et al., 2003], which is the evidence for the presence of galacturonic acid residues. Weaker bands near 1,418 cm−1 and 1,370 cm−1 were consistent with C–H bending vibrations. In the range of 1,300–800 cm−1, multiple diagnostic peaks were identified: 1,234 cm−1 and 1,067 cm−1 were attributed to C–O and C–O–C stretching vibrations; 1,012 cm−1 reflected C–O–H bending of pyranose rings [Kačuráková et al., 2000]. A distinctive band at 824 cm−1 indicated α-glycosidic linkages [Barker et al., 1954]. Overall, the similar spectra support the presence of a common pectic-polysaccharide framework in all RRTPs.
Structural characterization
XRD analysis was conducted to qualitatively and semi-quantitatively evaluate the solid-state organization of RRTPs across amorphous, semicrystalline, and crystalline regions. The diffraction profiles of the eight RRTP samples are shown in Figure S3 in Supplementary Materials. All samples exhibited broad halos centered around ~22° (2θ), without sharp Bragg reflections, indicating a predominantly amorphous microstructure. A minor exception was observed for RRTP-QXG, which displayed weak and broadened features near ~12° and ~22° (2θ), suggestive of localized short-range ordering within an otherwise disordered matrix. Although the positions of these diffuse features, and hence the associated d-spacings, were largely conserved in all samples, variations in peak widths and intensities caused crystallinity indices (CrI) to vary from 11.7% to 32.1% (Figure 1C). The highest CrI was recorded for RRTP-QXG. This relatively high CrI may reflect more regular packing of some polysaccharide chains, resulting in localized short-range ordered domains within the predominantly amorphous matrix. Similar broad XRD profiles, characterized by diffuse diffraction features at approximately 20–23° and the absence of prominent sharp reflections, have previously been reported for polysaccharides extracted from R. roxburghii fruit [Chen et al., 2025; Zhang et al., 2024].
Particle size and zeta-potential
Particle size and zeta-potential distributions of the RRTP samples were shown in Figure S4 in Supplementary Materials, while average values are summarized in Table 2. All samples exhibited unimodal yet relatively broad particle size distributions, indicating compositional homogeneity within each preparation while also suggesting a general tendency toward aggregation. RRTP-ZA exhibited the largest particle diameter (705 nm), followed by RRTP-CJ (613 nm) and RRTP-SN (554 nm). RRTP-LL, RRTP-PZ, RRTP-SC, and RRTP-QXG showed statistically comparable particle sizes, whereas RRTP-HZ had the smallest diameter (362 nm). Notably, RRTP-ZA and RRTP-CJ displayed relatively large hydrodynamic diameters despite their low average molecular weights (77.8 and 80.6 kDa, respectively). This pattern may be associated with differences in the organization of their pectic domains. Both samples had comparatively low RG-I contents (57.41 and 46.24 mol%, respectively) and low (Gal+Ara)/Rha ratios (8.81 and 7.94, respectively), indicating a relatively limited contribution of Ara- and Gal-rich neutral side chains. The composition and length of RG-I side chains have been shown to influence pectin hydration, while enzymatic removal of arabinose residues can enhance intermolecular association and aggregation [Kaczmarska et al., 2024; Larsen et al., 2011]. Therefore, the less extensive neutral side chains of RRTP-ZA and RRTP-CJ may provide weaker hydration and steric shielding, allowing closer intermolecular contacts and the formation of larger hydrodynamic assemblies. In contrast, RRTP-HZ, RRTP-QXG, and RRTP-SN exhibited higher estimated RG-I contents and/or (Gal+Ara)/Rha ratios, suggesting more extensive neutral side-chain structures that may enhance hydration and steric separation between polysaccharide chains. This structural feature may partly account for their smaller particle dimensions relative to their apparent molecular weights.
Zeta-potential measurements showed net negative surface charges across all RRTPs, ranging from −12.5 mV (RRTP-QXG) to −20.8 mV (RRTP-CJ) (Table 2 and Figure S4B in Supplementary Material). RRTP-CJ exhibited the most negative zeta potential, whereas RRTP-QXG and RRTP-SN showed the lowest absolute values and did not differ significantly (p≥0.05) from each other. The negative charge of these polysaccharides was mainly attributable to the dissociation of carboxyl groups in GalA-containing pectic domains. Consistent with its relatively high uronic acid content, RRTP-CJ possessed a greater negative surface charge, indicating stronger electrostatic repulsion between dispersed polysaccharide particles [Lutz et al., 2009]. In addition to uronic acid content, differences in the accessibility and ionization of carboxyl groups, as well as the molecular conformation of the polysaccharides, may also contribute to the variation in zeta potential among the RRTP samples. An absolute zeta potential of approximately 30 mV is commonly regarded as an empirical boundary for dispersions stabilized predominantly by electrostatic repulsion [Uskoković, 2012]. The absolute zeta-potential values of all RRTP samples were below this level, indicating relatively limited electrostatic stabilization and a tendency toward intermolecular association in aqueous solution. Among the samples, the more negative zeta potential of RRTP-CJ may nevertheless provide comparatively stronger electrostatic repulsion and better dispersion stability.
Thermal properties
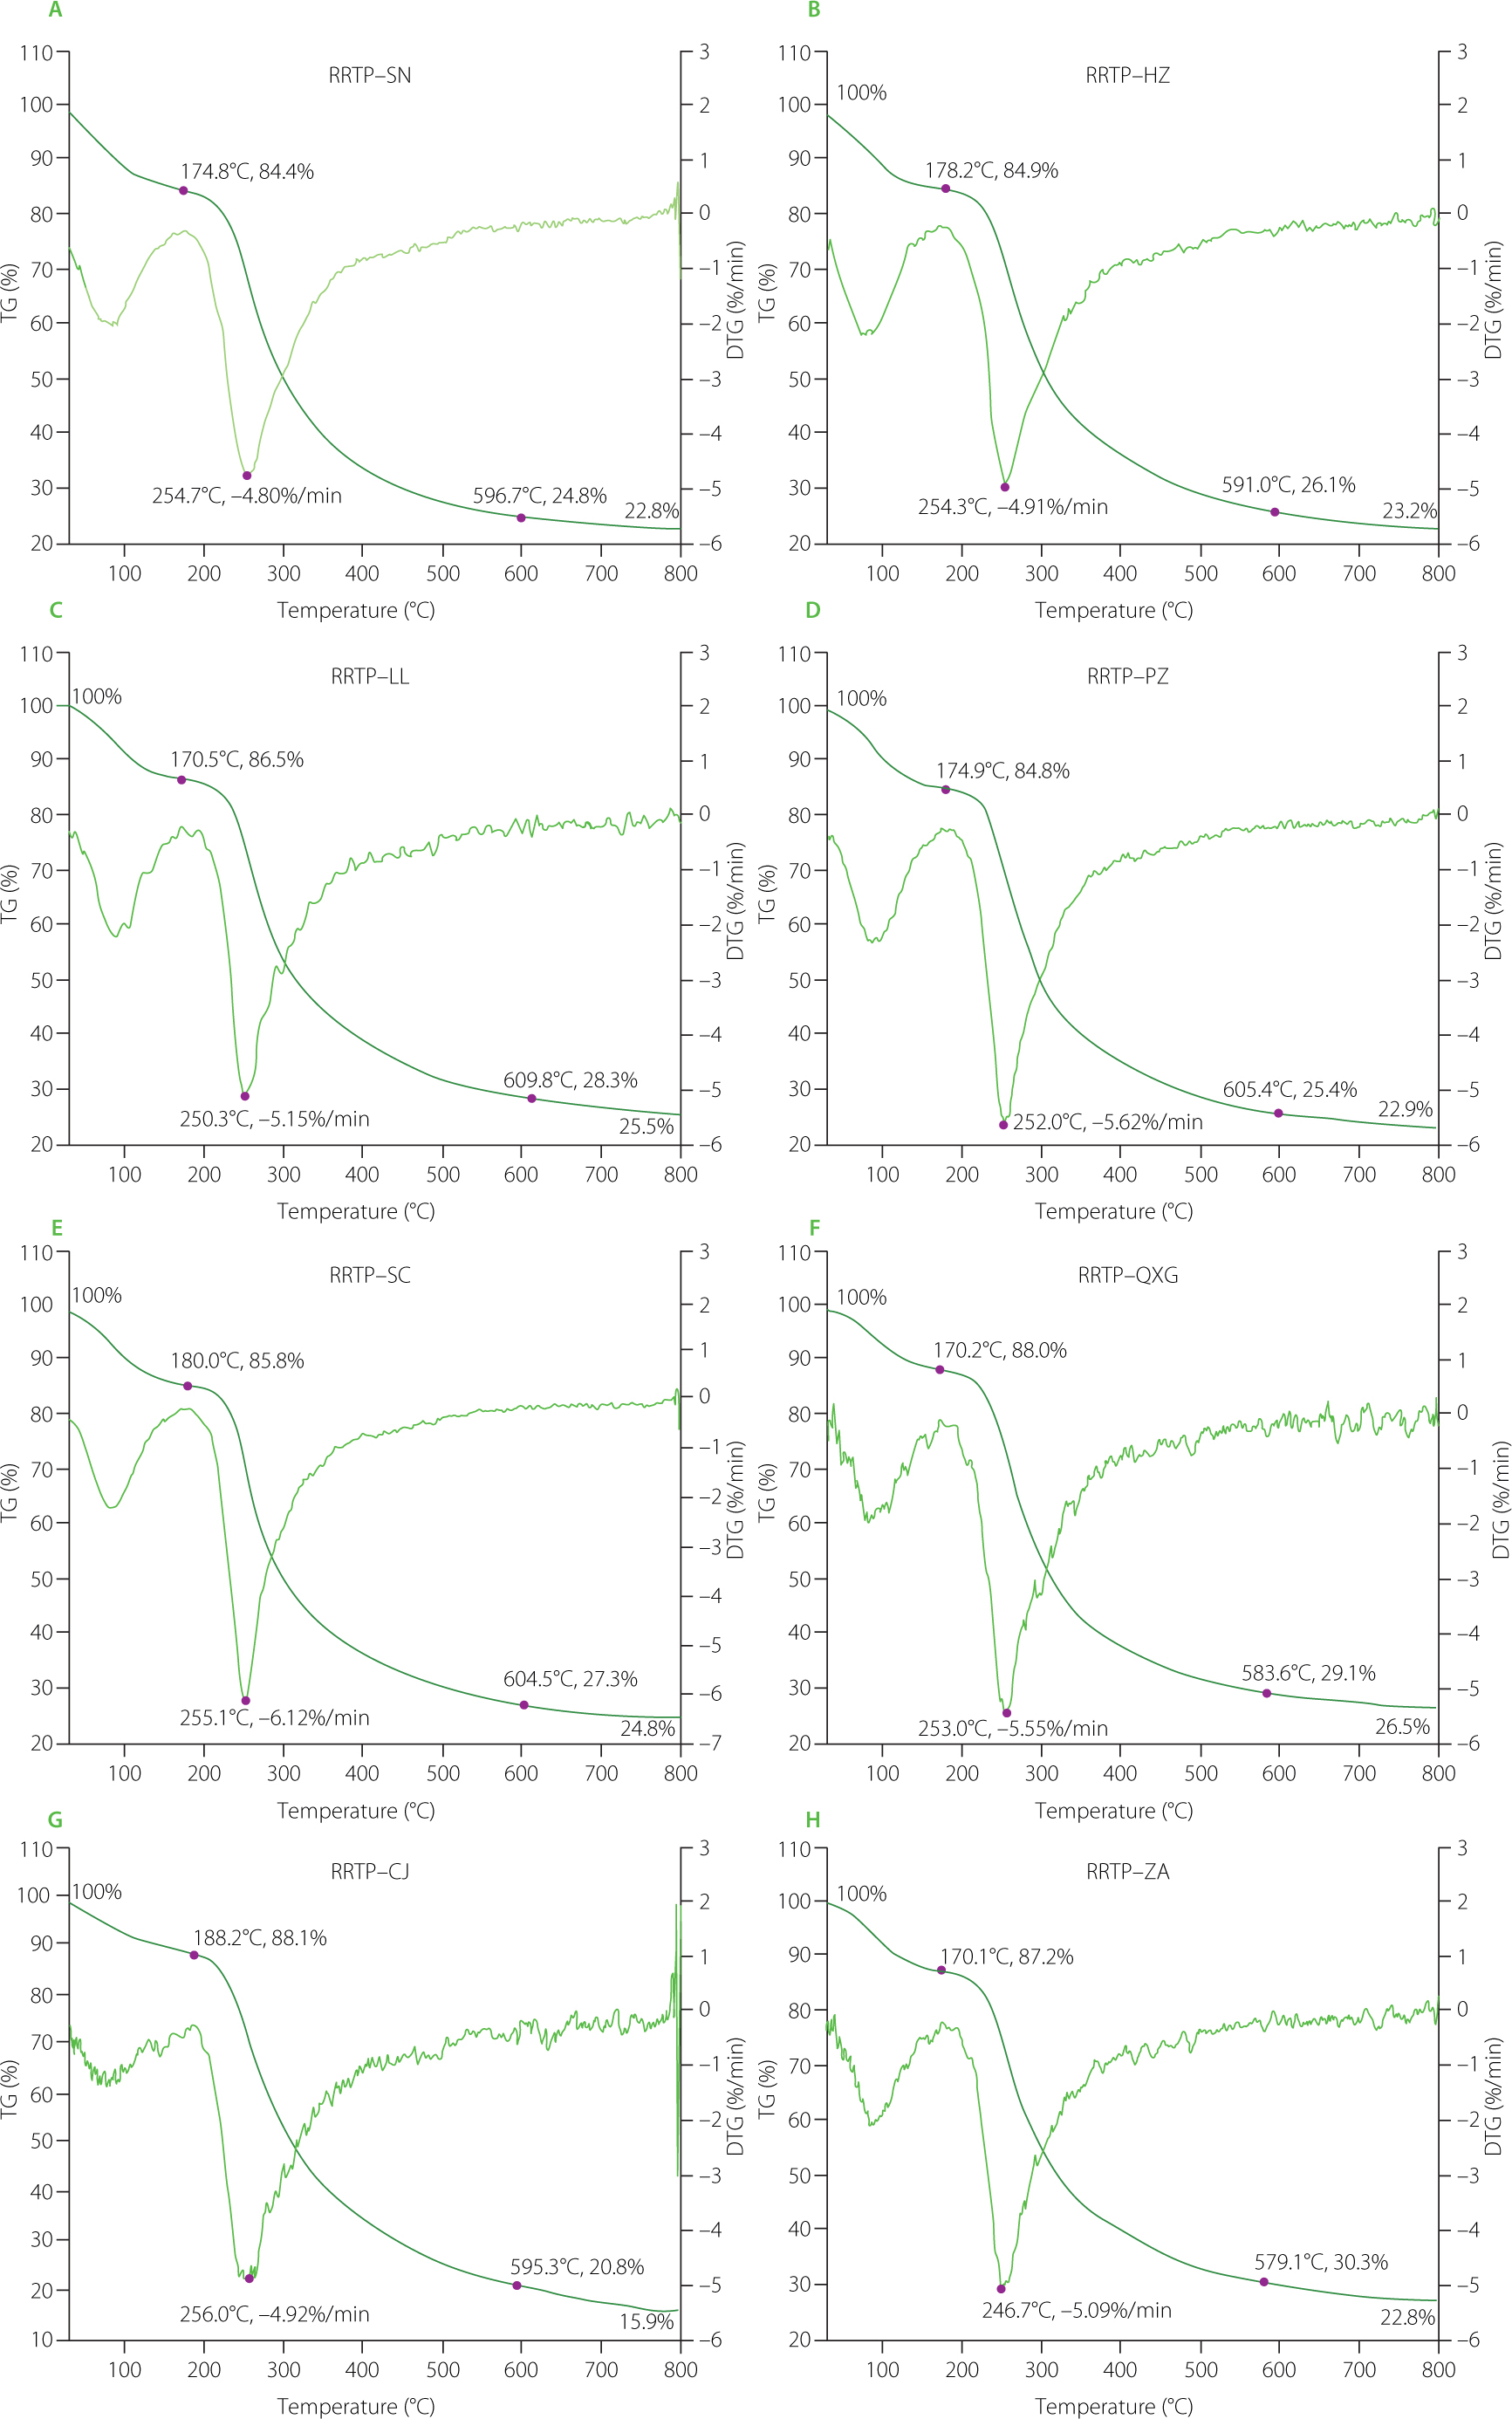
Thermogravimetric analysis reflects the thermal stability of RRTPs, which is an important parameter for evaluating their suitability as functional food ingredients. The TG and DTG curves are presented in Figure 2. Heating from 25 to 800°C revealed three distinct stages of thermal degradation. Stage I corresponded to the evaporation of free and bound water and accounted for 11.9% to 15.6% of mass loss. The highest moisture losses were observed for RRTP-SN (15.6%), RRTP-PZ (15.2%), and RRTP-HZ (15.1%), while RRTP-CJ (11.9%) and RRTP-QXG (12.0%) exhibited the lowest losses, reflecting differences in water-binding capacity. Stage II represented the principal decomposition phase, characterized by cleavage of glycosidic linkages and degradation of polysaccharide side chains [Aburto et al., 2015]. RRTP-SC, RRTP-PZ, and RRTP-QXG showed the lowest peak decomposition rates (−6.12%, −5.62%, and −5.55%/min, respectively), indicating greater thermal resilience than the other samples. Stage III involved the breakdown of more recalcitrant structures, including C–O bond cleavage and terminal disruption of the glycosidic backbone [Aburto et al., 2015]. RRTP-ZA and RRTP-CJ exhibited the greatest mass losses during this phase, consistent with lower structural resistance under high thermal stress. Among all samples, RRTP-CJ demonstrated the lowest overall thermal stability. Despite exhibiting the highest onset temperature for stage II degradation (188.2°C), it incurred the largest stage II mass loss (67.3%), the greatest cumulative loss (84.1%), and retained the lowest residual mass (15.9%) at 800°C. In contrast, RRTP-QXG exhibited superior thermal resistance, with a relatively lower peak decomposition rate, the smallest total mass loss (73.5%), and the highest residual mass at terminal temperature. These thermal behaviors were closely associated with structural characteristics. A higher molecular weight, a high RG-I content, and greater side-chain complexity, reflected by elevated (Gal+Ara)/Rha ratios, have been reported to enhance thermal stability in pectic polysaccharides [Deng et al., 2020]. RRTP-QXG, which exhibited the highest values of these parameters, showed the greatest thermal stability, whereas RRTP-CJ, with comparatively lower values, was the least stable. Collectively, these findings indicate that the thermal performance of RRTPs is governed primarily by molecular architecture, especially molecular weight distribution and branching complexity. Understanding these structure–property relationships is important for evaluating RRTPs from different production areas and for guiding their targeted utilization in food systems requiring specific thermal tolerance.
Figure 2
Thermogravimetric (TG) and derivative thermogravimetric (DTG) curves of polysaccharides from Rosa. roxburghii Tratt. fruits (RRTP) collected in different producing areas of Guizhou Province in China including Sinan, RRTP-SN (A); Hezhang, RRTP-HZ (B); Longli, RRTP-LL (C); Panzhou, RRTP-PZ (D); Shuicheng, RRTP-SC (E); Qixingguan, RRTP-QXG (F); Congjiang, RRTP-CJ (G), and Zheng’an, RRTP-ZA (H).
Antioxidant capacity of polysaccharides from Rosa roxburghii Tratt. fruits
Plant polysaccharides have been repeatedly shown to act as antioxidants [Fernandes & Coimbra, 2023]. To evaluate the antioxidant capacity of RRTPs obtained from fruits collected in eight geographically distinct regions, they were subjected to four in vitro antioxidant assays, in which scavenging activity against DPPH•, ABTS•+ and O2•−, and ability to chelate ferrous-ions were determined. All RRTP samples exhibited a concentration-dependent increase in DPPH radical scavenging activity (Figure 3A). The IC50 values revealed the following order of antioxidant capacity: RRTP-CJ > RRTP-SC = RRTP-PZ > RRTP-LL ≥ RRTP-ZA ≥ RRTP-HZ > RRTP-QXG > RRTP-SN. Notably, RRTP-CJ achieved 94.22% inhibition at 2.5 mg/mL. However, its IC50 (0.394 mg/mL) remained significantly (p<0.05) higher than that of ascorbic acid (0.131 mg/mL), indicating its lower antioxidant capacity compared to a standard antioxidant. No statistically significant differences (p≥0.05) were detected between several sample pairs, including RRTP-PZ and RRTP-SC (IC50 of 0.451 vs. 0.449 mg/mL, respectively), RRTP-LL and RRTP-ZA (0.544 vs. 0.550 mg/mL, respectively), and RRTP-HZ and RRTP-ZA (0.586 vs. 0.550 mg/mL, respectively). RRTP-LL yielded 85.70% DPPH radical scavenging at 2.5 mg/mL, comparable to the 84.4% scavenging activity reported at 2.0 mg/mL for a polysaccharide preparation obtained from dried R. roxburghii fruit by ultrasound-assisted enzymatic extraction [Jiao et al., 2025]. Similarly, the 79.01% scavenging activity observed for RRTP-QXG at 2.5 mg/mL was within the range reported for R. roxburghii fruit polysaccharide samples obtained by hot-water, saline, citric-acid, and alkaline extraction (73.77–82.22% at 4.0 mg/mL) [Chen et al., 2025]
Figure 3
Antioxidant capacity of polysaccharides from Rosa roxburghii Tratt. fruits (RRTP) collected in different producing areas of Guizhou Province in China, determined as DPPH• scavenging activity (A), ABTS•+ scavenging activity (B), O2•− scavenging activity (C), and Fe2+-chelating activity (D). Left graphs show RRTP concentration-dependent curves, and the right graphs show the half-maximal inhibitory concentration (IC50) for the radical-scavenging assays (A–C) and the half-maximal effective concentration (EC50) for the Fe2+-chelating assay (D). IC50 or EC50 values not sharing a common letter differ significantly (p<0.05). DPPH•, 2,2-diphenyl-1-picrylhydrazyl radical; ABTS•+, 2,2′-azinobis(3-ethylbenzothiazoline-6-sulfonic acid) radical cation. Sample codes are listed in Table 1.
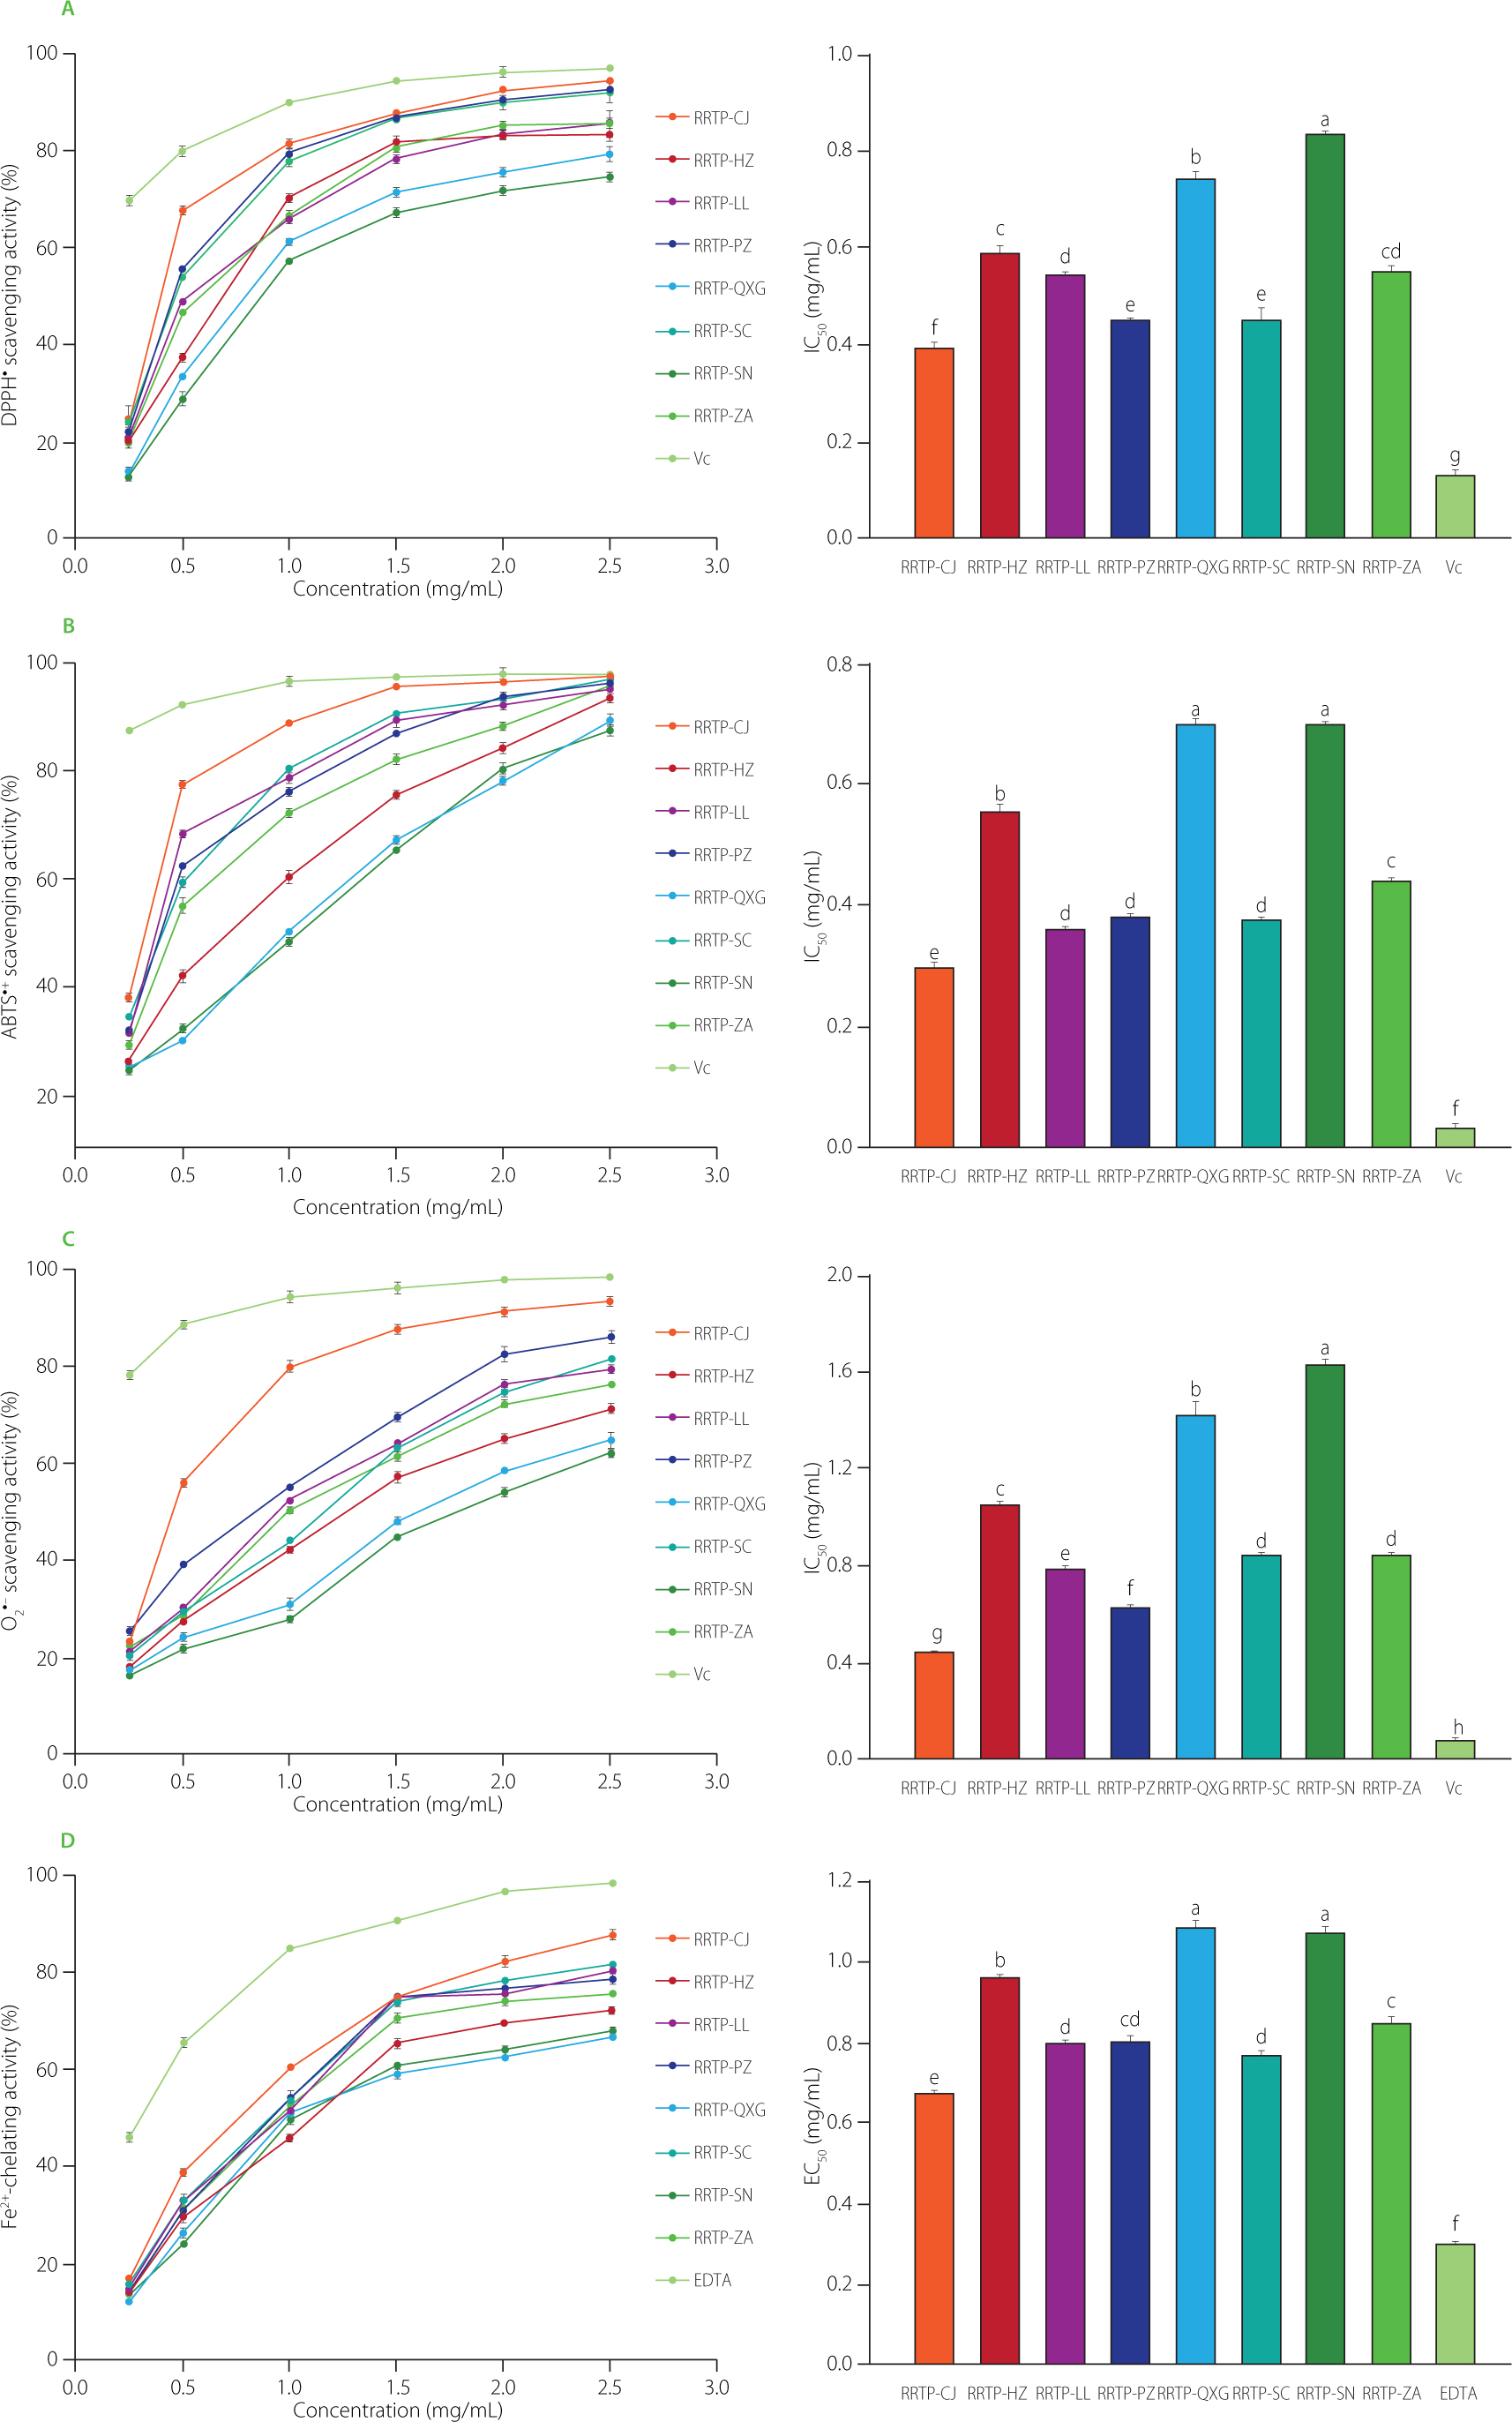
The ABTS assay revealed a clear dose-dependent scavenging effect across all RRTPs (Figure 3B). At 2.5 mg/mL, inhibition ranged from 87.27% to 97.56%, with RRTP-CJ exhibiting the highest activity. The order of RRTP samples with decreasing antioxidant capacity was as follows: RRTP-CJ = RRTP-LL = RRTP-SC = = RRTP-PZ > RRTP-ZA > RRTP-HZ > RRTP-QXG = RRTP-SN. Although RRTP-CJ exhibited the highest ABTS•+ scavenging activity among the RRTPs, its IC50 remained higher than that of ascorbic acid (0.0331 mg/mL, p<0.05). RRTP-LL, RRTP-SC, and RRTP-PZ exhibited IC50 values of 0.359, 0.375, and 0.382 mg/mL, respectively, with no significant differences among them (p≥0.05).
All RRTP samples exhibited superoxide scavenging activity in a concentration-dependent manner (Figure 3C). Based on IC50 values, their scavenging efficiency ranked as follows: RRTP-CJ > > RRTP-PZ > RRTP-LL > RRTP-SC = RRTP-ZA > RRTP-HZ > > RRTP-QXG > RRTP-SN. While RRTP-CJ consistently demonstrated superior activity relative to other RRTPs, its IC50 remained higher than that of ascorbic acid (0.0807 mg/mL, p<0.05), consistent with results from the DPPH and ABTS assays.
Because transition metals catalyze hydroxyl radical production, the ability of RRTPs to chelate ferrous ion was also examined, and respective results are shown in Figure 3D. Chelating activity increased with increasing polysaccharide concentration (0.25–2.5 mg/mL). RRTP-CJ exhibited the highest chelating activity, achieving significant efficacy even at 1.0 mg/mL. In contrast, RRTP-QXG and RRTP-SN required concentrations exceeding 2.0 mg/mL to attain comparable activity. Consistent with these concentration–response profiles, RRTP-CJ had the lowest EC50 among the RRTP samples (0.671 mg/mL), indicating the strongest Fe2+-chelating capacity, although it was less effective than EDTA (EC50 = 0.298 mg/mL; p<0.05). RRTP-SC and RRTP-LL showed comparable activities, with EC50 values of 0.766 and 0.794 mg/mL, respectively. RRTP-PZ exhibited an intermediate EC50 of 0.799 mg/mL and did not differ significantly (p≥0.05) from RRTP-SC, RRTP-LL, or RRTP-ZA (0.847 mg/mL). RRTP-HZ showed weaker activity, with an EC50 of 0.961 mg/mL, while RRTP-SN and RRTP-QXG had the highest EC50 values (1.069 and 1.084 mg/mL, respectively) and did not differ significantly (p≥0.05) from each other. Collectively, antioxidant capacity of RRTPs varied significantly with fruit geographic origin, and RRTP-CJ consistently exhibited the greatest efficacy across all assays.
In vitro inhibitory effect of polysaccharides from Rosa roxburghii Tratt. fruits on glycemic-related digestive enzymes
Inhibition of digestive carbohydrase activity
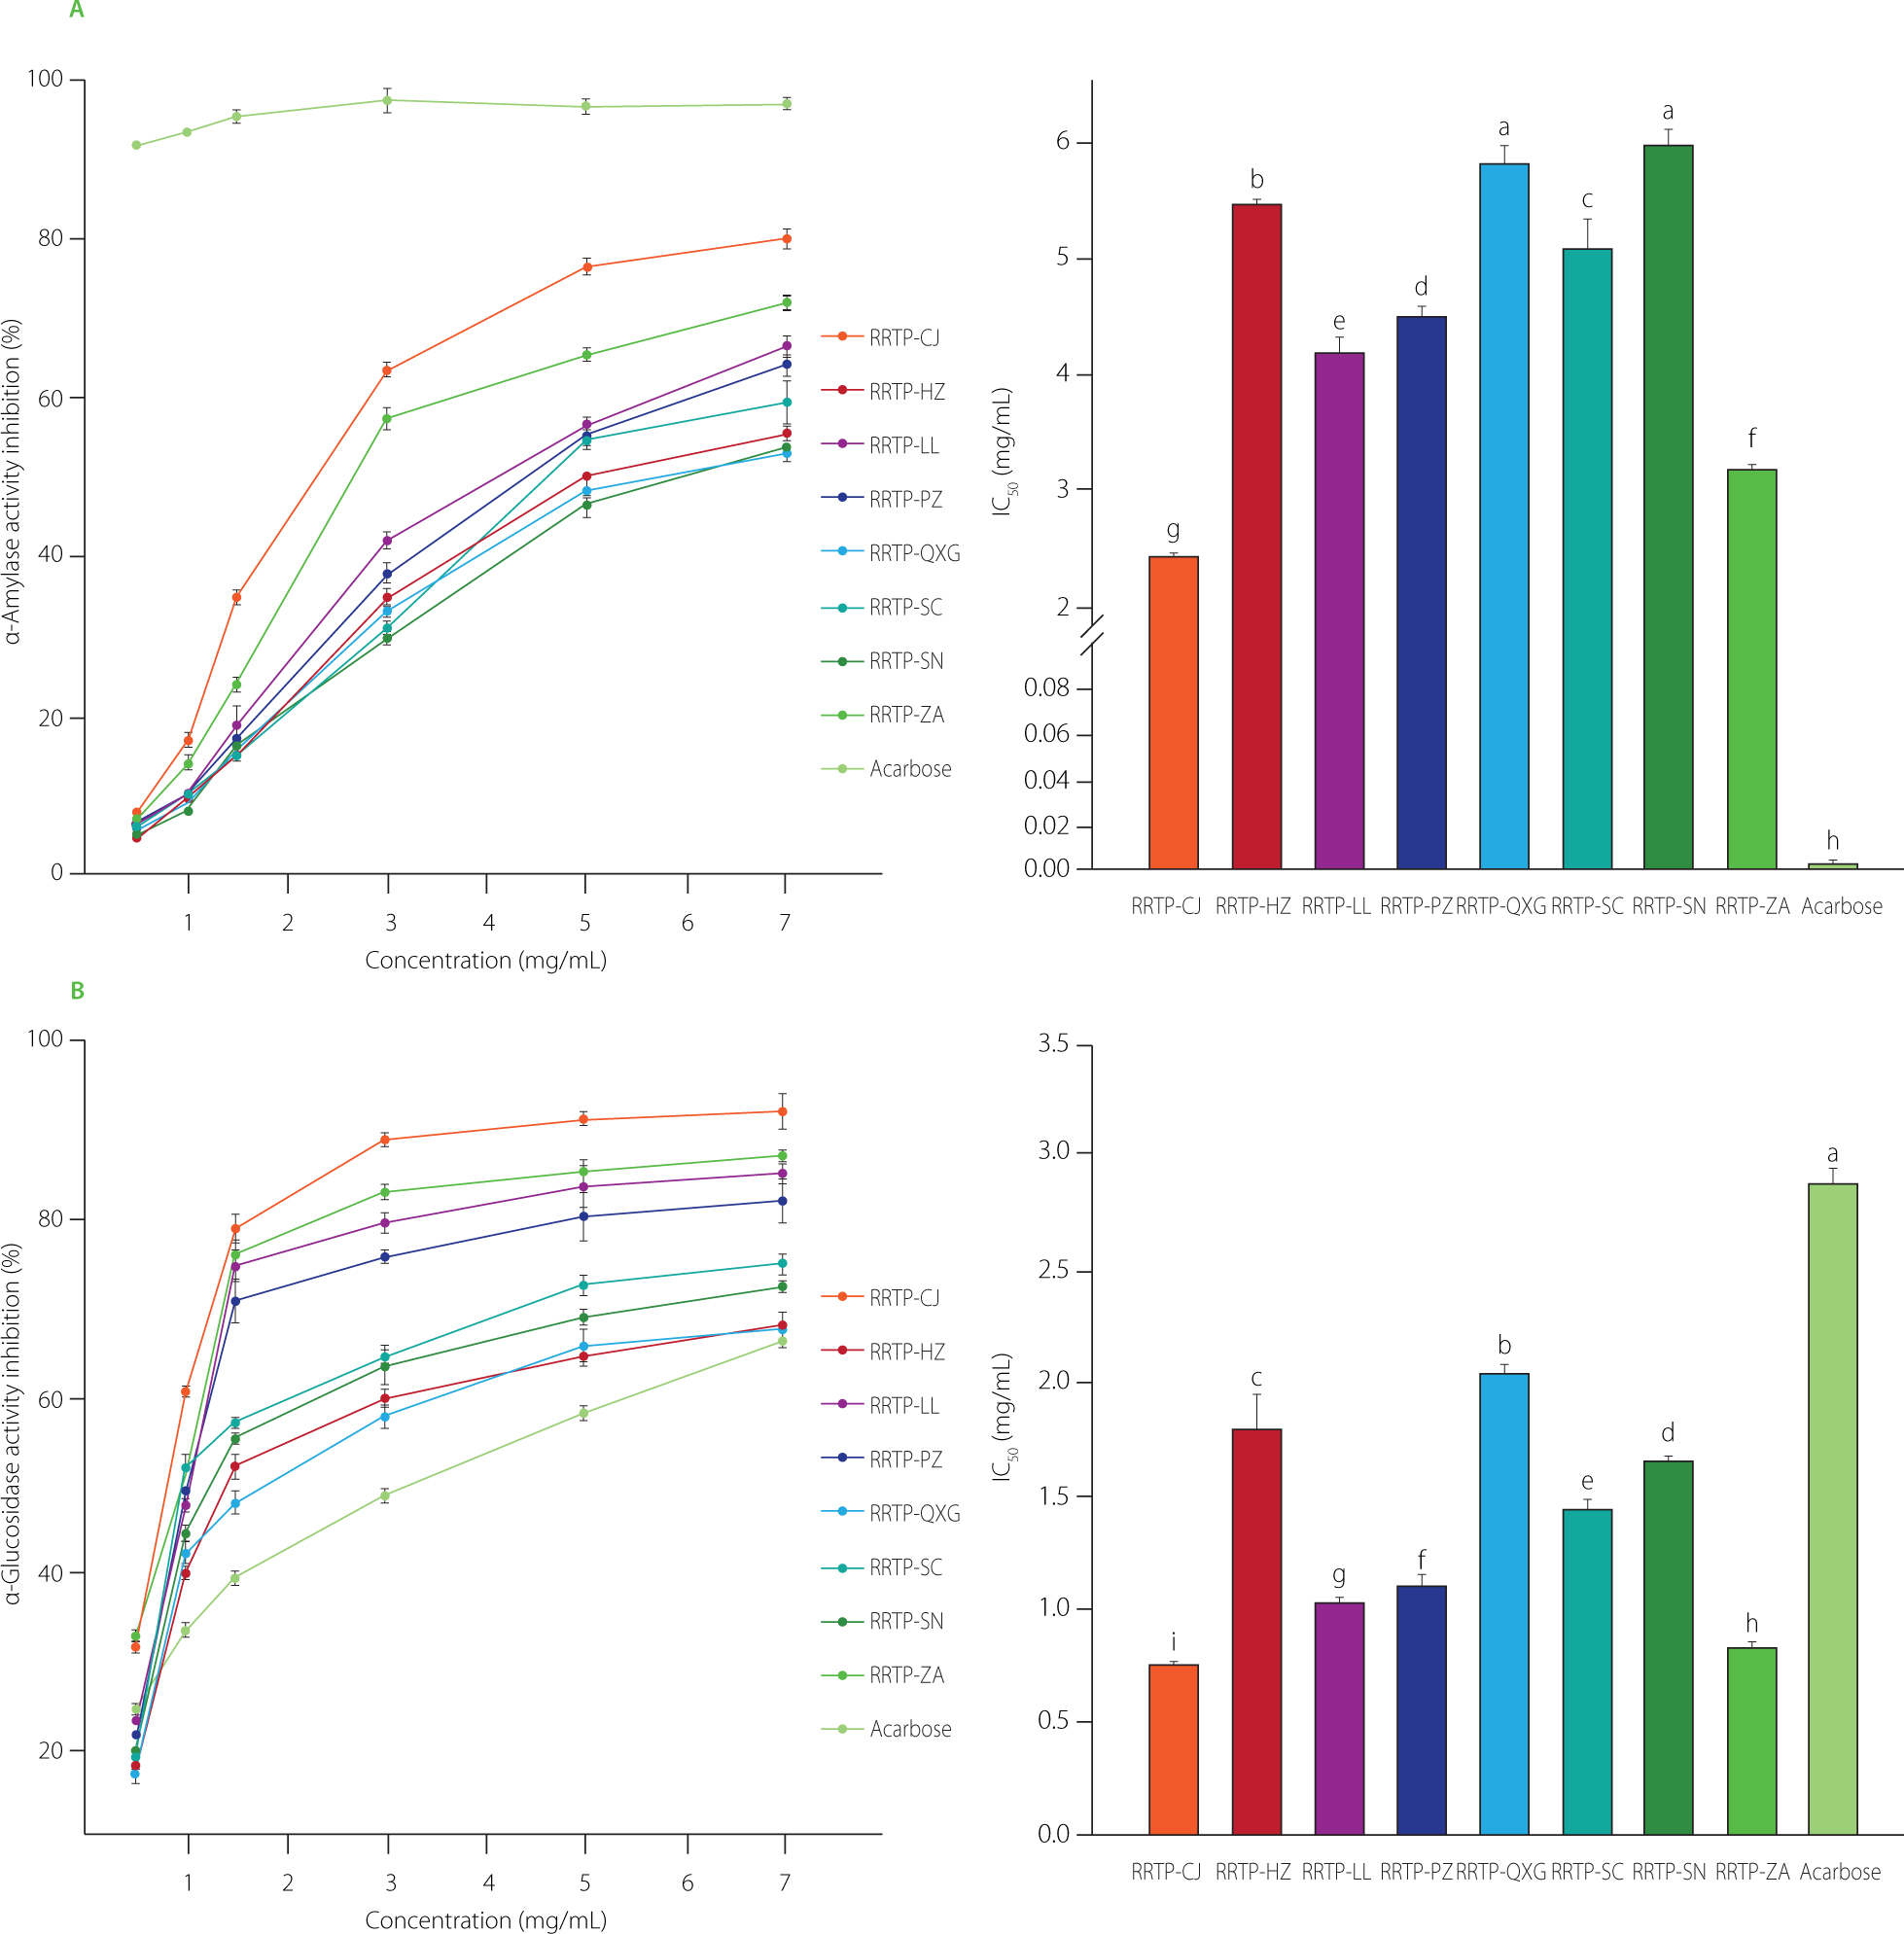
In this study, RRTPs collected from eight major production areas in Guizho were evaluated for their inhibitory effects on α-amylase and α-glucosidase, with acarbose serving as a pharmaceutical benchmark. All RRTP samples demonstrated concentrationdependent inhibition of α-amylase, with activities at 7.0 mg/mL ranging from 52.45% (RRTP-SN) to 79.64% (RRTP-CJ) (Figure 4A). Based on the IC50 values, the analyzed samples were ranked as follows: RRTP-CJ (2.425 mg/mL) < RRTP-ZA (3.175 mg/mL) < RRTP-LL (4.189 mg/mL) <RRTP-PZ (4.497 mg/mL) <RRTP-SC (5.068 mg/mL) < RRTP-HZ (5.441 mg/mL) < RRTP-QXG (5.817 mg/mL) = RRTP-SN (5.971 mg/mL). All RRTP samples had higher IC50 values than acarbose, indicating weaker α-amylase inhibition under the assay conditions. In contrast, the RRTPs showed stronger inhibition of α-glucosidase, yielding 67.73– –92.46% inhibition at 7.0 mg/mL compared with 66.49% determined for acarbose (Figure 4B). Based on the IC50 values, they were ranked as follows: RRTP-CJ (0.747 mg/mL) < RRTP-ZA (0.826 mg/mL) < RRTP-LL (1.022 mg/mL) < RRTP-PZ (1.101 mg/mL) < RRTP-SC (1.434 mg/mL) < RRTP-SN (1.655 mg/mL) < RRTP-HZ (1.787 mg/mL) < RRTP-QXG (2.035 mg/mL) < acarbose (2.873 mg mL). The stronger inhibition of α-glucosidase than α-amylase observed for the RRTPs was consistent with previous findings for R. roxburghii fruit polysaccharides obtained using different extraction solvents, which showed IC50 values of 0.494– –1.234 mg/mL against α-glucosidase and 0.758–2.003 mg/mL against α-amylase [Chen et al., 2025]. The excellent inhibitory activity of RRTP-CJ and RRTP-ZA may be due to their relatively small molecular weight, a higher galacturonic acid content, and longer chains, which enhance their interaction with enzyme active sites [Zhang et al., 2025b].
Figure 4
Inhibitory effects of polysaccharides from Rosa roxburghii Tratt. fruits (RRTP) collected in different producing areas of Guizhou Province in China on α-amylase activity (A) and α-glucosidase activity (B). Left graphs show RRTP concentration-dependent curves, and the right graphs show half-maximal inhibitory concentration (IC50). IC50 values not sharing a common letter differ significantly (p<0.05). Sample codes are listed in Table 1.
Kinetics of α-glucosidase inhibition
Lineweaver-Burk plots of α-glucosidase inhibition by RRTPs are shown in Figure S5 in Supplementary Materials. For each RRTP, three inhibitor concentrations generated straight lines intersecting in the third quadrant, indicating a mixed-type mode of inhibition. Increasing polysaccharide concentrations reduced both Vmax and Km (Table 3), consistent with simultaneous binding to both the free enzyme (E) and the enzyme-substrate complex (ES). Secondary replots yielded apparent dissociation constants, Ki (E-I) and Kis (ES-I) (Figure S6 in Supplementary Materials). For all RRTPs, Kis<Ki (ratios 0.19–0.60), indicating preferential binding to the ES complex and a predominant non-competitive inhibition component [Zhang et al., 2025a]. Among all preparations, RRTP-CJ displayed the strongest association (Kis = 0.336 mg/mL; Kis/Ki = 0.190) and the lowest IC50, substantiating its position as the most potent inhibitor in this series. While all RRTPs moderated digestive carbohydrase activity, the preparation from Congjiang (RRTP-CJ) consistently outperformed others, exhibiting potent α-glucosidase inhibition through a predominantly non-competitive, mixed-type mechanism. Given their additional antioxidant activity, RRTP-CJ, and to a lesser extent RRTP-ZA and RRTP-LL, emerge as promising functional ingredients for the dietary management of type 2 diabetes.
Table 3
Kinetic parameters of α-glucosidase inhibition by polysaccharides from Rosa roxburghii Tratt. fruits (RRTP) collected in different producing areas of Guizhou Province in China.
[i] Km, Michaelis constant; Vmax, maximum reaction velocity; Ki, dissociation constant for the enzyme-inhibitor complex; Kis, dissociation constant for the enzyme-inhibitor-substrate complex. Sample codes are listed in Table 1.
Interplay between structural attributes and bioactivity
Pearson correlations were employed to elucidate the physicochemical determinants underlying the antioxidant capacity and digestive carbohydrase activity inhibition of the eight RRTP preparations (Figure 5A). Uronic acid content emerged as the most potent positive predictor, exhibiting strong and significant correlations (p<0.01) with antioxidant capacity (all assays) and enzyme-inhibitory activity. Average molecular weight was significantly negatively correlated with the IC50 or EC50 values obtained from the antioxidant and enzyme-inhibition assays (p<0.01), indicating that the RRTPs with higher average molecular weights generally exhibited stronger bioactivities. The architecture of pectic domains further modulated bioactivity: HG content correlated positively with antioxidant capacity and inhibitory activity (p<0.05), while RG-I, Rha/GalA, and Gal+Ara)/Rha ratios correlated negatively with these activities (p<0.05). Significant associations were also observed for the molar fractions of arabinose, galactose, xylose, and galacturonic acid (p<0.01), highlighting the multifactorial nature of structure-activity relationships within this polysaccharide series.
Figure 5
Multivariate analysis of structure-activity relationships among polysaccharides from Rosa roxburghii Tratt. fruits (RRTP) collected in different producing areas of Guizhou Province in China: Pearson correlation heatmap (A) and principal component analysis (PCA) loading plot (B).
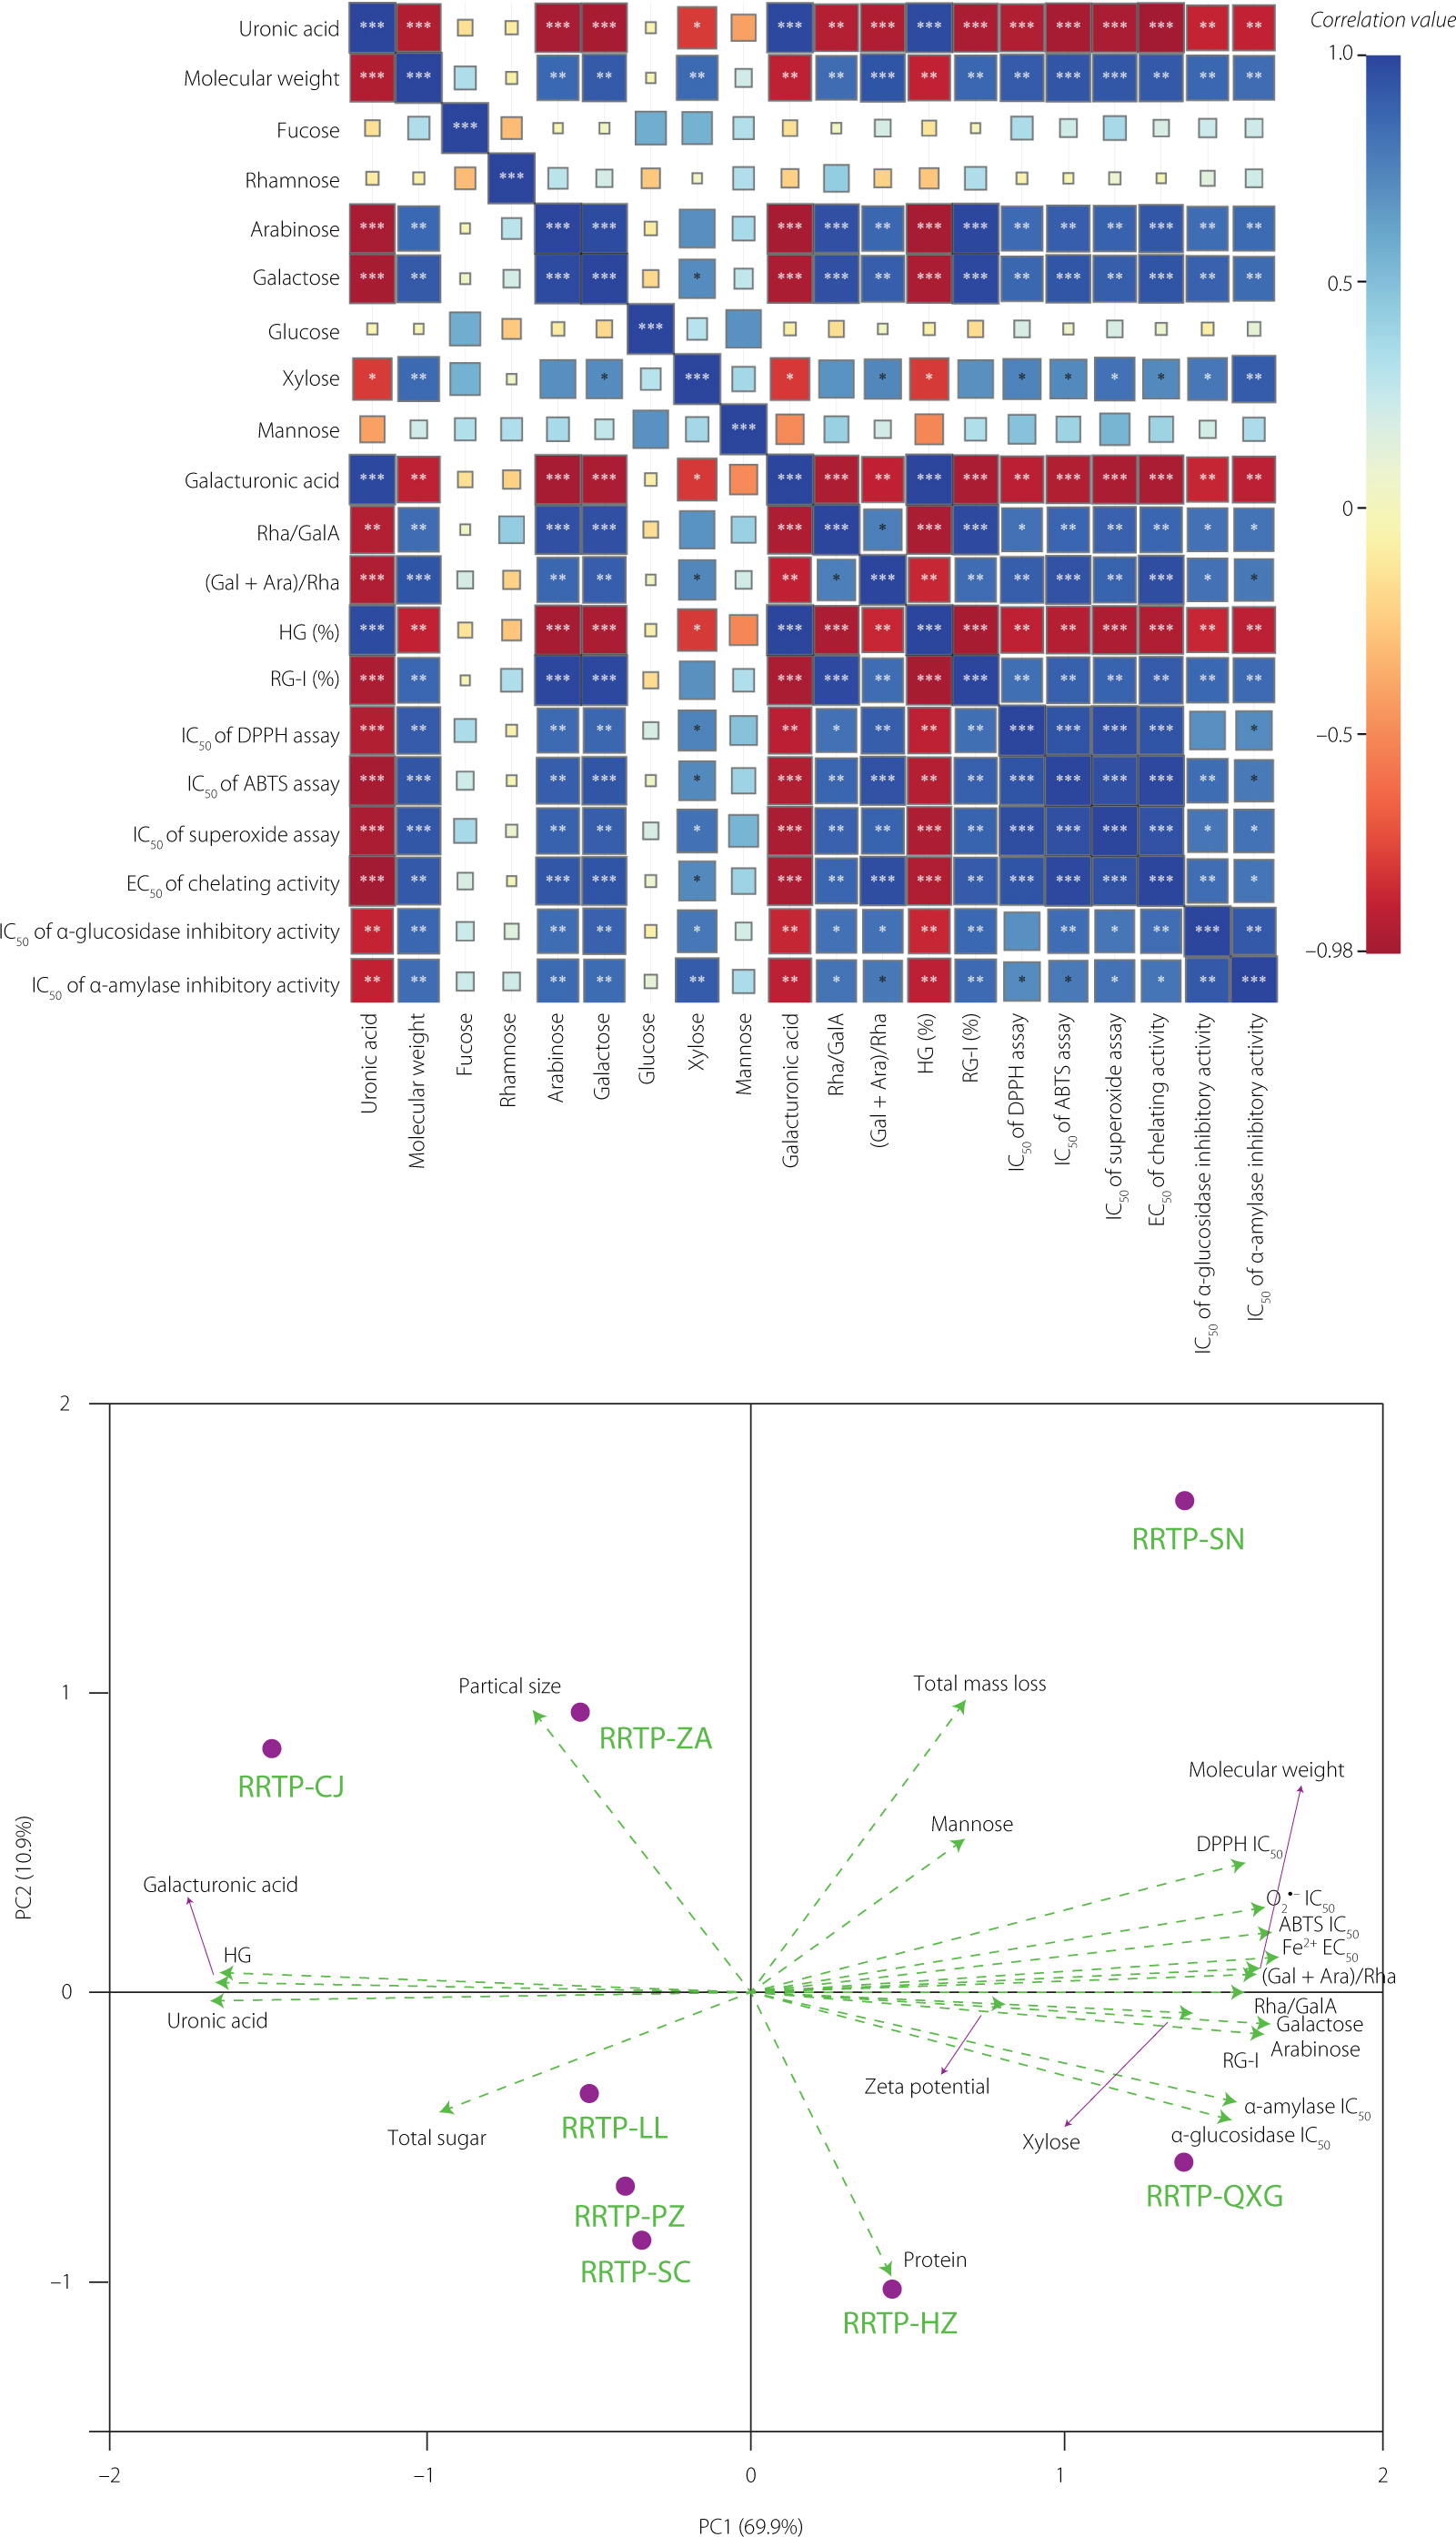
The antioxidant and enzyme-inhibitory activities of polysaccharides are jointly influenced by uronic acid content, molecular weight, and monosaccharide composition. Radical scavenging by bioactive polysaccharides generally occurs through electron transfer or hydrogen-atom donation. In uronic acid-rich polysaccharides, carboxyl groups may contribute to radical scavenging and metal-ion chelation [Chen et al., 2019], consistent with the close association between uronic acid content and antioxidant activity observed in the present study. Molecular weight can also affect antioxidant activity by altering the accessibility of reactive groups. In some polysaccharide systems, controlled depolymerization generates additional reducing ends and consequently enhances radical-scavenging activity [Qi et al., 2005; Zhang et al., 2019]. However, the effect of molecular weight is dependent on the overall molecular architecture and should therefore be considered together with monosaccharide composition and pectic-domain structure. Digestive enzyme inhibition may involve direct association between polysaccharide chains and the enzyme proteins. A purified acidic polysaccharide from R. roxburghii fruit was previously shown to bind α-glucosidase and induce conformational changes in the enzyme [Wang et al., 2018a]. The hydroxyl and carboxyl groups of acidic polysaccharides may contribute to these interactions through hydrogen bonding and electrostatic forces. Among the eight samples, RRTP-CJ was distinguished by its high uronic acid content and HG proportion. These compositional characteristics, together with its molecular-weight distribution, may jointly account for its strong radical-scavenging and carbohydrase-inhibitory activities. Accordingly, RRTP-CJ represents a promising candidate for further evaluation as an antioxidant and glucose-modulating functional food ingredient.
PCA was applied to the comprehensive structural and functional dataset for polysaccharides isolated from RRTs from eight cultivation areas in Guizhou. Two orthogonal components accounted for 80.8% of the cumulative variance (PC1 = 69.9%; PC2 = 10.9%) (Figure 5B). PC1 mainly reflected the association between pectic structural characteristics and bioactivity. Average molecular weight, the RG-I-related indices (Rha/GalA and (Gal+Ara)/Rha), the IC50 values for DPPH•, ABTS•+, O2•− scavenging activities and α-amylase and α-glucosidase inhibition, and the EC50 value for Fe2+-chelating activity were located on the positive side of PC1. In contrast, total uronic acid, galacturonic acid, and HG content were located on its negative side. Because lower IC50 or EC50 values indicate stronger activity, this distribution suggests that RRTP samples rich in uronic acid and HG generally exhibited stronger antioxidant and digestiveenzyme inhibitory activities, whereas higher molecular weight and more pronounced RG-I-related characteristics were associated with weaker activities. PC2 captured secondary variation in particle and thermal properties. Particle diameter, total mass loss, and mannose content loaded positively on PC2, whereas zeta potential and protein content loaded negatively. PC2 therefore differentiated the RRTP samples primarily according to their particle size, thermal behavior, surface charge, and protein content.
PCA distinguished the RRTP samples mainly along a structure-bioactivity axis. Samples such as RRTP-CJ and RRTP-ZA were associated with lower molecular weight, higher galacturonicacid-related characteristics, and lower IC50 values in antioxidant and enzyme-inhibition assays, whereas RRTP-QXG and RRTP-SN were associated with higher molecular weight, more pronounced RG-I branching features, and weaker in vitro activities. These results support the conclusion that pectic domain distribution and molecular size were the major contributors to the observed functional differences among RRTPs. Importantly, the PCA results describe associations within the present comparative dataset and should not be interpreted as direct evidence for specific environmental drivers. From an application perspective, the superior profile of RRTP-CJ suggests that this source may be more suitable for the development of functional ingredients with antioxidant and digestive enzyme inhibitory potential, whereas samples with weaker activity may require further processing or structural modification before targeted utilization.
CONCLUSIONS
This study comparatively characterized polysaccharides extracted from R. roxburghii fruits collected from eight major production areas in Guizhou Province, China, under a shared cultivar background. Marked differences were observed in uronic acid content, pectic domain composition, molecular weight, physicochemical properties, antioxidant capacity, and inhibitory activity against α-amylase and α-glucosidase. RRTP-CJ showed the most favorable overall profile, combining lower molecular weight and higher galacturonic-acid-related characteristics with stronger in vitro antioxidant capacity and lower IC50 values for α-amylase and α-glucosidase inhibition. Kinetics analysis further demonstrated that all RRTPs inhibited α-glucosidase through a mixed-type mode with a predominant non-competitive component, as evidenced by their preferential binding to the enzyme-substrate complex (Kis<Ki), with RRTP-CJ showing the strongest inhibitory interaction. Correlation and multivariate analyses further indicated that lower molecular weight, higher homogalacturonan-related features, and higher uronic acid content were associated with improved bioactivity, whereas more extensive RG-I branching was generally associated with weaker effects. These findings provide comparative evidence of source-associated heterogeneity among commercially relevant R. roxburghii materials from Guizhou and offer a practical basis for raw-material selection, standardization, and targeted utilization in functional food and nutraceutical applications. Because the present study was conducted within one cultivar and one harvest year and did not include direct site-level environmental measurements, the observed differences should be interpreted as comparative production-source variation rather than direct environmental causation. To improve the broader applicability of these findings, future studies should incorporate cross-provincial and multi-year sampling, direct monitoring of site-level environmental variables, and in vivo functional validation to further clarify the factors contributing to source-associated variation and to support more robust raw-material evaluation and industrial standardization.