INTRODUCTION
Quince (Cydonia oblonga Miller) fruit is known for its micronutrient content, pleasant fragrance, and unique flavor. It is rich in ascorbic acid and minerals including calcium, potassium, and phosphorus [Sharma et al., 2011]. However, it is particularly recognized as a dietary source of health-promoting compounds eliciting antioxidant and antimicrobial effects [Hajji et al., 2020]. Phenolic compounds identified in quince fruit include 4-O-caffeolquinic acid, 3-p-coumaroylquinic acid, 5-O-caffeoylquinic acid, 5-p-coumaroylquinic acid, quercitin 3-O-glucoside, quercitin 3-O-rutinoside, kaempferol rutinoside, kaempferol hexoside, quercetin, catechin, epicatechin, and a procyanidin dimer [Baroni et al., 2018].
Drying quince fruits is one possible method of storing them and preventing them from deterioration. Symilarly to other fruits, quince is perishable; therefore, drying is quite advantageous as it reduces the water activity of the material, thus reducing the microbiological activity to a level that prevents deterioration [Doymaz et al., 2015]. The most commonly used drying method is hot-air convective drying, but this method has some disadvantages such as long processing time required and the use of high temperatures [Martins et al., 2022]. For food products, infrared drying is regarded as a promising drying method [Huang et al., 2021]. Novel combined infrared-vacuum drying is a new drying technique that has some advantages over conventional drying in terms of energy consumption, time savings, and high product quality [Topuz et al., 2023]. Nevertheless, any drying method influences the quality of the final dried products [Oliveira et al., 2016].
Various pretreatment techniques are, therefore, utilized to improve drying characteristics and/or dried product quality [Kriaa & Nassar, 2022]. These methods involve ultrasounds, high pressures, ethanol [Llavata et al., 2020], freeze-thawing, blanching, and pulsed electric field [Kriaa & Nassar, 2022]. Ethanol pretreatment is a simple and effective method, dissolving compounds in the cell wall and increasing its permeability [Llavata et al., 2020; Wang et al., 2019]. Wang et al. [2019] reported that ethanol pretreatment significantly reduced the drying time of scallion slices. These samples also exhibited better rehydration, odor, vitamin C content, and antibacterial effects. The principle of freeze-thawing pretreatment relies on ice crystallization, which is formed by free water penetrating to the cell wall during the expansion process of frozen water. This allows free water to overflow the cell and promote mass transfer [Xu et al., 2021]. Blanching is an important pretreatment in fruit and vegetable processing as it inactivates enzymes, enhances dehydration rate, removes pesticide residues, and reduces microbial load [Xiao et al., 2017]. Lagnika et al. [2019] found that blanching pretreatment of cashew apples led to medium quality results in terms of a rehydration rate and overall sensory quality, with substantial degradation of vitamin C. In turn, Chao et al. [2022] reported that ultrasound, blanching, and freeze-thawing pretreatments significantly accelerated the drying rate and that the seed-used pumpkin slices dried after blanching pretreatment exhibited the highest free phenolic content and total carotenoid content, which increased by 45% and 34%, respectively, compared to the untreated sample. In the studies, ethanol, freeze-thawing, and blanching pretreatments are used alone as well as in combination with ultrasounds. da Cunha et al. [2020] reported that the combination of ultrasounds and ethanol (50% and 100%) shortened the drying time of melon slices but negatively affected their quality parameters. Xu et al. [2021] investigated the effect of ultrasound, freeze-air thawing, freeze-water thawing, freeze-ultrasound thawing, and freeze-air ultrasound thawing pretreatments on the quality of dried okra and reported that all pretreatments shortened the drying time and that the freeze-air ultrasound thawing pretreatment yielded the most variable characteristics of dried okra quality. Xu et al. [2023] reported that thermoultrasound blanching resulted in more efficient drying by promoting tissue softening, moisture diffusion, microstructural changes, and microchannel formation compared to hot water blanching, which significantly reduced energy consumption and improved the overall quality of the dried sweet potatoes.
To the best of our knowledge, the effects of citric acid, ultrasounds, ethanol, freeze-thawing, blanching, and their various combinations as pretreatments on the vacuum-combined infrared radiation (VCIR) drying of quince have not been studied yet. Therefore, the aim of this study was to investigate the effects of ten different pretreatments on (i) drying time, color, and rehydration ratio; (ii) α-glucosidase inhibitory activity; (iii) phenolic composition; (iv) antioxidant activity; and (v) in vitro bioaccessibility of these phenolic compounds of quince slices dried by VCIR. These pretreatment combinations were expected to enhance the physical, chemical, and nutritional properties of quince.
MATERIALS AND METHODS
Sample preparation and drying procedure
Approximately 10 kg of fresh quince fruits (Eşme) were purchased at a local market in Van, a province of Türkiye. Before drying, quince fruits were peeled and cut into 5-mm thick slices with a manual fruit slicer (Hex, Istanbul, Türkiye). The slices were divided into 10 parts, each of which was subjected to a different pretreatment before drying, including immersion in a citric acid solution (CA), ultrasound and citric acid treatment (US), immersion in ethanol (ET), ethanol treatment with ultrasounds (ET+US), freezing-thawing (FT), freezing-thawing with ultrasounds and citric acid (FT+US), freezing-thawing with ethanol and ultrasounds (FT+ET+US), blanching with citric acid (BL), blanching with ultrasounds and citric acid (BL+US), and blanching with citric acid and then immersion in ethanol with ultrasounds (BL+ET+US). The conditions and details of each treatment are described in Table 1. Samples pretrated with ultrasounds were sonicated at 20 kHz and 200 W using a UW 3200 probe (Bandelin, Berlin, Germany) connected to an ultrasonic generator (HD 3200 Sonopuls, Bandelin). Ultrasound applications lasted 5 min, and temperature control (23±1oC) was provided with ice bags. Drying was carried out using a vacuum-combined infrared dryer (Uniterm, Ankara, Türkiye) with four 250 W infrared lamps both at the ceiling and the floor inside the oven, eqqupied by a vacuum pump (Pall Life Sciences, DOA-P730-BN, MI, USA). The distance between the samples and the lamps was adjusted to 12 cm. The samples were dried at 250 W infrared power and 40 kPa vacuum pressure. The initial moisture content of the quince fruits was 81.34±0.12 g/100 g, and the fruits were dried until they reached about 12 g/100 g. The moisture content of the samples was determined using the oven-drying method [AOAC, 2003].
Table 1
Pretreatment conditions of quince slices and sample codes.
Determination of color parameters
Color coordinates, including L* (lightness), a* (redness-greenness), and b* (blueness-yellowness) of fresh and dried quinces, were measured by a CR-400 colorimeter (Konica Minolta, Tokyo, Japan). The instrument was calibrated using a white standard according to the manufacturer’s instructions. Based on the color coordinates, the total color difference (ΔE), chroma (C), and hue angle (h°) were calculated using Equations (1)–(3), respectively [Maskan, 2001]:
where coordinates with subscript “0” refers to the color reading of fresh quinces.Rehydration ratio
The dried quince samples (1 g) were immersed in pure water (50 mL) for 24 h at ambient temperature. Then, the surface water was removed using filter paper, and the samples were weighed. Rehydration ratio (RR) was determined as the ratio of weights of rehydrated sample slices to dried sample slices [Doymaz et al., 2015].
Preparation of methanolic extracts
Fresh (5 g) and dried (1 g) quince fruits were stirred with 15 mL of methanol and a water mixture (80:20, v/v) at 150 rpm for 2 h at room temperature. The mixtures were centrifuged at 8,000×g for 10 min. After separation, the extraction was repeated using the residue and 10 mL of the same solvent. The supernatants were combined and reached a final volume of 25 mL with the solvent [Bakkalbaşı et al., 2013]. Methanolic extracts were used to analyze phenolic compound composition and 5-hydroxymethylfurfural (HMF) content.
Total phenolic content determination
The total phenolic content (TPC) detemination of quince was carried out by Singleton & Rossi [1965] method. Briefly, 0.4 mL of the extract was mixed with 2 mL of the Folin-Ciocalteu reagent (Sigma-Aldrich, St. Louis, MO, USA) (1:10, v/v) and 1.6 mL of sodium carbonate (7.5%), and the mixture was kept in the dark at room temperature for 60 min. Absorbance was read at 765 nm using a spectrophotometer (8453, Agilent, Santa Clara, CA, USA). TPC was expressed as mg gallic acid equivalent (GAE)/kg quince dry matter (DM).
Total flavonoid content determination
The total flavonoid content (TFC) was determined as reported by Zhishen et al. [1999]. In brief, 1 mL of the extract, 5 mL of water, and 0.3 mL of NaN02 (5%) were mixed. After 5 min, 0.3 mL of AlCl3 (10%) was added. After another 5 min, 2 mL of NaOH (1 M) was added, and the final volume of the solution was adjusted to 10 mL with water. Absorbance was read at 510 nm using a spectrophotometer (8453, Agilent). The TFC was expressed as mg quercetin equivalent (QE)/kg DM.
Condensed tannin content determination
Condensed tannin content (CTC) of quince samples was determined using the vanillin assay by Sun et al. [1998]. Four mixtures composed of: (1) extract (1 mL), 1% vanillin solution in methanol (2.5 mL), and 25% H2SO4 solution (2.5 mL); (2) methanol (1 mL), 1% vanillin solution in methanol (2.5 mL), and 25% H2SO4 solution (2.5 mL); (3) extract (1 mL), methanol (2.5 mL), and 25% H2SO4 soluton (2.5 mL); and (4) methanol (3.5 mL) and 25% H2SO4 solution (2.5 mL), were prepared in separate tubes and incubated at 30°C for 20 min. The absorbance of each mixture (As, Ab, Ac and A0, respectively) was measured at 500 nm with a spectrophotometer (8453, Agilent). A similar set of solutions was prepared and processed with catechin solutions at different concentrations instead of the extract to obtain a calibration curve.
Absorbance value (A) was calculated for each standard and sample solution using Equation (4):
Results were given as mg catechin equivalents (CE)/kg DM.Antioxidant activity determination
The assay with 2,2-diphenyl-1-picrylhydrazyl (DPPH) radical (Sigma-Aldrich) was carried out according to the procedure described by Brand-Williams et al. [1995] with a minor modification. The extract (0.1 mL) and a DPPH radical solution (3.9 mL, 0.025 g/L in methanol) were mixed and reacted for 60 min at room temperature. Absorbance was read at 515 nm using a spectrophotometer (8453, Agilent).
The 2,2′-azino-bis(3-ethylbenzothiazoline-6-sulfonic acid) (ABTS) (Sigma-Aldrich) assay was performed according to Re et al. [1999] method. To generate the ABTS radical cation, a reaction was induced by incubating 7 mM ABTS and 2.45 mM potassium persulfate for 16 h at room temperature in a dark environment. The ABTS•+ solution was diluted with ethanol to obtain an absorbance of 0.700±0.05 at 734 nm. Then, the extract (20 μL) and the ABTS•+ solution (1,980 μL) were mixed and reacted in darkness for 6 min. The absorbance was measured at 734 nm.
DPPH• and ABTS•+ scavenging activities were expressed as Trolox equivalents (mmol Trolox eq./g DM).
Determination of phenolic compound composition and 5-hydroxymethylfurfural content
Simultaneous analysis of phenolic compounds and HMF by high-performance liquid chromatography (HPLC) system (LC-20 AD, Shimadzu, Kyoto, Japan) was performed as reported by Colaric et al. [2005] with slight modifications. Separation was performed on a Symmetry C18 (250×4.6 mm id, particle size 5 μm) column (Waters, Milford, MA, USA) at 25°C. Acetic acid in water (2%, v/v) (A) and a mixture of acetonitrile with 0.5% (v/v) acetic acid in water (1:1, v/v) (B) were used as a mobile phase. The flow rate was 1.0 mL/min. The gradient program was as follows: 0 min, 90% A; 30 min, 80% A; 60 min, 65% A. Detection was made at 276 nm for HMF, 280 and 320 nm for phenolic acids, 280 nm for flavan-3-ols, and 360 nm for flavonols. The identification of the phenolic and HMF peaks on the chromatogram was carried out using retention time and spectrum of a commercial standard. Rutin, catechin, epicatechin, chlorogenic acid, neochlorogenic acid, and cryptochlorogenic acid standards were purchased from Sigma-Aldrich Co. Procyanidin B1 and procyanidin B2 standards were purchased from abcr GmbH (Karlsruhe, Germany). HMF standard was purchased from Carl Roth (Karlsruhe, Germany). Quantification was performed based on standard curves, and results were given as mg/kg DM.
Determination of phenolic bioaccessibility and antioxidant activity after in vitro digestion
Quince (1.5 g) was mixed with 30 mL of pure water and 1.5 mL of pepsin (20 g/L in 0.1 M HCl) [Vitali et al., 2009]. Mixture pH was adjusted to 2 using 6 M HCl, and the mixture was incubated at 37°C for 1 h in a shaking water bath. The pH of the mixture was then adjusted to 7.2 using 1 M NaHCO3 to stop gastric digestion. Afterwards, 7.5 mL of a bile/pancreatin solution (2 g of pancreatin and 12 g of bile salt in 1 L of 0.1 M NaHCO3) and 7.5 mL of an NaCl/KCl solution (120 mM NaCl and 5 mM KCl) were added to the mixture, which was then incubated at 37°C for 2.5 h in a shaking water bath. After incubation, the mixture was centrifuged at 8,000×g for 10 min, and the supernatant was used for TPC, TFC, CTC, and antioxidant activity analysis. Bioaccessibility of TPC, TFC, and CTC, and retention of antioxidant activity were expressed as the percentage ratio of the values in the digested content to the initial values before digestion.
α-Glucosidase inhibitory activity of quince
The α-glucosidase inhibitory activity (α-GIA) of fresh and dried quinces was determined according to the procedure previously used by Zhang et al. [2020] with minor modifications. An aliquot of 50 μL of α-glucosidase (from Saccharomyces cerevisiae, Sigma-Aldrich) (1 U/mL) in a phosphate buffer (0.1 M, pH 6.8) was mixed with 100 μL of extracts at different concentrations (5–40 mg/mL). The mixtures were preincubated at 37°C for 10 min, and 5 mM 4-nitrophenyl α-d-glucopyranoside (100 μL) was added as a substrate. Reaction was carried out at 37°C for 15 min. Then, 0.1 M Na2CO3 (750 μL) was added to terminate the reaction. Absorbance was measured at 405 nm, and results were given as the IC50 value, which was defined as the concentration of the extract required to inhibit 50% of the α-glucosidase activity. Acarbose was used as a positive control.
Statistical analysis
All samples were prepared in five replicates, and all analyses were performed three times for each sample. Data were presented as mean and standard deviation. SPSS 20.0 software (IBM Corp., Armonk, NY, USA) was used for multivariate analysis of variance. Differences among the means were determined using Duncan’s multiple range tests and were considered significant at p<0.05. The JMP 13 package program (SAS Institute Inc., Cary, NC, USA) was used to carry out both correlation and principal component analysis (PCA).
RESULT AND DISCUSSION
Effect of pretreatment on drying time and physicochemical parameters of quince slices
The drying times of quince slices are given in Table 2. Pretreatments with ultrasounds (US), ethanol (ET), freezing-thawing (FT), and blanching (BL), as well as their combinations resulted in significantly shorter drying times of quince slices compared to those treated with citric acid (CA) for which it was180 min. The drying time was especially reduced when ET and US were used (alone or in combination with other pretreatments such as blanching or freezing-thawing). Pore opening by ultrasound can improve dissolution of cell wall compounds by ethanol. Thus, during drying, the Marangoni flow effect is more intense than when ethanol is used alone [Miano et al., 2021]. Compared to the FT and US samples, the drying time for sample FT+US decreased by 14.68% and 23.75%, respectively (Table 2). A similar phenomenon was observed for plums by Li et al. [2025]. The highest reductions in drying time were 47.77% (for BL+ET+US), 41.66% (for FT+ET+US), and 37.77% (for ET+US) compared to the CA sample, demonstrating that the proposed approach of combining pretreatments for VCIR drying was effective in reducing processing time. The moisture content of quince samples after drying varied within a narrow range (11.95–12.58 g/100 g).
Table 2
Drying time, moisture content, rehydration ratio (RR), and color parameters of fresh and dried quince slices after different pretreatments.
[i] Values are given as mean ± standard deviation. Lowercase letters indicate the difference between the samples in the same column according to Duncan multiple comparison test, uppercase letters indicate the difference between the same group of pretreated samples (p<0.05). CA, citric acid; US, ultrasounds + citric acid; ET, ethanol; ET+US, ethanol + ultrasounds; FT, freezing-thawing; FT+US, freezing-thawing + ultrasounds + citric acid; FT+ET+US, freezing-thawing + ethanol + ultrasounds; BL, blanching + citric acid; BL+US, blanching + ultrasounds + citric acid; BL+ET+US, blanching + ultrasounds + citric acid + ethanol; L*, lightness; a*, redness-greenness; b*, blueness-yellowness; C, chroma; h°, hue angle; ΔE, total color difference compared to fresh quince.
The RR values obtained for the quince slices dried after the ten different pretreatments are shown in Table 2. Among the pretreatments used, the highest and lowest rehydration ratios were 3.27 for CA and 2.23 for BL+ET+US, respectively. RR values of US, ET, and ET+US samples were found to be close to each other (p≥0.05), but were significantly (p<0.05) lower than those of the CA sample. The microstructure of the sample was disrupted by US pretreatment. Thus, the water holding capacity of the cell was reduced, resulting in a lower RR [Ren et al., 2022]. Similar situation was also found in the samples treated with FT (p≥0.05). However, compared to US, ET, and ET+US samples, RR of the FT samples was lower. RR decreased with increasing pretreatment combinations in blanching samples (p<0.05). This indicates that the damage caused to the structure by ultrasound or the combination of ethanol and ultrasound was higher compared to blanching.
After applying various pretreatments, a change in L*, a*, b*, C, h°, and ΔE was observed compared to the fresh quince (Table 2). Generally, dried products exhibited higher a* and b* values than fresh quince, indicating browning during drying [Xu et al., 2021]. Among the pretreatments, the CA and FT resulted in the lowest L* values of quince slices, indicating browning reactions [Ren et al., 2022]. The prolonged drying time for the CA sample may also have been important. The ET or ET+US pretreatment had a major impact on enhancing lightness and reducing browning (high L* and b* values and low a* values) compared to CA and FT samples. This may be due to the decolorizing effect of alcohol which dissolved the pigments [Feng et al., 2019]. Moreover, after the FT pretreatment, the cellular structure of the samples is severely damaged, and the leakage of intracellular material can accelerate the browning reaction [Chao et al., 2022]. The FT quince slices were darker than the FT+US and FT+ET+US samples (p<0.05). This may be due to the prolonged thawing time (3 h). Following freeze damage, the combination of US supported thawing, and a significantly shorter drying time effectively preserved the L* values [Li et al., 2025]. L* and b* values of the BL samples were lower than those of the BL+US samples, and a* value was higher (p<0.05). The BL+ET+US sample was similar to the BL sample despite applying ultrasound and ethanol (p≥0.05). The BL+ET+US sample was first subjected to blanching (5 min) and then to ET+US pretreatment (5 min). The application of US and ET pretreatments after BL pretreatment did not result in a change in terms of color, on the contrary, it appeared to cause loss of time, solvent, and energy. The L* values of the ET and BL samples were similar, but lower in the FT sample. This indicates that ET and BL preserve the brightness better than FT. Slight changes in C, h°, and ΔE were observed between pretreatments. The highest ΔE and lowest C and h° were detected in the CA and FT samples. It can be concluded that combinations of pretreatments positively affected limited color change. Generally, the L* values of ethanol and combined pretreatment samples were found to be close to or higher than those of the fresh sample. In this case, it can be concluded that pretreatment combinations had a positive effect on the L* color parameter of the samples.
Effects of pretreatment on the phenolic profile and 5-hydroxymethylfurfural content of quince slices
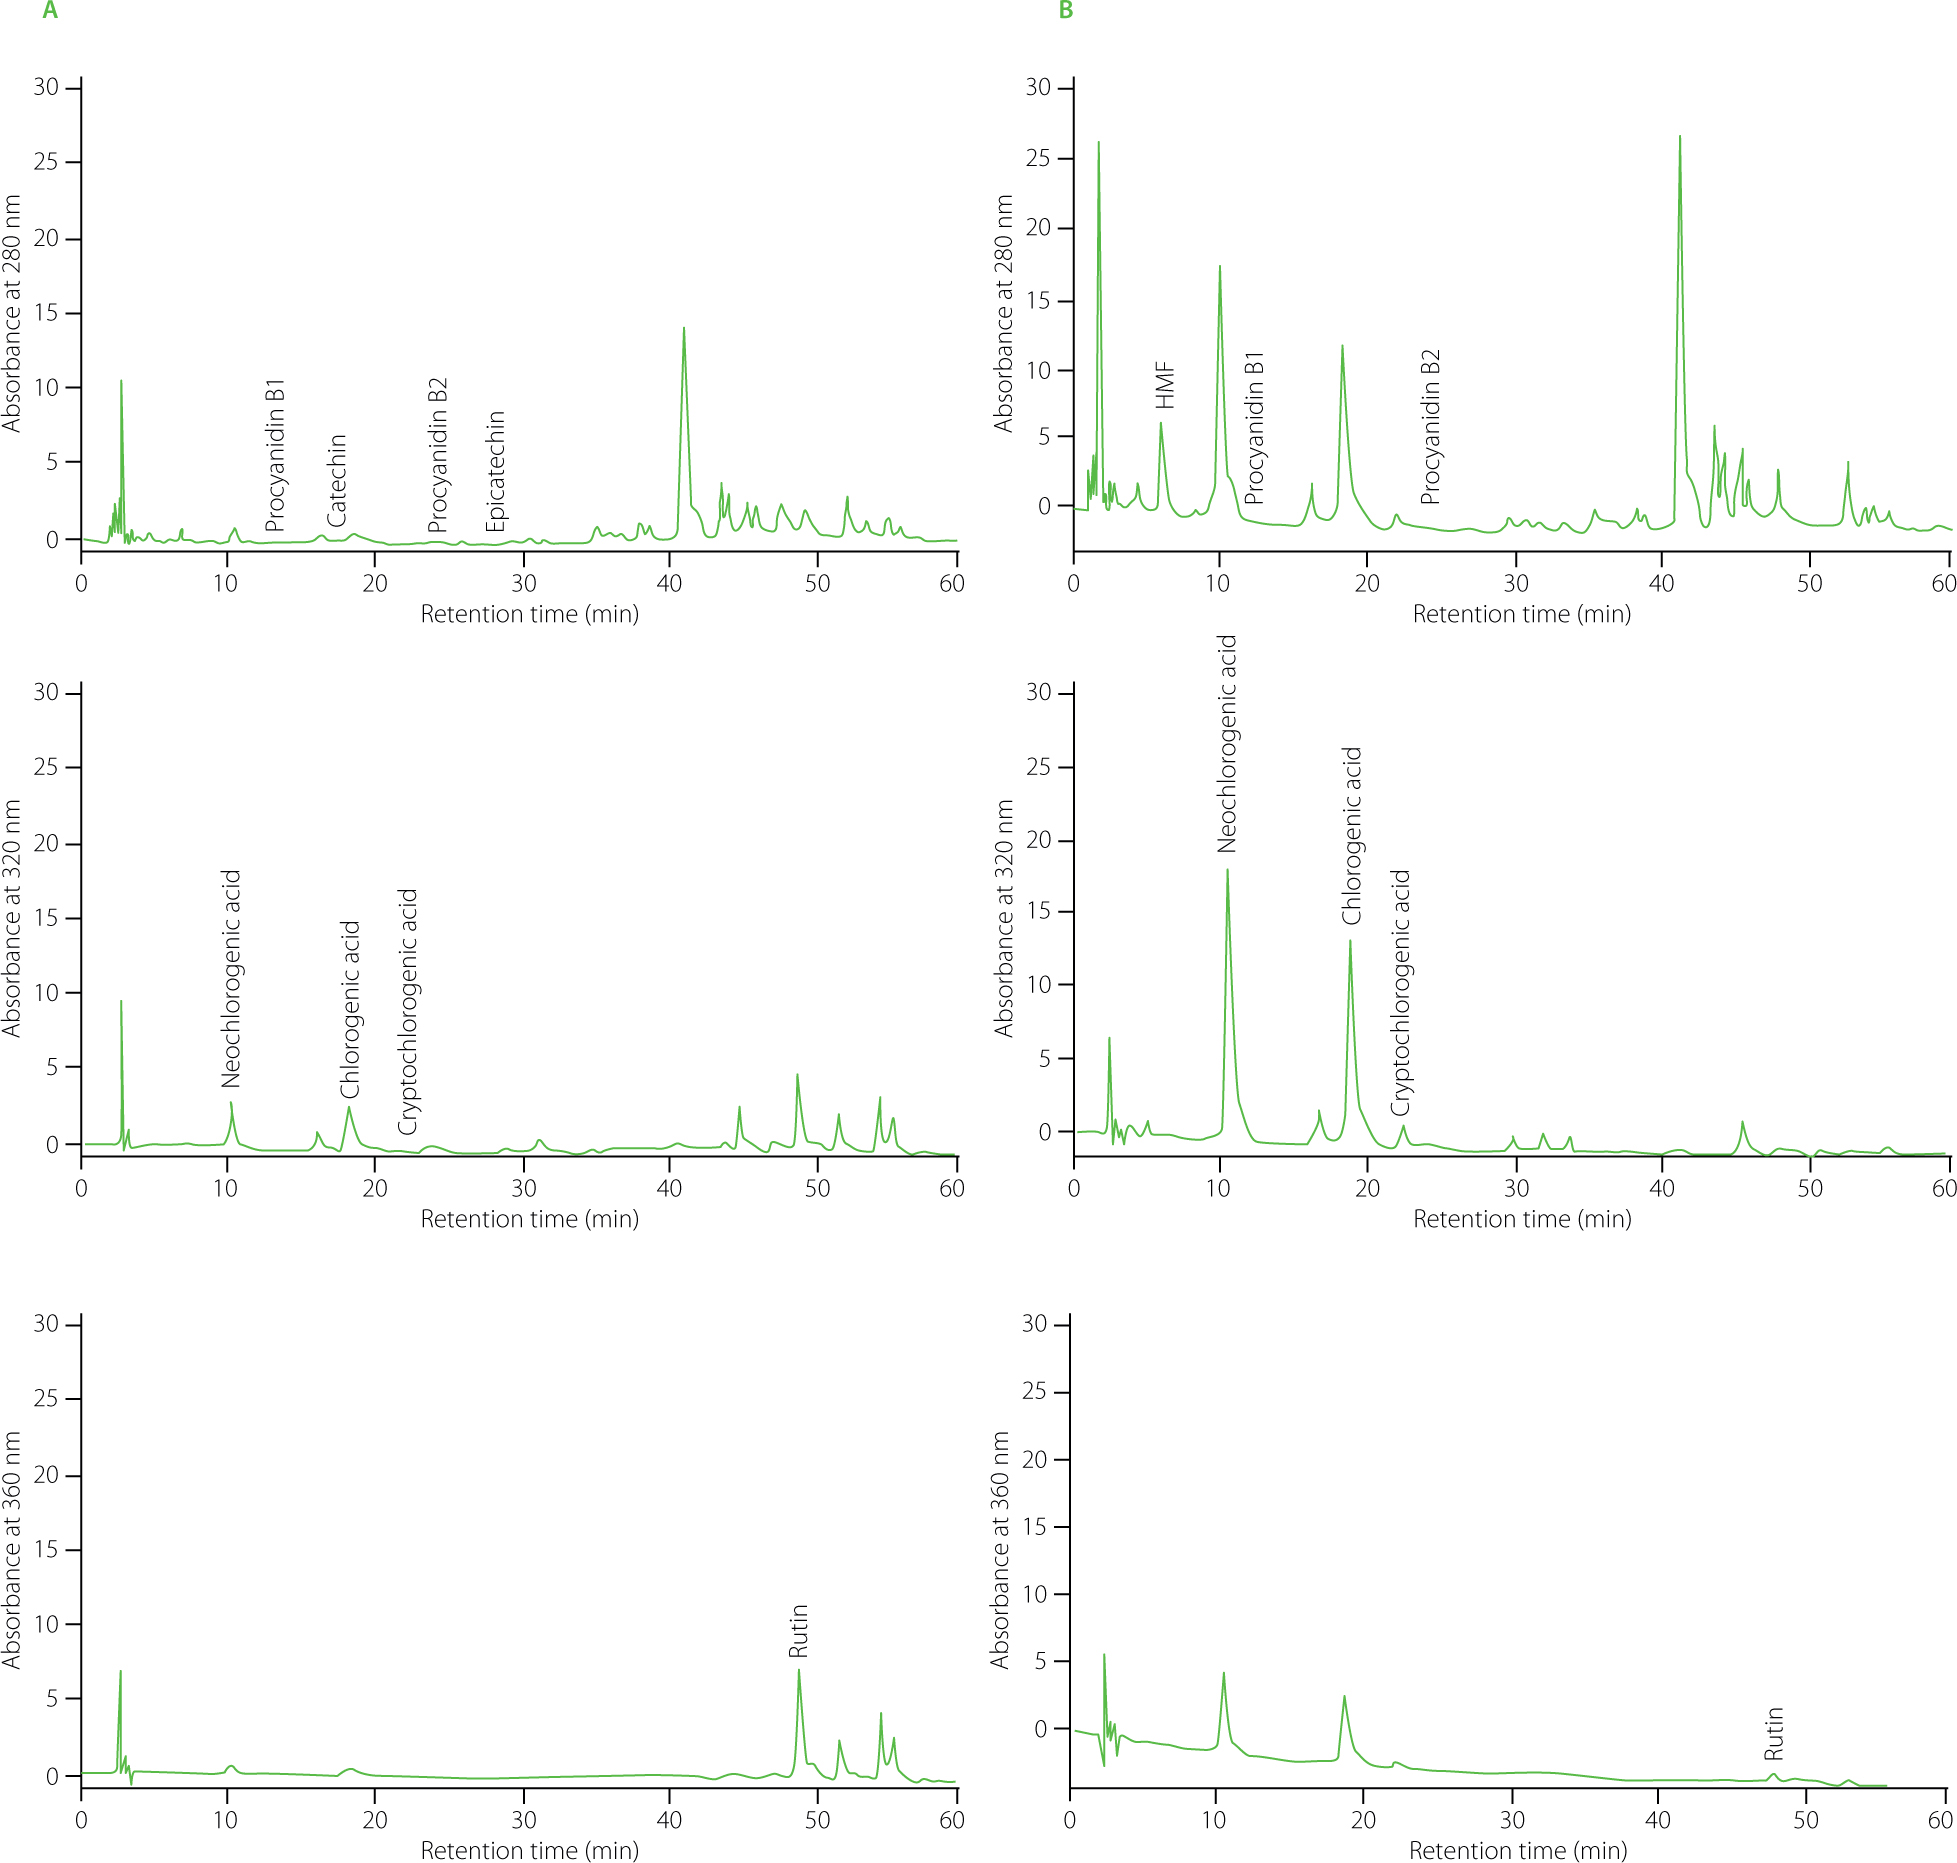
Procyanidins B1 and B2, chlorogenic acid, neochlorogenic acid, cryptochlorogenic acid, and rutin were detected in fresh and dried quince by HPLC method (Table 3). Chromatograms of separations of fresh and dried (US pretreatment) samples are given in Figure 1. Catechin and epicatechin were detected only in fresh samples (15.79±2.15 and 13.51±0.39 mg/kg DM) (not shown in the table). Similar results for catechin and epicatechin in pear were reported by Topuz et al. [2023]. In turn, da Silva et al. [2025] reported that epicatechin was not detected in pretreated (blanching, cooking, and combination with ethanol) and dried sweet potato samples. This could be due to the degradation of epicatechin during processing [da Silva et al., 2025]. In another study, the correlation between the polyphenol oxidase activity and catechin content was significant, and enzymatic degradation might have contributed to catechin losses [Zhu et al., 2022].
Table 3
Content of phenolics and 5-hydroxymethylfurfural (HMF) of fresh and dried quince slices after different pretreatments (mg/kg dry matter).
[i] Values are given as mean ± standard deviation. Lowercase letters indicate the difference between the samples in the same column according to Duncan multiple comparison test, uppercase letters indicate the difference between the same group of pretreated samples (p<0.05). CA, citric acid; US, ultrasounds + citric acid; ET, ethanol; ET+US, ethanol + ultrasounds; FT, freezing-thawing; FT+US, freezing-thawing + ultrasounds + citric acid; FT+ET+US, freezing-thawing + ethanol + ultrasounds; BL, blanching + citric acid; BL+US, blanching + ultrasounds + citric acid; BL+ET+US, blanching + ultrasounds + citric acid + ethanol; n.d., not detected.
Figure 1
HPLC chromatograms of fresh quince slices (A) and dried after ultrasound pretreatment (B). HMF, 5-hydroxymethylfurfural.
The procyanidin B1 content in the BL and BL+US samples, as well as the procyanidin B2 content in the CA and FT+US samples was similar to those determined in fresh quince slices (Table 3). CA, US, ET, and ET+US pretreatments did not differentiate the quince slices (p≥0.05) in terms of procyanidin B1 content; however, significantly decreased procyanidin B2 content (p<0.05) in the following order: US < CA < ET < ET+US. In all freeze-thawed samples, the contents of procyanidins B1 and B2 were similar (p≥0.05). Among the blanched samples, procyanidin B1 content was significantly lower (p<0.05) after pretreatment combination with ET and US compared to BL and BL+US. It has been reported that different pretreatment methods had varying effects on the procyanidin B2 content of apple samples [Zhu et al., 2022]; while the NaCl immersion and blanching pretreatments increased the procyanidin B2 content during air drying, it decreased when air drying with airborne sonication was applied.
It was found that chlorogenic acid was a major phenolic compound in all samples (Table 3). Chlorogenic acid, neochlorogenic acid, and cryptochlorogenic acid contents were higher in dried than in fresh quince slices (p<0.05) and tended to be highest in the ultrasound-treated samples except for BL samples, where the amount of these compounds tended to decrease with increasing pretreatment combinations. However, significant (p<0.05) differences in chlorogenic acid content were only found between BL-treated samples, while significant (p<0.05) differences in neochlorogenic acid content were identified between CA, US, ET, and ET+US samples. The increase in phenolics following BL pretreatment was primarily caused by the inactivation of polyphenol oxidase at high temperatures and a decrease in enzyme-induced degradation [Chao et al., 2022]. Chlorogenic, neochlorogenic, and cryptochlorogenic acids were lower in the FT, FT+ET+US, and BL+ET+US samples. The FT samples were thawed at room temperature for 3 h, while the FT+ET+US and BL+ET+US samples were exposed to a combination of three pretreatments. This might have caused degradation/extraction of these compounds. Chlorogenic acid is sensitive to temperature and oxygen as it easily degrades at high temperatures and atmospheric conditions [Liu et al., 2015].
The rutin content of fresh quince slices was higher than that of the dried ones (p<0.05). Rutin was not detected in the samples pretreated with BL+US, BL+ET+US, and FT+ET+US (Table 3). This is thought to be due to the combined effect of multiple pretreatment applications. Irondi et al. [2017] reported that the amount of rutin decreased in the blanched Adansonia digitata leaves compared to fresh material. The high blanching temperature may have disrupted the cell walls and broken down the phenolics, causing them to leach into the blanching water [Irondi et al., 2017]. Rutin degradation does not directly relate to the denaturation of polyphenol oxidase, since its content decreases more quickly as temperature rises [Miletić et al., 2013]. In our study, the US and FT+US samples had the highest rutin contents. It can be concluded that the US pretreatment was effective in preserving phenolic compounds in combination with other pretreatments except ET. In contrast, in combination with ET, it caused greater loss of components. Ethanol pretreatment may cause the extraction of these compounds [da Cunha et al., 2020].
In general, the highest levels of phenolics were detected in the US sample compared to the samples exposed to the other pretreatment methods. Similar findings were reported by Wang et al. [2025] in quince peels subjected to different pretreatments (US, FT, and BL). This phenomenon can be attributed to the fact that bound phenolics become more liberated as a result of the ultrasound treatment [Topuz et al., 2025]. In summary, our results indicate that the US pretreatment was the most effective in preserving and increasing procyanidin B1, B2, chlorogenic acid, neochlorogenic acid, and cryptochlorogenic acid.
HMF does not occur naturally in food products. It is formed as a result of Maillard reactions under the influence of heat treatment and other factors (concentration of reducing sugar, type of sugar, storage time and temperature, etc.) [Shapla et al., 2018]. HMF content of quince slices dried after the different pretreatments varied between 0 and 62.4 mg/kg DM (Table 3). HMF was detected only in the CA, US, FT, and BL samples. Its content was significantly (p<0.05) higher in dried quince slices after CA and FT pretreatments than in the US and BL samples. The high HMF content in the FT sample shows that cell damage, rather than just drying time, contributes to nonenzymatic browning [Du et al., 2026]. In the CA sample, HMF content was similar (p≥0.05) to that in the FT sample, most likely due to the long drying time. Shorter drying times help reduce HMF accumulation [Du et al., 2026]. Compared to the CA sample, the HMF content of the US sample decreased by 85.04%. It can be concluded that the ultrasound pretreatment plays a significant role in preventing HMF formation. The substrates causing HMF formation may have been degraded or extracted by the effect of pretreatments via blanching or ultrasounds. It can, therefore, be concluded that HMF is not detected when ET or a combination of several pretreatments is used. This might be due to the shorter drying time of samples treated with ethanol and reduced heat exposure of the product. Therefore, it appears that the drying parameters were not the factors influencing the HMF content in the product.
Total phenolic content, total flavonoid content, condensed tannin content, and their bioaccessibility rates as well as antioxidant activity and its retention after in vitro digestion
The TPC, TFC, and CTC of the quince slices are shown in Table 4, and their antioxidant activity (AA) (determined in DPPH and ABTS assays) is presented in Table 5. The TPC, TFC, DPPH• scavenging activity and ABTS•+ scavenging activity of the dried quince slices were higher than those of the fresh sample (except for BL+ET+US sample for ABTS assay). However, CTC was higher in some dried samples (US, ET, BL, and BL+US). The highest TPC, TFC, CTC, and AA in both assays were detected in the US-pretreated samples. US pretreatment enhanced the extractability of bioactive compounds and reduced their degradation [Wang et al., 2025]. ET and ET+US pretreatments resulted in a significant decrease in TPC, TFC, CTC, and AA (p<0.05). Dried quince slices after all FT pretreatments had lower TPC, TFC, CTC, and AA compared to those exposed to the US pretreatment because freeze-thawing damages the cell structure [Xu et al., 2021]. In addition, the thawing process has accelerated the breakdown of compounds that are sensitive to heat and oxidation [Li et al., 2025]. DPPH• scavenging activity decreased with increasing pretreatment combination in the freeze-thawed samples, and in both antioxidant assays, radical scavenging activity was highest in the FT sample (p<0.05). Furthermore, as indicated by data from Table 4, the TPC in the FT sample was higher than in the FT+US and FT+ET+US samples, which may be the main reason for the higher AA. Although blanching deteriorated quince quality, it was still better than that of the combined ethanol sample. Gonçalves et al. [2009] reported that blanching caused a significant reduction in the TPC of broccoli, probably due to thermal degradation and water leaching events. Additionally, BL pretreatment, likewise FT, can damage cell structures, increasing porosity and surface area. This may accelerate the release and subsequent degradation or oxidation of bioactive compounds during drying [Wang et al., 2025]. Among all blanched samples, the highest DPPH• and ABTS•+ scavenging activities and TPC were found in the BL+US sample (p<0.05). Xu et al. [2023] reported that thermoultrasound blanching significantly enhanced the inactivation efficiency of peroxidase and polyphenol oxidase compared to hot water blanching. Therefore, the TPC and antioxidant activity of the BL+US samples may be higher. The combination of blanching with ethanol and ultrasound as a pretreatment significantly affected TPC, TFC, CTC, and AA in ABTS and DPPH assays (p<0.05). This finding confirms that the combination of ET and US as a pretreatment decreased TPC, TFC, CTC, DPPH• scavenging activity, and ABTS•+ scavenging activity. The fact that the dried quince slices after the ET+US, FT+ET+US, and BL+ET+US pretreatments contained less bioactive compounds can be explained as follows: the use of ethanol pretreatment facilitates the extraction and thus the loss of phenolics [da Cunha et al., 2020]. As the increase in the combination of pretreatments would reduce the drying time, it caused a decrease in TPC, TFC, CTC, and antioxidant activity. In summary, US had a positive effect on the retention of bioactive compounds during the VCIR of quince.
Table 4
Total phenolic content (TPC), total flavonoid content (TFC), and condensed tannin content (CTC) of fresh and dried quince slices after different pretreatments, and their bioaccessibility after in vitro gastrointestinal digestion (GID).
[i] Values are given as mean ± standard deviation. Lowercase letters indicate the difference between the samples in the same column according to Duncan multiple comparison test, uppercase letters indicate the difference between the same group of pretreated samples (p<0.05). CA, citric acid; US, ultrasounds + citric acid; ET, ethanol; ET+US, ethanol + ultrasounds; FT, freezing-thawing; FT+US, freezing-thawing + ultrasounds + citric acid; FT+ET+US, freezing-thawing + ethanol + ultrasounds; BL, blanching + citric acid; BL+US, blanching + ultrasounds + citric acid; BL+ET+US, blanching + ultrasounds + citric acid + ethanol; DM, dry matter; GAE, gallic acid equivalent; QE, quercetin equivalent; CE, catechin equivalent.
Table 5
DPPH• and ABTS•+ scavenging activities of fresh and dried quince slices after different pretreatments, and their retention after in vitro gastrointestinal digestion (GID).
[i] Values are given as mean ± standard deviation. Lowercase letters indicate the difference between the samples in the same column according to Duncan multiple comparison test, uppercase letters indicate the difference between the same group of pretreated samples (p<0.05). CA, citric acid; US, ultrasounds + citric acid; ET, ethanol; ET+US, ethanol + ultrasounds; FT, freezing-thawing; FT+US, freezing-thawing + ultrasounds + citric acid; FT+ET+US, freezing-thawing + ethanol + ultrasounds; BL, blanching + citric acid; BL+US, blanching + ultrasounds + citric acid; BL+ET+US, blanching + ultrasounds + citric acid + ethanol; DM, dry matter.
TPC, TFC, and CTC bioaccessibility, and antioxidant activity retention after gastrointestinal digestion (GID) in the fresh quince were higher than in the dried quince (Tables 4 and 5, respectively). TPC, TFC, CTC, and DPPH• and ABTS•+ scavenging activities of the fresh and dried samples decreased after GID. This decrease may be related to the degradation of phenolics due to enzyme activity and increased pH [Ozdemirli & Kamiloglu, 2024]. CTC bioaccessibility was very low, especially in the dried samples (27.93–56.36%). Bouayed et al. [2012] reported that catechin, procyanidins B1, and B2 were not found in the intestinal phase. Therefore, CTC bioaccessibility may have been lower. TPC, TFC, and CTC bioaccessibility and AA retention of the US sample were higher than those of the CA, ET, and ET+US samples (p<0.05). TPC, DPPH• scavenging activity, and ABTS•+ scavenging activity after GID, and their bioaccessibility/retention decreased with increasing pretreatment combination in freeze-thawing samples. This change was found to be insignificant only for DPPH• scavenging activity retention (p≥0.05). In all freeze-thawed samples, the highest TFC-GID and CTC-GID values were found in the FT+US samples (p<0.05). In the blanched samples, TPC and AA after GID and their bioaccessibility/retention were highest in the BL+US sample, while TFC-GID and CTC-GID and their bioaccessibility started to decrease with increasing pretreatment combinations (p<0.05). Generally, all pretreatments were found to significantly reduce TPC, TFC, and CTC bioaccessibility, as their pretreatments may cause damage to the cell walls of the samples, while the ambient pH change during in vitro digestion may lead to degradation of phenolic compounds and reduce their AA.
Inhibitory effects on α-glucosidase activity
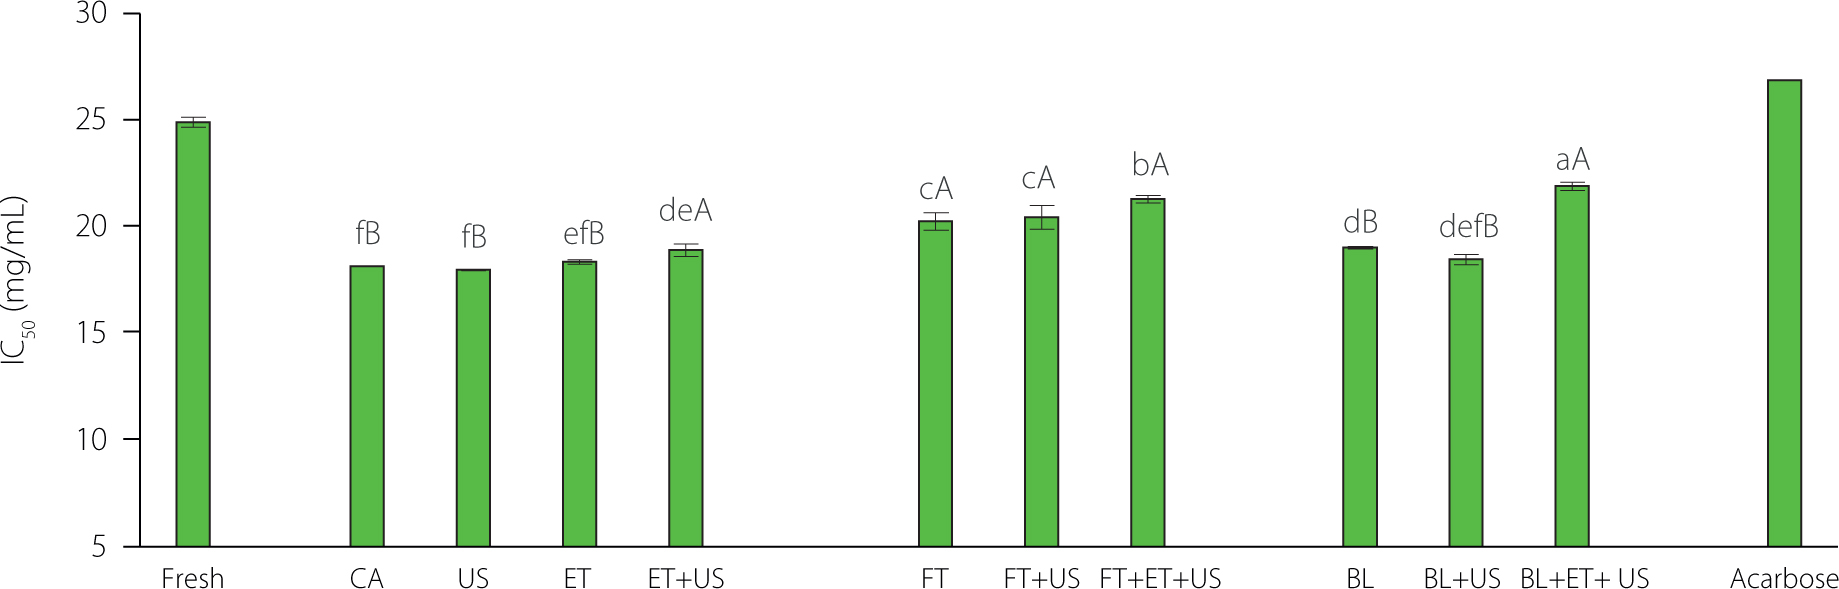
Antioxidants, including phenolics, can prevent the damage to β-cells by inhibiting the peroxidation chain reaction, potentially guarding against the onset of diabetes [Aslan et al., 2010]. They can improve β-cell function, stimulate insulin secretion, and improve adipose tissue metabolism [Lin et al., 2016]. Futhermore phenolics, particularly flavonoids, phenolic acids and tannins, possess the ability to inhibit α-glucosidase and α-amylase, which are responsible for digesting dietary carbohydrates into glucose, and thus can modulate carbohydrate and lipid metabolism [Lin et al., 2016]. The ability of extracts from fresh and dried quince to inhibit α-glucosidase is shown in Figure 2. The inhibitory activity of the samples against α-glucosidase expressed as IC50 values ranged from 17.94 to 24.84 mg/mL. Extracts from dried quince slices showed higher α-glucosidase inhibition activity than those from the fresh sample (p<0.05). Regardless of the method, the pretreatment process contributed to the increase in the antidiabetic activity. The inhibitory effect on α-glucosidase may be due to phenolic compounds present in the extracts [Irondi et al., 2017]. The α-GIA of the CA, US, and ET samples was similar (p≥0.05), but higher than that of the ET+US sample (p<0.05). α-Glucosidase inhibition decreased with increasing pretreatment combinations in the FT samples. However, this decrease was found to be insignificant (p≥0.05). The α-GIA of the CA, US, ET, ET+US, BL, and BL+US samples was higher than of all freeze-thawed samples (p<0.05). Contrary to our study, Irondi et al. [2017] reported that the inhibitory effect of Adansonia digitata leaf extract on α-glucosidase activity decreased due to blanching. In our study, this changed in proportion to the decrease in phenolic compound levels. Fresh and dried samples showed higher α-GIA than acarbose. Similar findings were reported by Uğurlu & Bakkalbaşı [2024] for apple chips. Due to their high content of bioactive compounds, both fresh and dried quince slices, especially the US sample, can be utilized as a food source with antidiabetic potential.
Figure 2
α-Glucosidase inhibitory activity of extracts from fresh and dried quince slices after different pretreatments. Values are given as mean ± standard deviation. Different lowercase letters indicate significant difference between samples, uppercase letters indicate difference between the same group of pretreated samples (p<0.05). CA, citric acid; US, ultrasounds + citric acid; ET, ethanol; ET+US, ethanol + ultrasounds; FT, freezing-thawing; FT+US, freezing-thawing + ultrasounds + citric acid; FT+ET+US, freezing-thawing + ethanol + ultrasounds; BL, blanching + citric acid; BL+US, blanching + ultrasounds + citric acid; BL+ET+US, blanching + ultrasounds + citric acid + ethanol; IC50, concentration of the extract required to inhibit 50% of the α-glucosidase activity.
Principal component analysis results
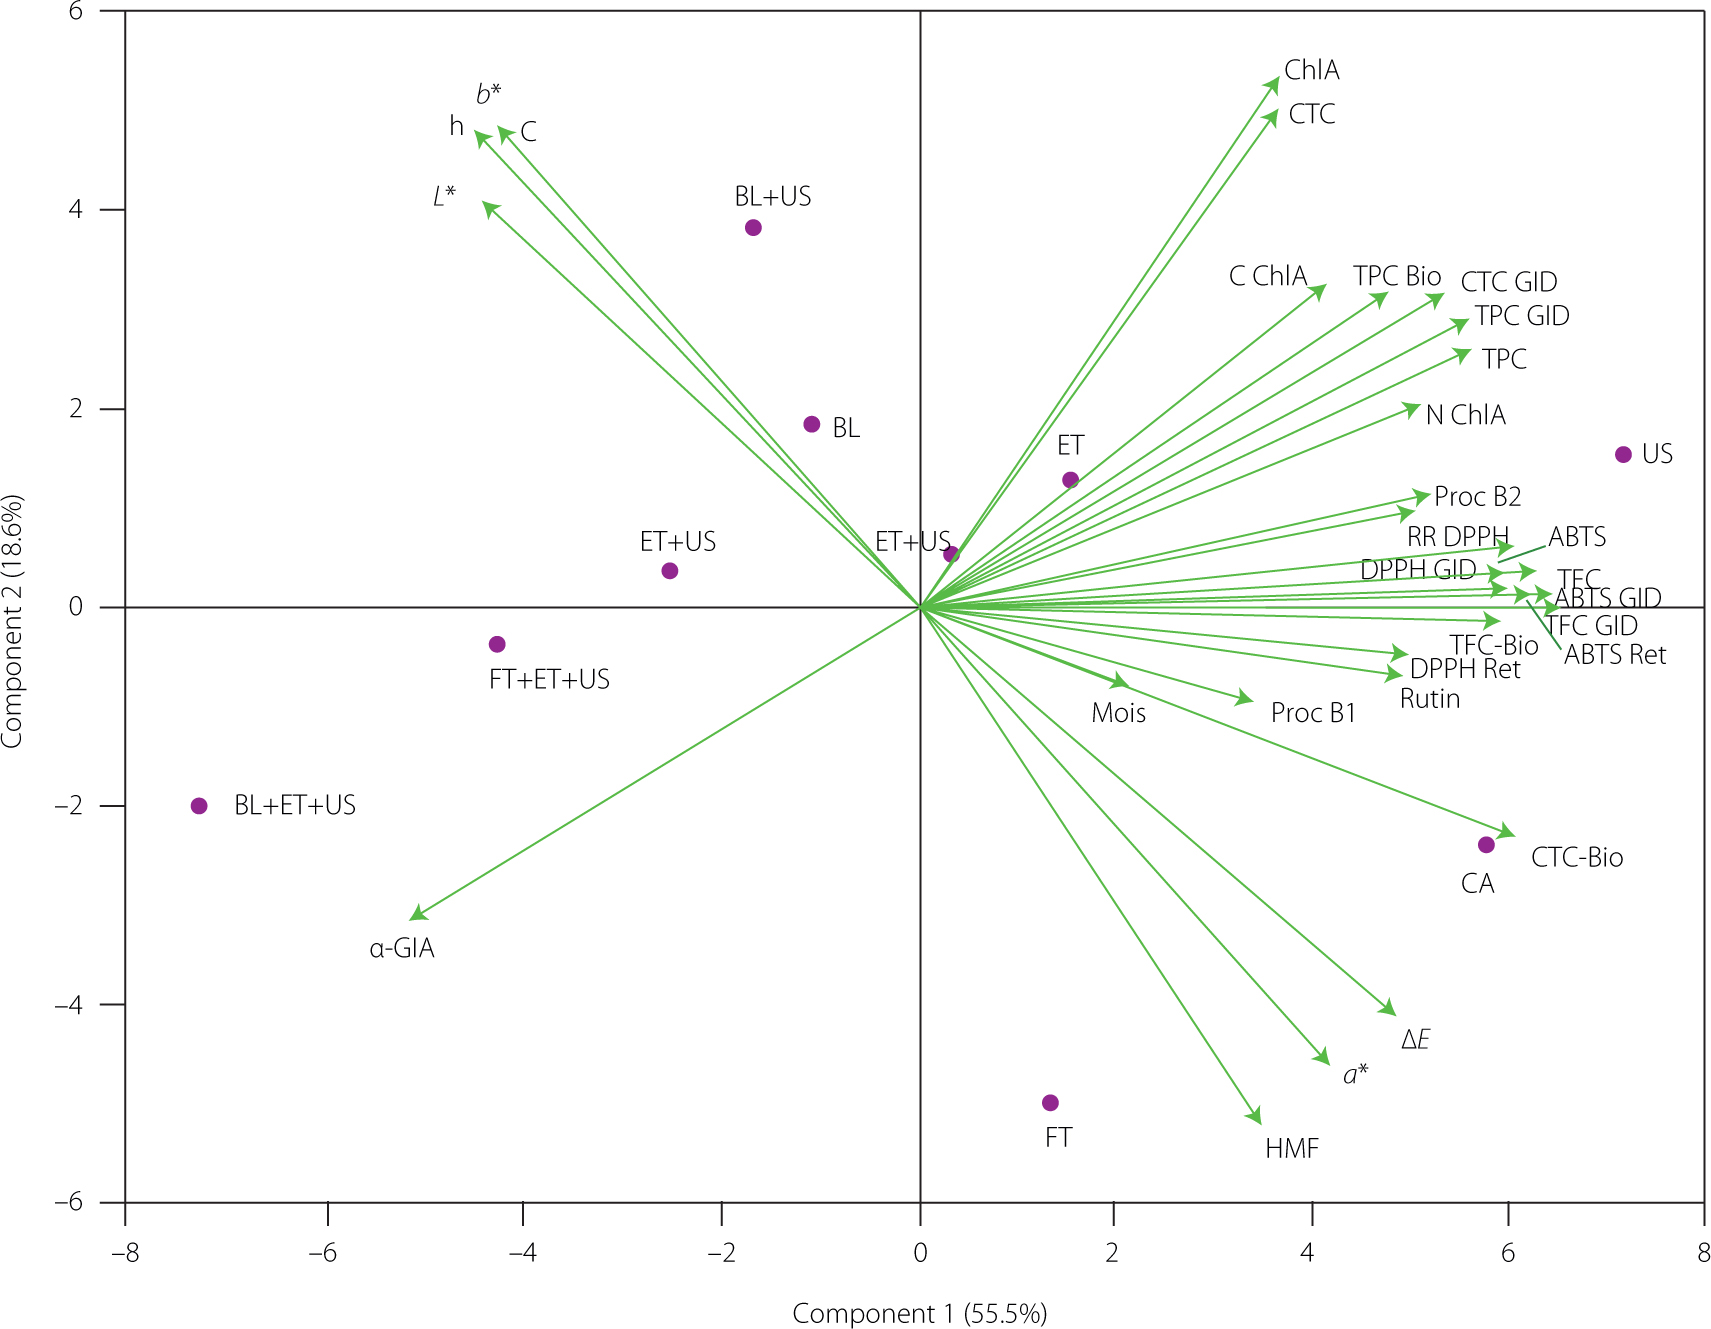
PCA was performed using the correlation matrix to calculate the eigenvalues, percentages of variation, and load coefficients of the first three principal components for all the properties studied. The PCA results are presented in the form of a biplot (Figure 3). The first three principal components accounted for 55.5, 18.6, and 8.0% of the total variation, respectively. The cumulative proportion of the variation approached 82.1% of the total variation. The traits contributing to this high variation in the first principal component (PC1) were RR, neochlorogenic acid, TPC, TPC-GID, TFC, TFC-GID, TFC bioaccessibility, CTC bioaccessibility, ABTS•+ scavenging activity, ABTS•+ scavenging activity after GID, and ABTS•+ scavenging activity retention. The effects of all these traits on variation were similar. Traits contributing to the second PCA component (PC2) were moisture, L*, a*, b*, C, h°, ΔE, HMF, chlorogenic acid, TPC bioaccessibility, CTC, CTC GID, and α-GIA. The effects of α-GIA on the variation were less pronounced than others, and only the effects of a*, ΔE, HMF, and α-glucosidase inhibitory activity were negative in PC2. As expected, a strong negative correlation was found between L* and a* and HMF. The third principal component (PC3) was primarily related to moisture, procyanidin B1 and B2, cryptochlorogenic acid, rutin, DPPH• scavenging activity, DPPH• scavenging activity after GID, and DPPH• scavenging activity retention. The effect of procyanidin B1 and DPPH retention was stronger than of the other traits in PC3. L* and HMF confirmed their inverse relationship by pointing in opposite directions on the graph. Additionally, the positions of the samples with FT and CA pretreatments on the biplot indicated their higher HMF content compared to the other samples. The position of the a* value, indicating increased browning due to Maillard reactions, was consistent with treatments with longer drying times. The moisture content is located near the centre, indicating a moderate level of variation between applications and limited discriminating power in the PCA space. TPC, TFC, AA and their retention, along with phenolic compounds, contributed most significantly to the dispersion patterns of single pretreatments. A clear distinction was observed between single/double and triple pretreatment combinations. Compared to other pretreatments, the US pretreatment was clearly positioned above and to the right of the PC1 axis and exhibited a quality profile characterized by better preservation of certain sensitive bioactive compounds. The samples subjected to the triple pretreatment combination cover the lower left quadrant. This indicates that significant losses in phenolic compounds were associated with physicochemical changes such as extraction/degradation and exposure to oxygen.
Figure 3
Biplot of principal component analysis. CA, citric acid; US, ultrasounds + citric acid; ET, ethanol; ET+US, ethanol + ultrasounds; FT, freezing-thawing; FT+US, freezing-thawing + ultrasounds + citric acid; FT+ET+US, freezing-thawing + ethanol + ultrasounds; BL, blanching + citric acid; BL+US, blanching + ultrasounds + citric acid; BL+ET+US, blanching + ultrasounds + citric acid + ethanol; ABTS, ABTS•+ scavenging activity; ABTS-Ret, retention of ABTS•+ scavenging activity; ABTS-GID, ABTS after gastrointestinal digestion; DPPH, DPPH• scavenging activity; DPPH-Ret, retention of DPPH• scavenging activity; DPPH-GID, DPPH• scavenging activity after gastrointestinal digestion; TPC, total phenolic content; TPC-Bio, bioaccessibility of total phenolic content; TPC-GID, total phenolic content after gastrointestinal digestion; TFC, total flavonoid content; TFC-Bio, bioaccessibility of total flavonoid content; TFC-GID, total flavonoid content after gastrointestinal digestion; CTC, condensed tannin content; CTC-Bio, bioaccessibility of condensed tannin content; CTC-GID, condensed tannin content after gastrointestinal digestion; ProcB1, procyanidin B1; ProcB2, procyanidin B2; ChlA, chlorogenic acid; N-ChlA, neochlorogenic acid; C-ChlA, cryptochlorogenic acid; HMF, 5-hydroxymethylfurfural; α-GIA, α-glucosidase inhibitory activity; RR, rehydration ratio; Mois, moisture; L*, lightness; a*, redness-greenness; b*, blueness-yellowness; C, chroma; h°, hue angle; ΔE, total color difference.
CONCLUSIONS
This study investigated the effects of citric acid, ultrasound, ethanol, freeze-thawing, and blanching pretreatments and their various combinations on some physicochemical properties and bioactive compounds of dried quince. Pretreatment combinations caused a decrease in drying time. RR decreased significantly in the samples with more than two pretreatment combinations. CA and FT pretreatments were found to result in samples with darker appearance and the highest HMF content. The US pretreatment resulted in a higher phenolic content, AA, phenolic bioaccessibility, and α-GIA in dried samples than the combined pretreatments. Thus, pretreatments used alone are more effective than those applied in combination in reducing quality losses in products exposed to VCIR, and ultrasound was the most suitable pretreatment method. In this study, ultrasound was found to have a significant potential to improve product quality, either alone or in combination, in which it is included, thus paving the way for its inclusion in pretreatments to obtain healthy products in the food industry. In vivo studies are also required to fully understand the effect of these pretreatments on the bioaccessibility of phenolics and α-GIA of quince.