INTRODUCTION
Medicinal mushrooms, like chaga (Inonotus obliquus (Ach. Ex Pers.) Pilat), Cordyceps sinensis (Ophiocordyceps sinensis (Berk.) G.H. Sung, J.M. Sung, Hywel-Jones and Spatafora), reishi (Ganoderma lucidum (Curtis) P. Karst), and lion’s mane (Hericium erinaceus (Bull.) Pers.), have been well-known and applied in the Chinese medicine from centuries. Recently, they have been increasingly used as food additives because they are regarded as a source of bioactive compounds, such as polysaccharides (e.g., β-d-glucans), phenolic compounds, triterpenoids, active peptides, and sterols [Cateni et al., 2022; Łysakowska et al., 2023; Sousa et al., 2023] which show anticancer, antioxidant, antidiabetic, and immunomodulatory properties [Reis et al., 2017; Song et al., 2020]. However, the chemical composition of individual mushrooms depends on the fungus strain, cultivation conditions, degree of maturity, and anatomical part of the mushroom the additive was sourced from [Barros et al., 2007; Cateni et al., 2022].
Recently, food products enriched with health-promoting additives have become increasingly popular among consumers due to their growing interest in foods with properties that prevent and/or cure various ailments. Wheat products, like bakery products and pasta, are still regarded as staple foods in the Western diet. For this reason, they can serve as good carriers of health-promoting bioactive compounds of medicinal mushrooms. Two of the medicinal mushroom species, reishi and shitake, have been used the most often as food additives [Łysakowska et al., 2023]. Mushroom addition to food products positively affects their chemical composition by increasing the contents of protein, total and insoluble dietary fibre, phenolic compounds, and micro- and macroelements [Reis et al., 2017]. On the other hand, the mushroom enriched-food products show a worse taste, texture, flavour, and appearance. Whether the changes observed in the technological quality of the product are positive or negative depends on the amount and type of powdered mushroom added, especially in the case of wheat bread and pasta [Lu et al., 2016; 2018]. If less than 5% of wheat flour is replaced by powdered mushroom, then usually no negative changes are observed in the quality of wheat bread dough [Lu et al., 2018]. If the wheat flour substitution with the mushroom powder is greater than 5%, then a product with deteriorated technological quality is obtained. Reduction in the technological and sensory quality of a wheat bread and pasta was observed as a result of the bread enrichment with white button, shitake and porcini mushrooms [Lu et al., 2016; 2018], reishi mushroom [Łysakowska et al., 2024], and lion’s mane [Łysakowska et al., 2025a; Ulziijargal et al., 2013]. However, the addition of some mushrooms may improve the sensory quality of wheat products, like wheat bread made of wheat flour replaced by 5% and 10% of king trumpet mushroom (Pleurotus eryngii) powder [Gaglio et al., 2019], and biscuits with 10–20% of oyster mushroom (Pleutorus ostreatus) [Baltacioglu et al., 2021].
Reduction in the wheat product quality is partially related to the competition for water between the gluten network and mushroom dietary fibre during dough mixing. The smaller amount of water available to the gluten network during this process affects its structure and the types of water populations present in the network [Nawrocka et al., 2017]. Hence, the aim of this research was to determine how powders from four medicinal mushrooms, differing in the chemical composition, influenced the secondary structure and water populations of the gluten proteins in doughs. The changes were determined for dough samples prepared from wheat flour and durum semolina substituted with mushroom powders (3–12%, w/w) by means of the Fourier transform infrared spectroscopy.
MATERIALS AND METHODS
Materials and chemicals
Wheat flour type 750 was produced by Polskie Młyny (Warsaw, Poland), while semolina (a durum wheat milling product) was produced by Julia Malom (Kunszallas, Hungary). The ash content of the raw materials was determined according to the AACC method 08-01, while the wet gluten content, dry gluten content, gluten index, and gluten water binding capacity were determined according to the AACC method 38-12.02 [AACC, 2010]. The average particle size was analysed using the method described by Kasprzak & Rzedzicki [2012].
Farinographic measurements of durum semolina were conducted using a Farinograph-E (Brabender, model 8110142, Duisburg, Germany) according to the AACC method 54-21 [AACC, 2010], and respective results are provided in Table 1. Farinographic parameters of wheat flour type 750 were consistent with the results published by Łysakowska et al. [2025a], as the same raw material was used in both studies.
Table 1
Quality parameters of wheat flour and semolina used in the study.
[i] * Chemical composition and farinographic parameters of wheat flour were taken from Łysakowska et al. [2025a].
The medicinal mushrooms: chaga (Inonotus obliques (Ach. Ex Pers.) Pilat), Cordyceps sinensis (Ophiocordyceps sinensis (Berk.) G.H. Sung, J.M. Sung, Hywel-Jones and Spatafora), reishi (Ganoderma lucidum (Curtis) P. Karst), and lion’s mane (Hericium erinaceus (Bull.) Pers.) in the powdered form were purchased from NatVita (Mirków, Poland). The same C. sinensis, reishi and lion’s mane powders were used in previous studies, in which the dietary fibre, fat and protein contents were determined: C. sinensis – 48.1 g/100 g d.m., 5.6 g/100 g d.m., 33.7 g/100 g d.m., respectively [Łysakowska et al., 2025b]; reishi – 72.8%, 0.99%, 15.5%, respectively [Łysakowska et al., 2024]; and lion’s mane – 54.4%, 1.92%, 21.2%, respectively [Łysakowska et al., 2025a].
Acetonitrile and methanol (both liquid chromatography – mass spectrometry (LC-MS) grade) were obtained from Thermo Fisher Scientific (Waltham, MA, USA). Formic acid (LC-MS grade), deuterium oxide (D2O) and sodium chloride were purchased from Merck KGaA (Darmstadt, Germany). MilliQ water was obtained using a purification system (Millipore DirectQ3-UV, Merck KGaA, Darmstadt, Germany). Extracts were filtered through a 0.20 μm, 4 mm titan syringe filter (Thermo Fisher Scientific). Double-distilled water was used to prepare wheat flour and semolina doughs.
Preparation of the phenolic extracts from mushroom powders
Phenolic extracts from mushroom powders were prepared using a method described by Sivam et al. [2013]. Briefly, each of the mushroom powders (4 g) was compacted in a stainless- steel extraction cell of 22 mL. The extraction process was carried out three times with 95% methanol in an accelerated solvent extraction (ASE) extractor (ASE 350, Dionex Corporation, Sunnyvale, CA, USA). The following extraction conditions were set in the extractor: pressure – 1,500 psi, extraction temperature – 42°C, cycle time – 10 min, and static volume – 60%.
Determination of the phenolic profile of the medicinal mushrooms
The phenolic profile of mushroom extracts was determined using a liquid chromatograph (1290 Infinity, Agilent Technologies, Santa Clara, CA, USA) coupled to a quadrupole time-of-flight mass spectrometer (6550 iFunnel Q-TOF LC/MS, Agilent Technologies). LC separation was performed using an Agilent RRHD C18 Extend analytical column (2.1×100 mm, 1.8 µm) thermostated at 45°C. To this end, 1 µL of the diluted extract was injected onto the column and elution was carried out with a mobile phase consisting of solvent A – 0.1% (v/v) formic acid in water and solvent B – 0.1% (v/v) formic acid in acetonitrile, used in a gradient system (0–25 min, 3–95% B; 25–30 min, 95% B). The mobile phase flow rate was 0.4 mL/min. An Agilent Jet Stream Technology ion source (electrospray ionization, ESI) operated in the positive ion mode. It utilised nitrogen at 225°C with the flow rate of 12 L/min. Nebulizer pressure was 50 psi. Sheath gas temperature and flow rate were 275°C and 12 L/min, respectively. The voltage of capillary, nozzle and fragmentor was set at 3,500; 1,000; and 275 V, respectively. Ions were acquired in the MS scan mode at a rate of 1.2 spectra/s, and in the targeted MS/MS mode at a rate of 8 spectra/s for MS spectra and 4 spectra/s for MS/MS spectra. The MS/MS spectra were collected at a collision energy of 10 and 20 eV. Reference ions m/z 121.0509 and m/z 922.0098 were used for internal mass calibration. Agilent Mass Hunter Data Acquisition software (B.09.00) and Agilent Mass Hunter Qualitative software (B.10.00) were used for instrument control and data processing, respectively.
Liquid chromatography quadrupole time-of-flight mass spectrometry data processing
A literature review was conducted on the analysed mushroom species, based on which a list of compounds with previously confirmed presence by other researchers was compiled [Friedman, 2015; Hwang et al., 2016; Kim, 2020; Kolniak-Ostek et al., 2022; Tang et al., 2022; Wang et al., 2021]. The results obtained from the MS-level analysis were screened by extracting ions (extracted ion chromatogram, EIC) corresponding to the masses of the compounds on the established list and isotopic pattern. The ions that showed a match were then subjected to fragmentation, and the resulting fragment spectra were compared with reference spectra in the following databases: METLIN Metabolite Personal Compound Database and Library (https://metlin.scripps.edu/, Agilent Technologies, Santa Clara, CA, USA) [Guijas et al., 2018; Smith et al., 2005], Human Metabolome Database (HMDB) (https://www.hmdb.ca/) [Wishart et al., 2002; 2007], and the Reference Metabolome Database of Plants (https://www.biosino.org/RefMetaDB/) [Shi et al., 2024].
Moreover, the ions with the highest intensity were selected from the base peak chromatogram (BPC) and subjected to fragmentation. The resulting fragment spectra were searched for matches against the reference spectra in the aforementioned databases.
Preparation of doughs enriched with mushroom powders
The wheat flour and durum semolina doughs without (controls) and with mushroom powders were prepared in a Farinograph E equipped with a 50 g-mixer (Brabender, Germany) according to a standard ICC 115/1 method of the International Association for Cereal Science and Technology [1992]. Water content was determined using the Farinograph E for wheat flour and durum semolina samples separately by adding water until the dough consistency was 500 FU. The amount of water added was different for wheat flour and durum semolina. The doughs enriched with mushroom powders were prepared using the same amount of water as in the control samples. The time of dough mixing was 20 min. Wheat flour or semolina was substituted by the medicinal mushroom powders in the amounts of 3%, 6%, 9%, and 12% (w/w). The dough samples (control as well as doughs enriched with mushroom powder) were prepared in triplicate.
Preparation of dough samples for Fourier transform infrared spectroscopy measurements
The wheat flour/semolina dough samples after mixing process (averaged from three replicates) were freeze-dried for 24 h and pulverised. Before Fourier transform infrared spectroscopy (FT-IR) measurements, approximately 0.5 g of the powdered dough samples were put in an exicator and moisturised by a 10% (v/v) aqueous solution of deuterium oxide to eliminate water oscillations from the amide I band [Nawrocka et al., 2017].
Fourier transform infrared spectroscopy measurements and analysis of structural changes
The FT-IR spectra were recorded using a Nicolet 6700 FT-IR spectrometer (Thermo Scientific, Madison, WI, USA) equipped with a diamond attenuated total reflection (ATR) attachment. Spectra collection and data manipulation were carried out according to Nawrocka et al. [2017]. For each dough sample, five FT-IR spectra were collected and averaged before calculation of difference spectra. The difference spectra were calculated by subtraction of the control sample spectrum from the spectrum of a dough sample enriched with the mushroom powders. The average difference spectra were analysed to provide qualitative information about changes in the gluten secondary structure. The spectra were processed using ORIGIN software (v.2019b PRO, OriginLab Corporation, USA). Changes in the gluten secondary structure determined by the analysis of difference spectra in the amide I (1,570–1,720 cm−1) and amide III (1,200–1,340 cm−1) bands were determined according to Yang et al. [2015] and Stani et al. [2020], respectively. In other words, positive and negative bands present in the difference spectrum were assigned to the particular secondary structures.
RESULTS AND DISCUSSION
Profile of phenolic compounds of the medicinal mushroom powders
Phenolic compounds, especially those characterized by strong antioxidative properties, are very important for the consumers and bakery industry. Nowadays, consumers are very interested in purchasing food products that have positive impact on their health. Phenolics are considered to have a positive effect on human health. However, they can have a negative effect on the production process of wheat bread, e.g., cause dough breakdown if too much of this type of compound is used [Krekora et al., 2020]. For these reasons, the phenolic profile of the food additives used should be determined.
Phenolic compounds identified in the studied mushrooms are listed in Table 2. Chaga powder contained 3,4-dihydroxybenzaldehyde, syringic acid, ficusol, methyl isovanillate, cnidioside A, and zingerone. Analysis of the C. sinensis extract showed the presence of daidzein, genistein, glycitein, cnidioside A, tectorigenin, and formononetin. In turn, methyl isovanillate, sinapic acid, cnidioside A, neovestitol, and zingerone were found in the reishi extract. Whereas lion’s mane extract also contained daidzein, glycitein, genistein, cnidioside A, and 10-deoxygerfelin. 3,4-Dihydroxybenzaldehyde in the chaga powder was also detected by Hwang et al. [2016], whereas sinapic acid and vanillin were also found in reishi mushrooms by Szydłowska-Tutaj et al. [2023].
Table 2
Retention times (Rt), measured mass-to-charge ratio (m/z)of molecular ions in positive electrospray ionization mode, m/zof fragment ions (MS/MS ions), collision energy (CE), compound formula, corresponding theoretical m/z, and accuracy of phenolic compounds identified in the Inototus obliquus (chaga, Ch), Ophiocordyceps sinensis (Cordyceps sinensis, C), Ganoderma lucidum (reishi, R), and Hericium erinaceus (lion’s mane, LM).
Changes in the secondary structure of gluten (analysis of the amide I and amide III bands)
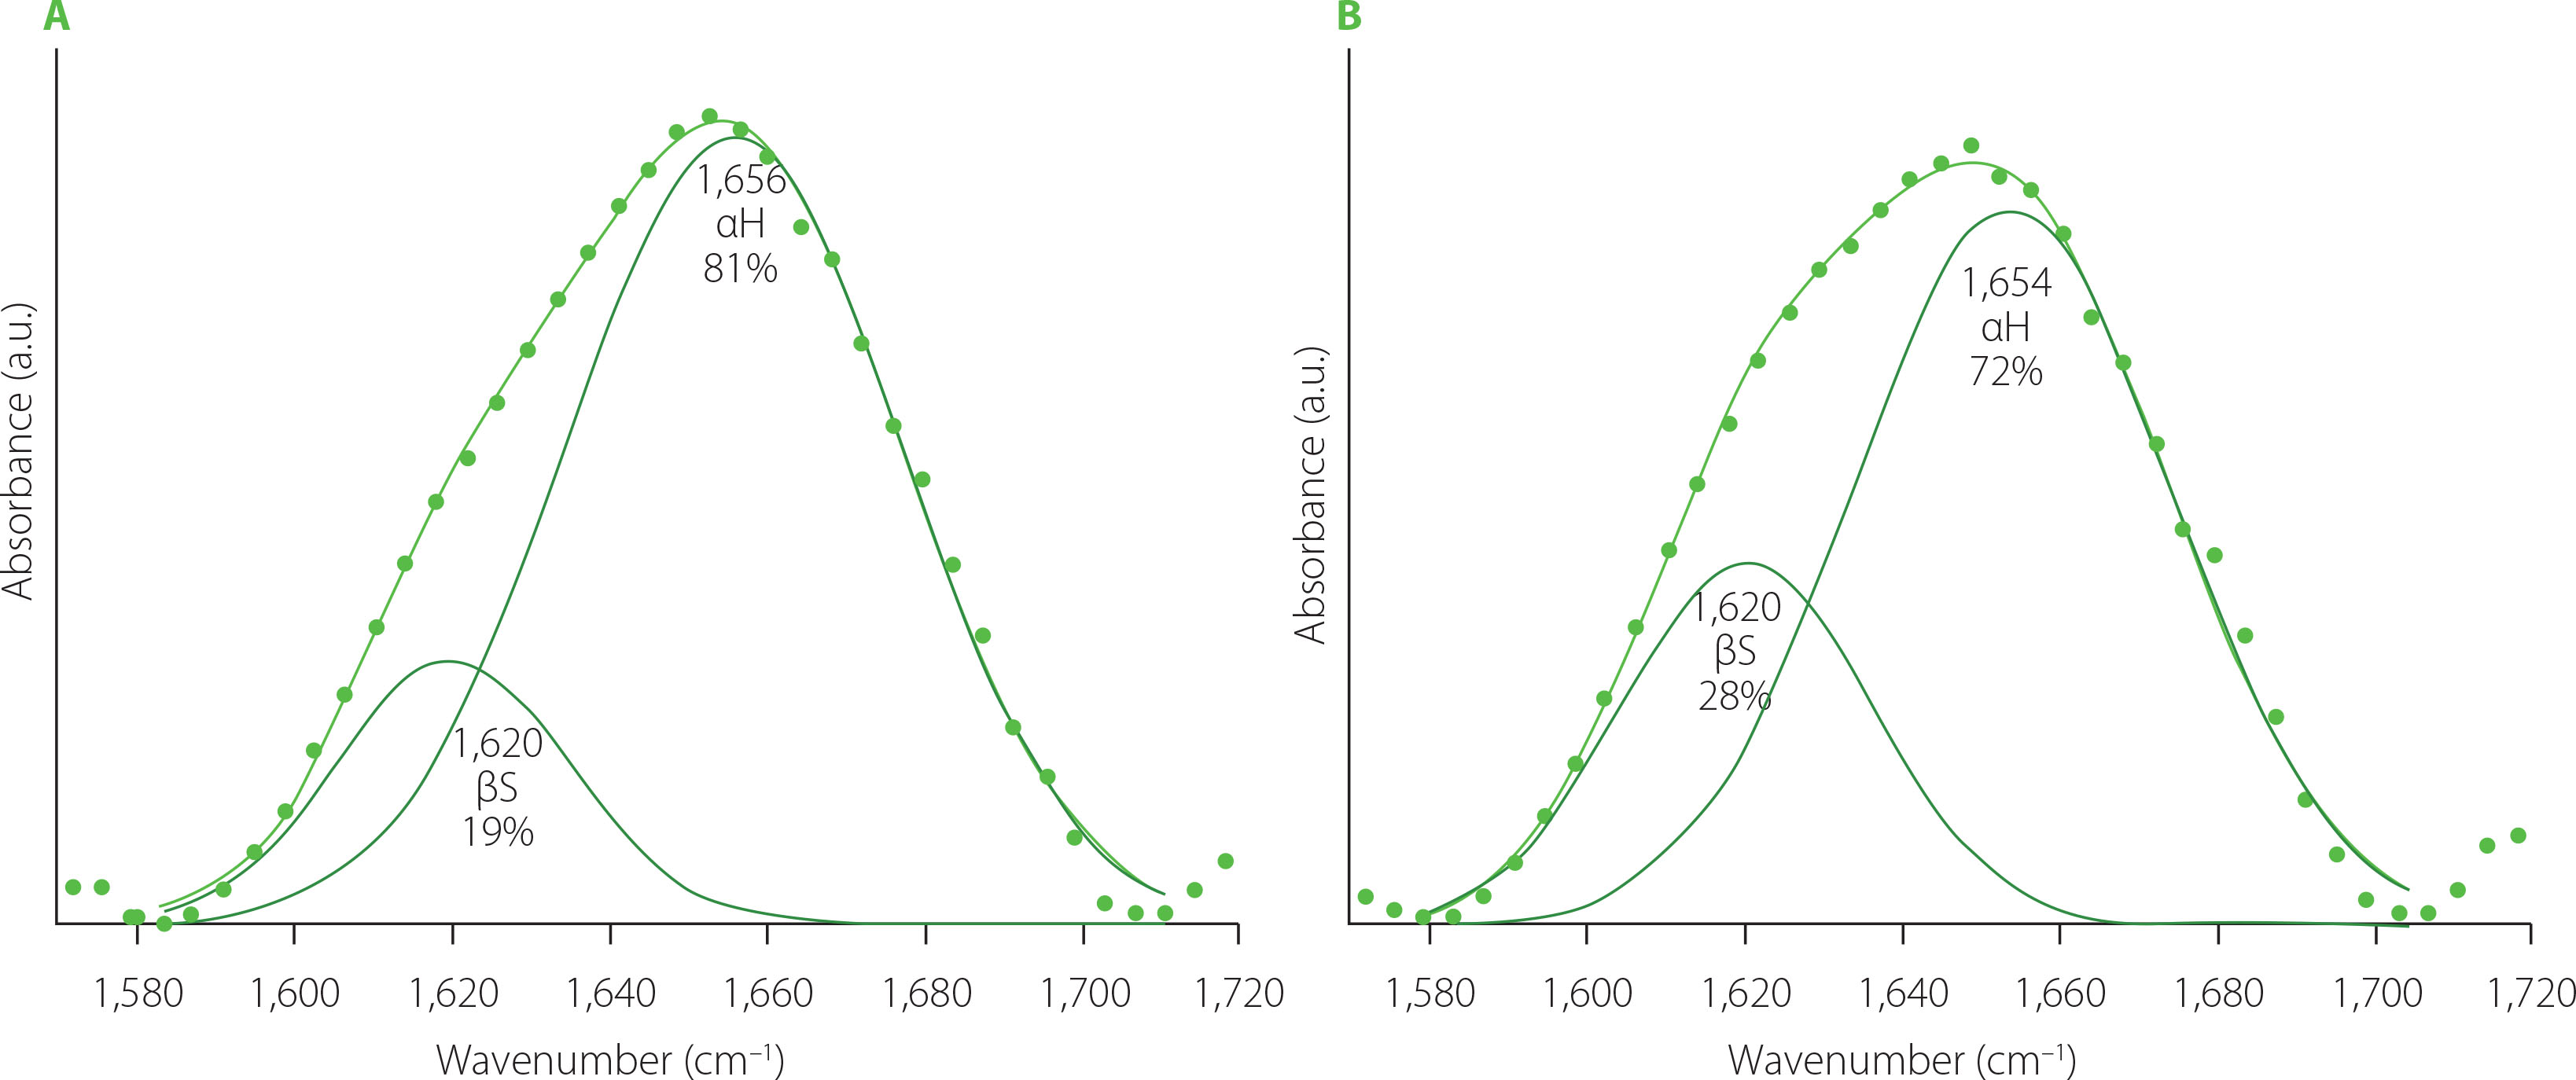
Deconvoluted amide I bands of FT-IR spectra determined for both control samples (wheat flour (WF) dough and durum semolina (DS) dough) are shown in Figure 1. Gluten from semolina dough contained more β-sheets and less α-helices compared with the gluten from wheat dough. Both samples did not contain β-turns and random coils. A study by Nawrocka et al. [2023] concerning the secondary structure of gluten washed out from wheat bread dough showed that dough contained a small amount of β-turns in addition to β-sheets and α-helices. However, analysis of gluten extracted from wheat wholemeal demonstrated the presence of secondary structures similar to gluten washed out from wheat bread dough, but contents of these structures differed significantly [Nawrocka, 2014]. Studies of Both et al. [2019], Nawrocka [2014], and Nawrocka et al. [2023] indicated that gluten secondary structure may vary depending on the type of material gluten was extracted from.
Figure 1
Deconvoluted amide I band of Fourier transform infrared spectra of the gluten network present in the wheat dough (A) and semolina dough (B). αH, α-helix; βS, β-sheet.
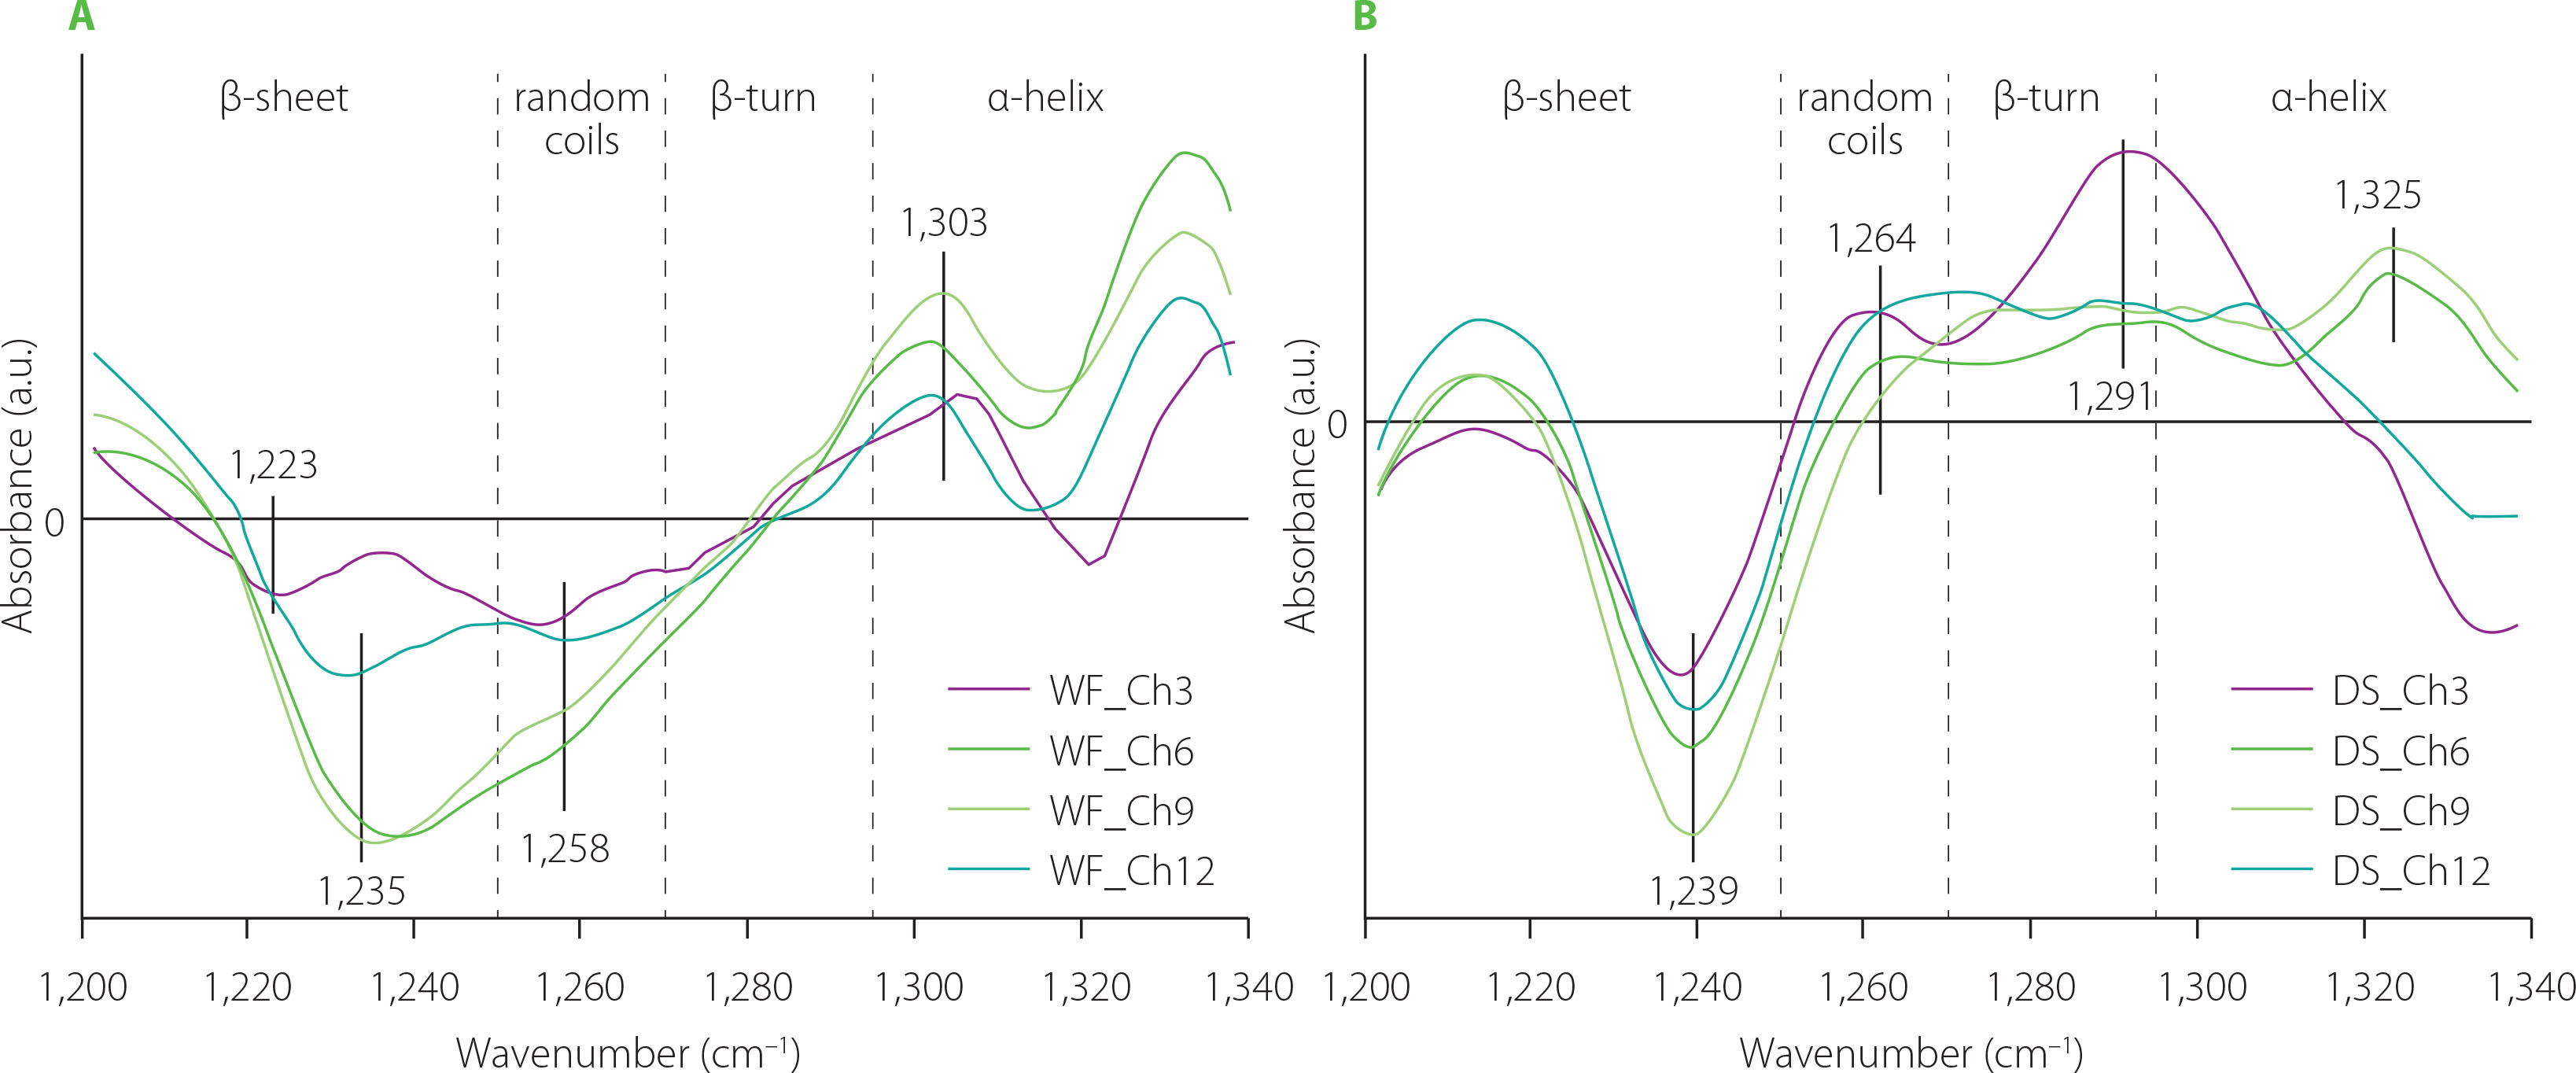
Difference spectra in the amide III bands ascribed to changes in the secondary structure of the gluten network obtained from wheat (WF) and semolina (DS) doughs modified with chaga powder are shown in Figure 2. The difference spectra in the amide I band were not calculated for doughs modified with this mushroom because subtraction of the deuterium oxide spectrum caused the amide I band to disappear from the FT-IR spectra of the chaga-enriched samples. Analysis of the amide III bands showed that chaga induced a decrease in the β-sheet content in both WF and DS observed as the negative band at ca. 1,235 cm−1. According to Nawrocka et al. [2018a], this band can be assigned to β-sheets connected by intermolecular H bonds, which are formed between gluten polypeptide chains and are indicative of aggregation. These bonds are regarded as those responsible for the formation of a gluten network during dough mixing. The decrease in the content of β-sheets linked by intermolecular H bonds can be due to the inability to extract gluten from dough samples and a lack of the amide I band in the FT-IR spectrum after deuterium oxide spectrum subtraction. However, a negative band located at ca. 1,235 cm−1 was also observed in our previous study [Nawrocka et al., 2020], investigating the effect of non-moisturized dietary fibre preparations on the gluten network in the model dough. The disappearance of these β-sheet structures was due to the dehydration of the gluten network by the dietary fibre preparations and aggregation of the gluten polypeptide chains. In the case of chaga-enriched dough, the gluten network dehydration could play a lesser role because of the inability of the gluten extraction from the WF and DS doughs, despite the high dietary fibre content (ca. 68%) of the chaga mushroom [Lu et al., 2021]. Moreover, the spectra of the WF-chaga samples showed negative and positive bands assigned to random coils and α-helices, respectively (Figure 2A). In the case of DS dough, the difference spectra contained three positive bands assigned to random coils, β-turns and α-helices (Figure 2B). The level of WF substitution with chaga powder in the dough production had a slight effect on the spectral regions assigned to random coils and α-helices. Noticeable changes were observed in the β-sheet spectral region (Figure 2A). In the case of 3% (w/w) substitution with chaga powder, a negative band was located at ca. 1,223 cm−1. According to Nawrocka et al. [2018a], this band can be connected with type II of H bonds that may be formed between gluten polypeptide chains and fibre polysaccharides present in the mushroom powder. The higher content of chaga powder in wheat dough caused the shift of the above-mentioned band to ca. 1,235 cm−1. This band can be assigned to type I of H bonds [Nawrocka et al., 2018a]. The appearance of this negative band at higher levels of WF substitution with chaga powder may suggest that a certain amount of type I of the H bonds was not formed between gluten polypeptide chains in the presence of mushroom polysaccharides. Hence, the mechanical properties of the gluten network developed were modified. This change can be observed as a reduction in the quality parameters of the dough and bread [Łysakowskaw et al., 2025a]. The negative band at ca. 1,235 cm−1 was also observed in the dough samples modified with reishi and lion’s mane powders, which is discussed below. In the case of DS samples, the level of semolina substitution with chaga powder affected slightly the gluten secondary structure (Figure 2B). This effect was observed as an increase and a decrease in the intensity of the positive and negative peaks assigned mainly to α-helices and β-sheets. The present study results indicate that particular compounds of the chaga powder interacted less with the gluten network in the DS dough compared with WF dough, which may be due to a different particle size of WF and DS (Table 1), since the DS particles were twice as large as those of WF.
Figure 2
Fourier transform infrared difference spectra in the amide III band of the doughs from wheat flour (WF) (A) and durum semolina (DS) (B) substituted with 3–12% (w/w) chaga mushroom powder (Ch3–Ch12, respectively).
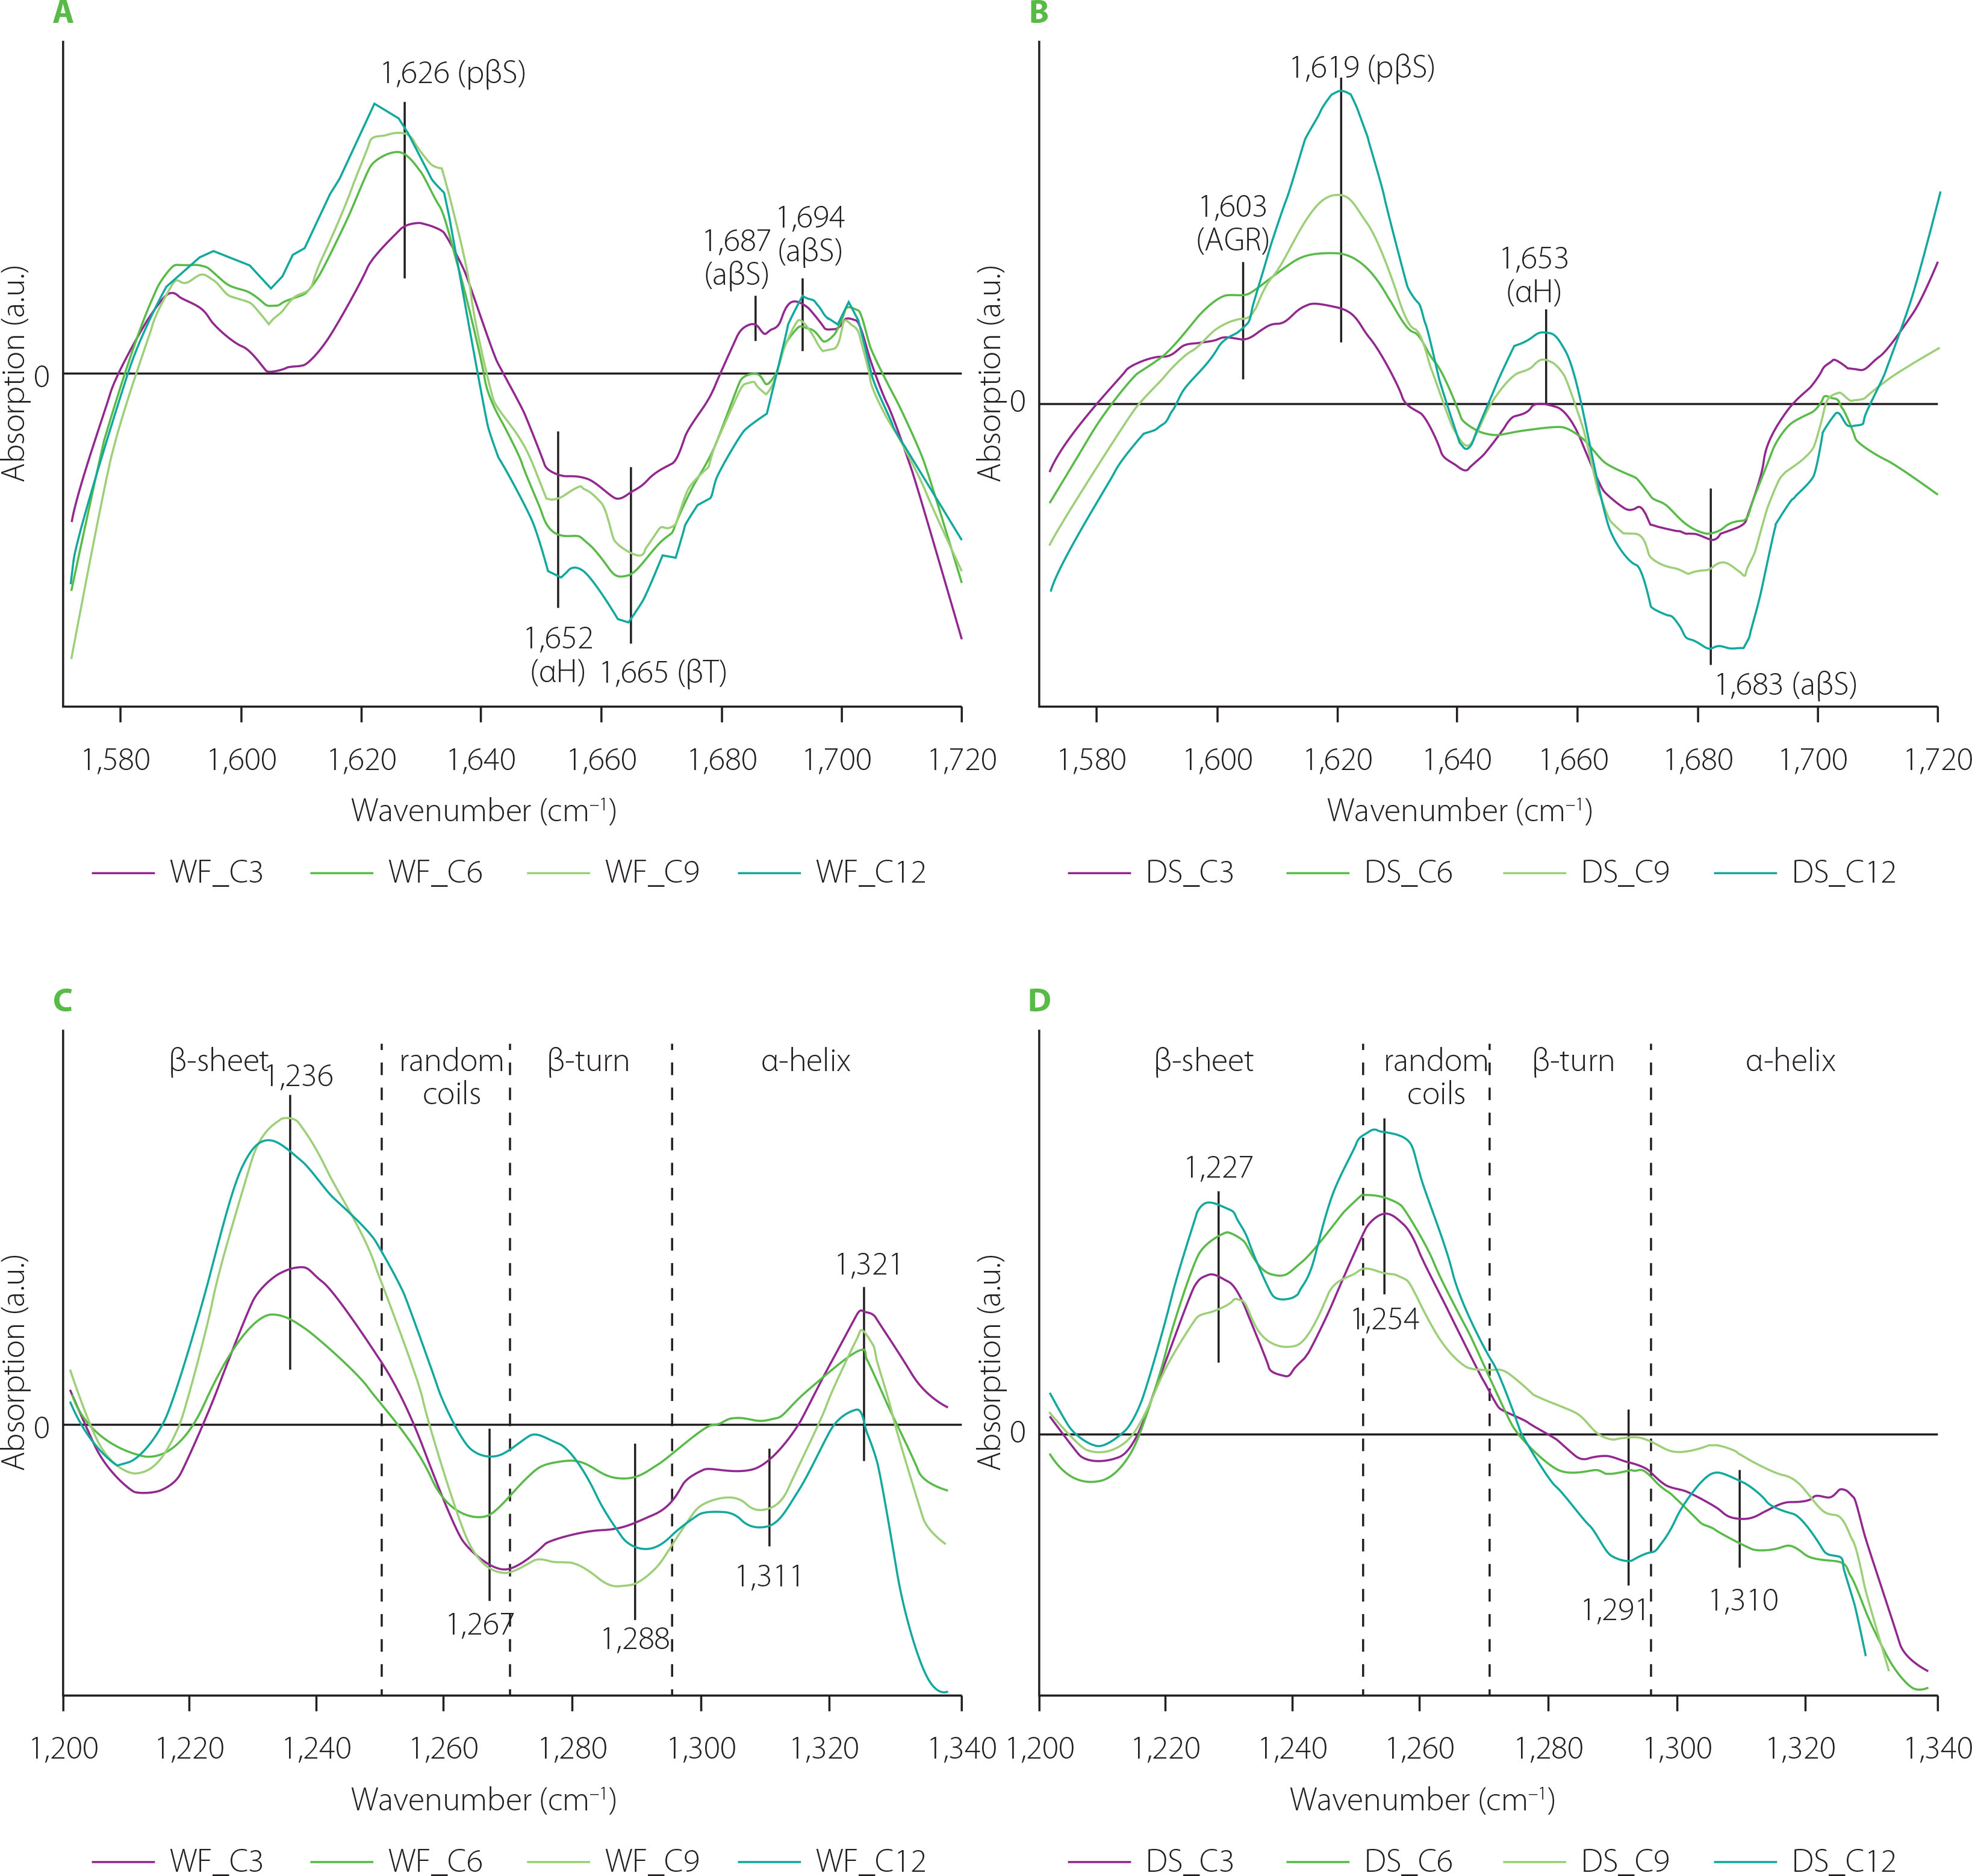
Effects of C. sinensis mushroom on the gluten network in the WF and DS doughs are presented in Figure 3. Analysis of the difference spectra in the amide I and amide III bands showed that C. sinensis incorporation led to an increase in the content of β-sheets with intermolecular hydrogen bonds. The band assigned to such structures was observed at ca. 1,619–1,625 cm−1 (pseudo-β-sheets) in the amide I band, whereas the amide III band contained a band at ca. 1,227–1,236 cm−1. Additionally, a decrease was observed in the content of β-turns and α-helices. The decrease in the content of β-turns may suggest that particular compounds of the C. sinensis powder may interact with amino acids present in the β-turns because β-turns are usually located at the edge of the protein complex. Moreover, β-turns can also participate in the formation of pseudo-β-sheets [Nawrocka et al., 2015]. Positive bands assigned to pseudo-β-sheets in the amide I band and β-sheets with intermolecular H bonds in the amide III bands were observed simultaneously as a result of wheat dough supplementation with paprika, pitted pepper and tomato pomace [Nawrocka et al., 2023]. The pomace contained on average 25% protein and 50% dietary fibre. Similar protein and dietary fibre contents were determined for C. sinensis mushroom (33% and 48%, respectively) [Łysakowska et al., 2025b]. The difference spectra showed that the contents of α-helices and β-turns decreased considerably (negative bands) in both types of doughs (Figure 3C and D). In turn, the content of random coils increased in the DS samples (positive bands) and decreased in the WF samples (negative bands). However, the maximum of the band assigned to random coils in the DS doughs was located closely to the edge of the β-sheet spectral region (at ca. 1,254 cm−1). Additionally, the FT-IR spectra were registered with resolution of 4 cm−1. For these reasons, this band may be partially related to β-sheet structures. The amount of the C. sinensis powder slightly affected the gluten secondary structure. The only structures in which noticeable changes were observed, such as an increase in the intensity of the band characteristic for this structure, were pseudo-β-sheets with a band at ca. 1,619 cm−1 for DS doughs (Figure 3B) and β-sheets with type I of H bonds with a band at ca. 1,236 cm−1 (Figure 3C). The presence of these bands may indicate that the compounds of the mushroom powder (e.g., polysaccharides, phenolic compounds) did not interact chemically with the gluten network. On the other hand, their presence induced the formation of additional hydrogen bonds between the polypeptide chains of gluten proteins during dough mixing.
Figure 3
Fourier transform infrared difference spectra in the amide I band (A and B), and amide III band (C and D) of the doughs from wheat flour (WF) and durum semolina (DS) substituted with 3–12% (w/w) Cordyceps sinensis powder (C3–C12, respectively). AGR, aggregates; pβS, pseudo-β-sheets; αH, α-helices; βT, β-turns; aβS, antiparallel-β-sheets.
The difference spectra concerning changes in the gluten structure in the doughs as a result of partial substitution of WF and DS with reishi mushroom powder are depicted in Figure 4. They showed that compounds of the reishi powder interacted differently with WF and DS. In the case of the WF gluten network, positive bands assigned to pseudo-β-sheets and α-helices were observed simultaneously with negative bands connected with β-turns and antiparallel-β-sheets in the amide I band. Analysis of the amide III band showed disappearance of β-sheets with intermolecular H bonds (1,234 cm−1) and an increase in the content of α-helices (1,309 cm−1). The decrease in the content of β-structures can be due to a reduction in gluten elasticity and, consequently, a decrease in the bread loaf volume [Łysakowska et al., 2024]. The presence of the reishi powder, and especially a high content of its total dietary fibre, strengthen the gluten network, while simultaneously diminishing the retention of air bubbles by the gluten network. The DS gluten network was modified differently by the reishi mushroom powder than the WF gluten network (Figure 4A-D). Amide I band showed one positive band at 1,607 cm−1 that can be assigned to aggregates and/or hydrated/extended β-sheets [Feeney et al., 2003]. The negative bands located at 1,636; 1,673 and 1,686 cm−1 may be ascribed to β-sheets, β-turns and antiparallel-β-sheets, respectively [Secundo & Guerrieri, 2005]. The amount of the reishi powder added to the dough had a small effect on the gluten secondary structure. The band shape and peak locations in both amide bands of the gluten modified with reishi (samples WF and DS) were similar to those modified by chaga. The similar structural changes can be related to the similar content of dietary fibre in both mushrooms, which was high and approximated 70%. Simultaneously, both mushrooms differed significantly in their protein and fat contents [Lu et al., 2021; Łysakowska et al., 2024]. According to Rumińska et al. [2020], a similar content of dietary fibre (ca. 70%) was determined in oil pomace obtained from hemp and milk thistle seeds. Similar changes in the secondary structure were observed only in the case of gluten modified by milk thistle. The observed differences in the secondary structure can be due to the high amount of unsaturated fatty acids in the hemp pomace compared to milk thistle pomace.
Figure 4
Fourier transform infrared difference spectra in the amide I band (A and B), and amide III band (C and D) of the doughs from wheat flour (WF) and durum semolina (DS) substituted with 3–12% (w/w) reishi powder (R3–R12, respectively). AGR, aggregates; pβS, pseudo-β-sheets; βS, parallel-β-sheets; αH, α-helices; βT, β-turns; aβS, antiparallel-β-sheets.
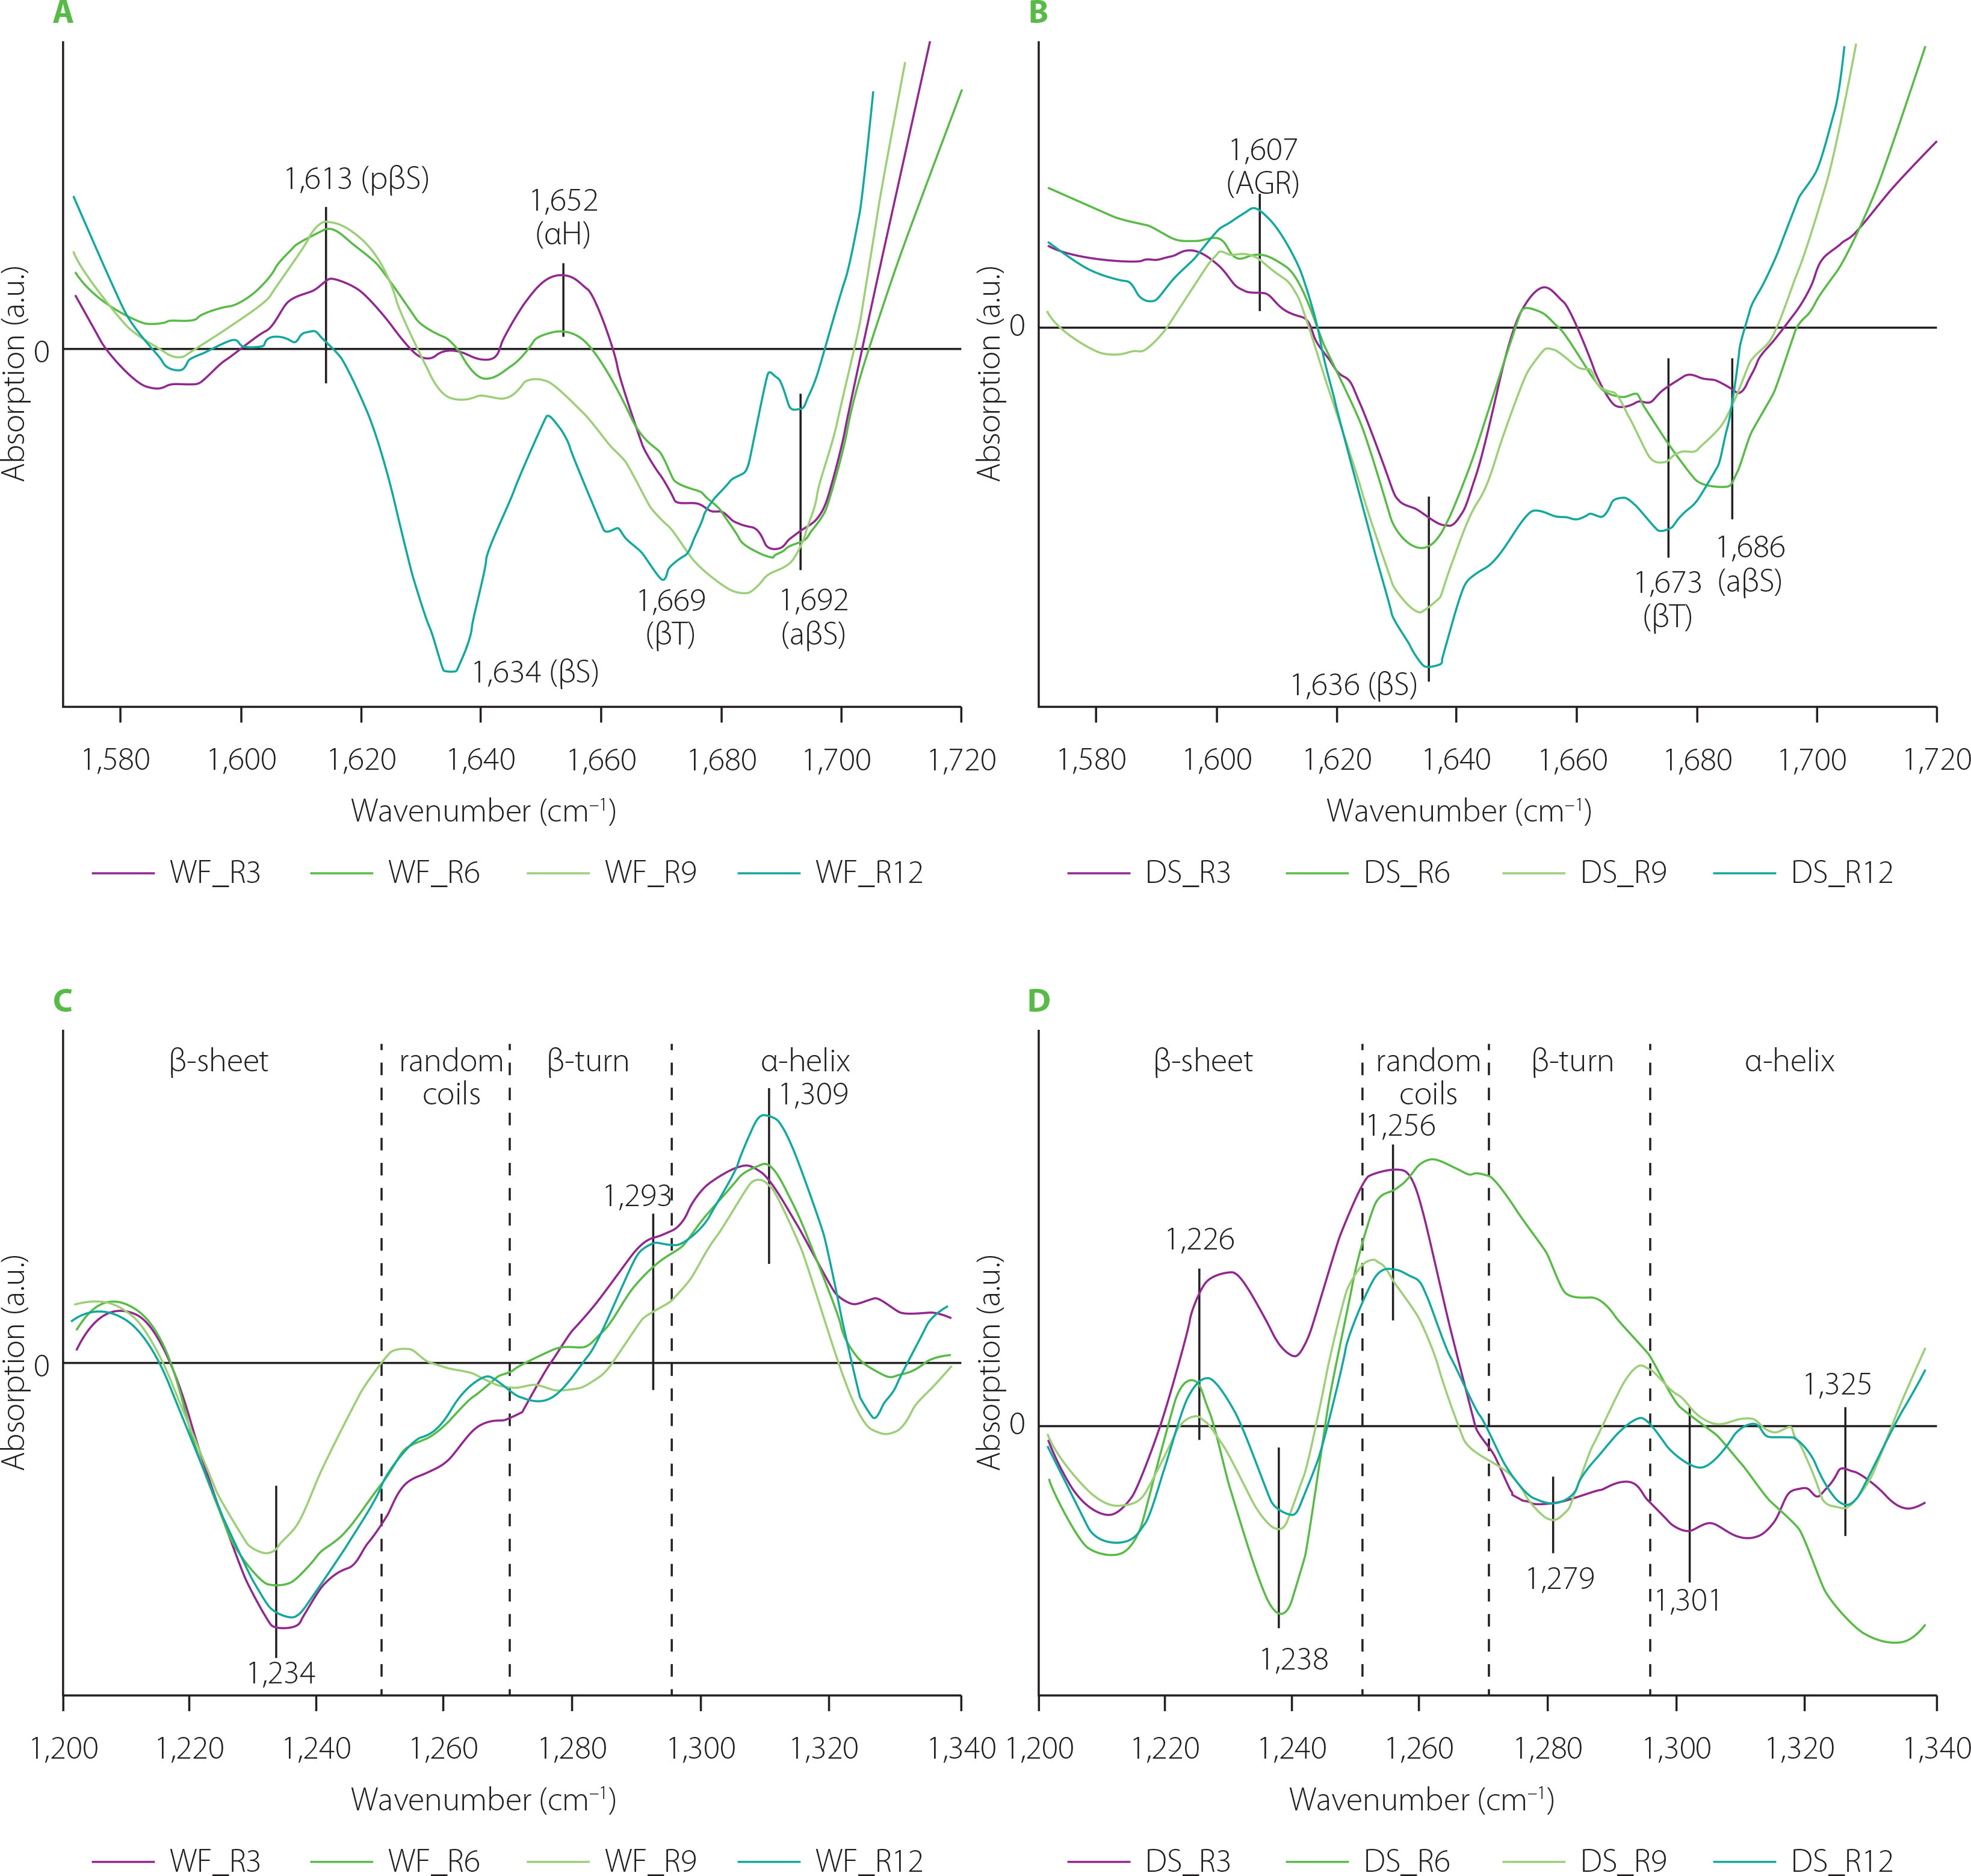
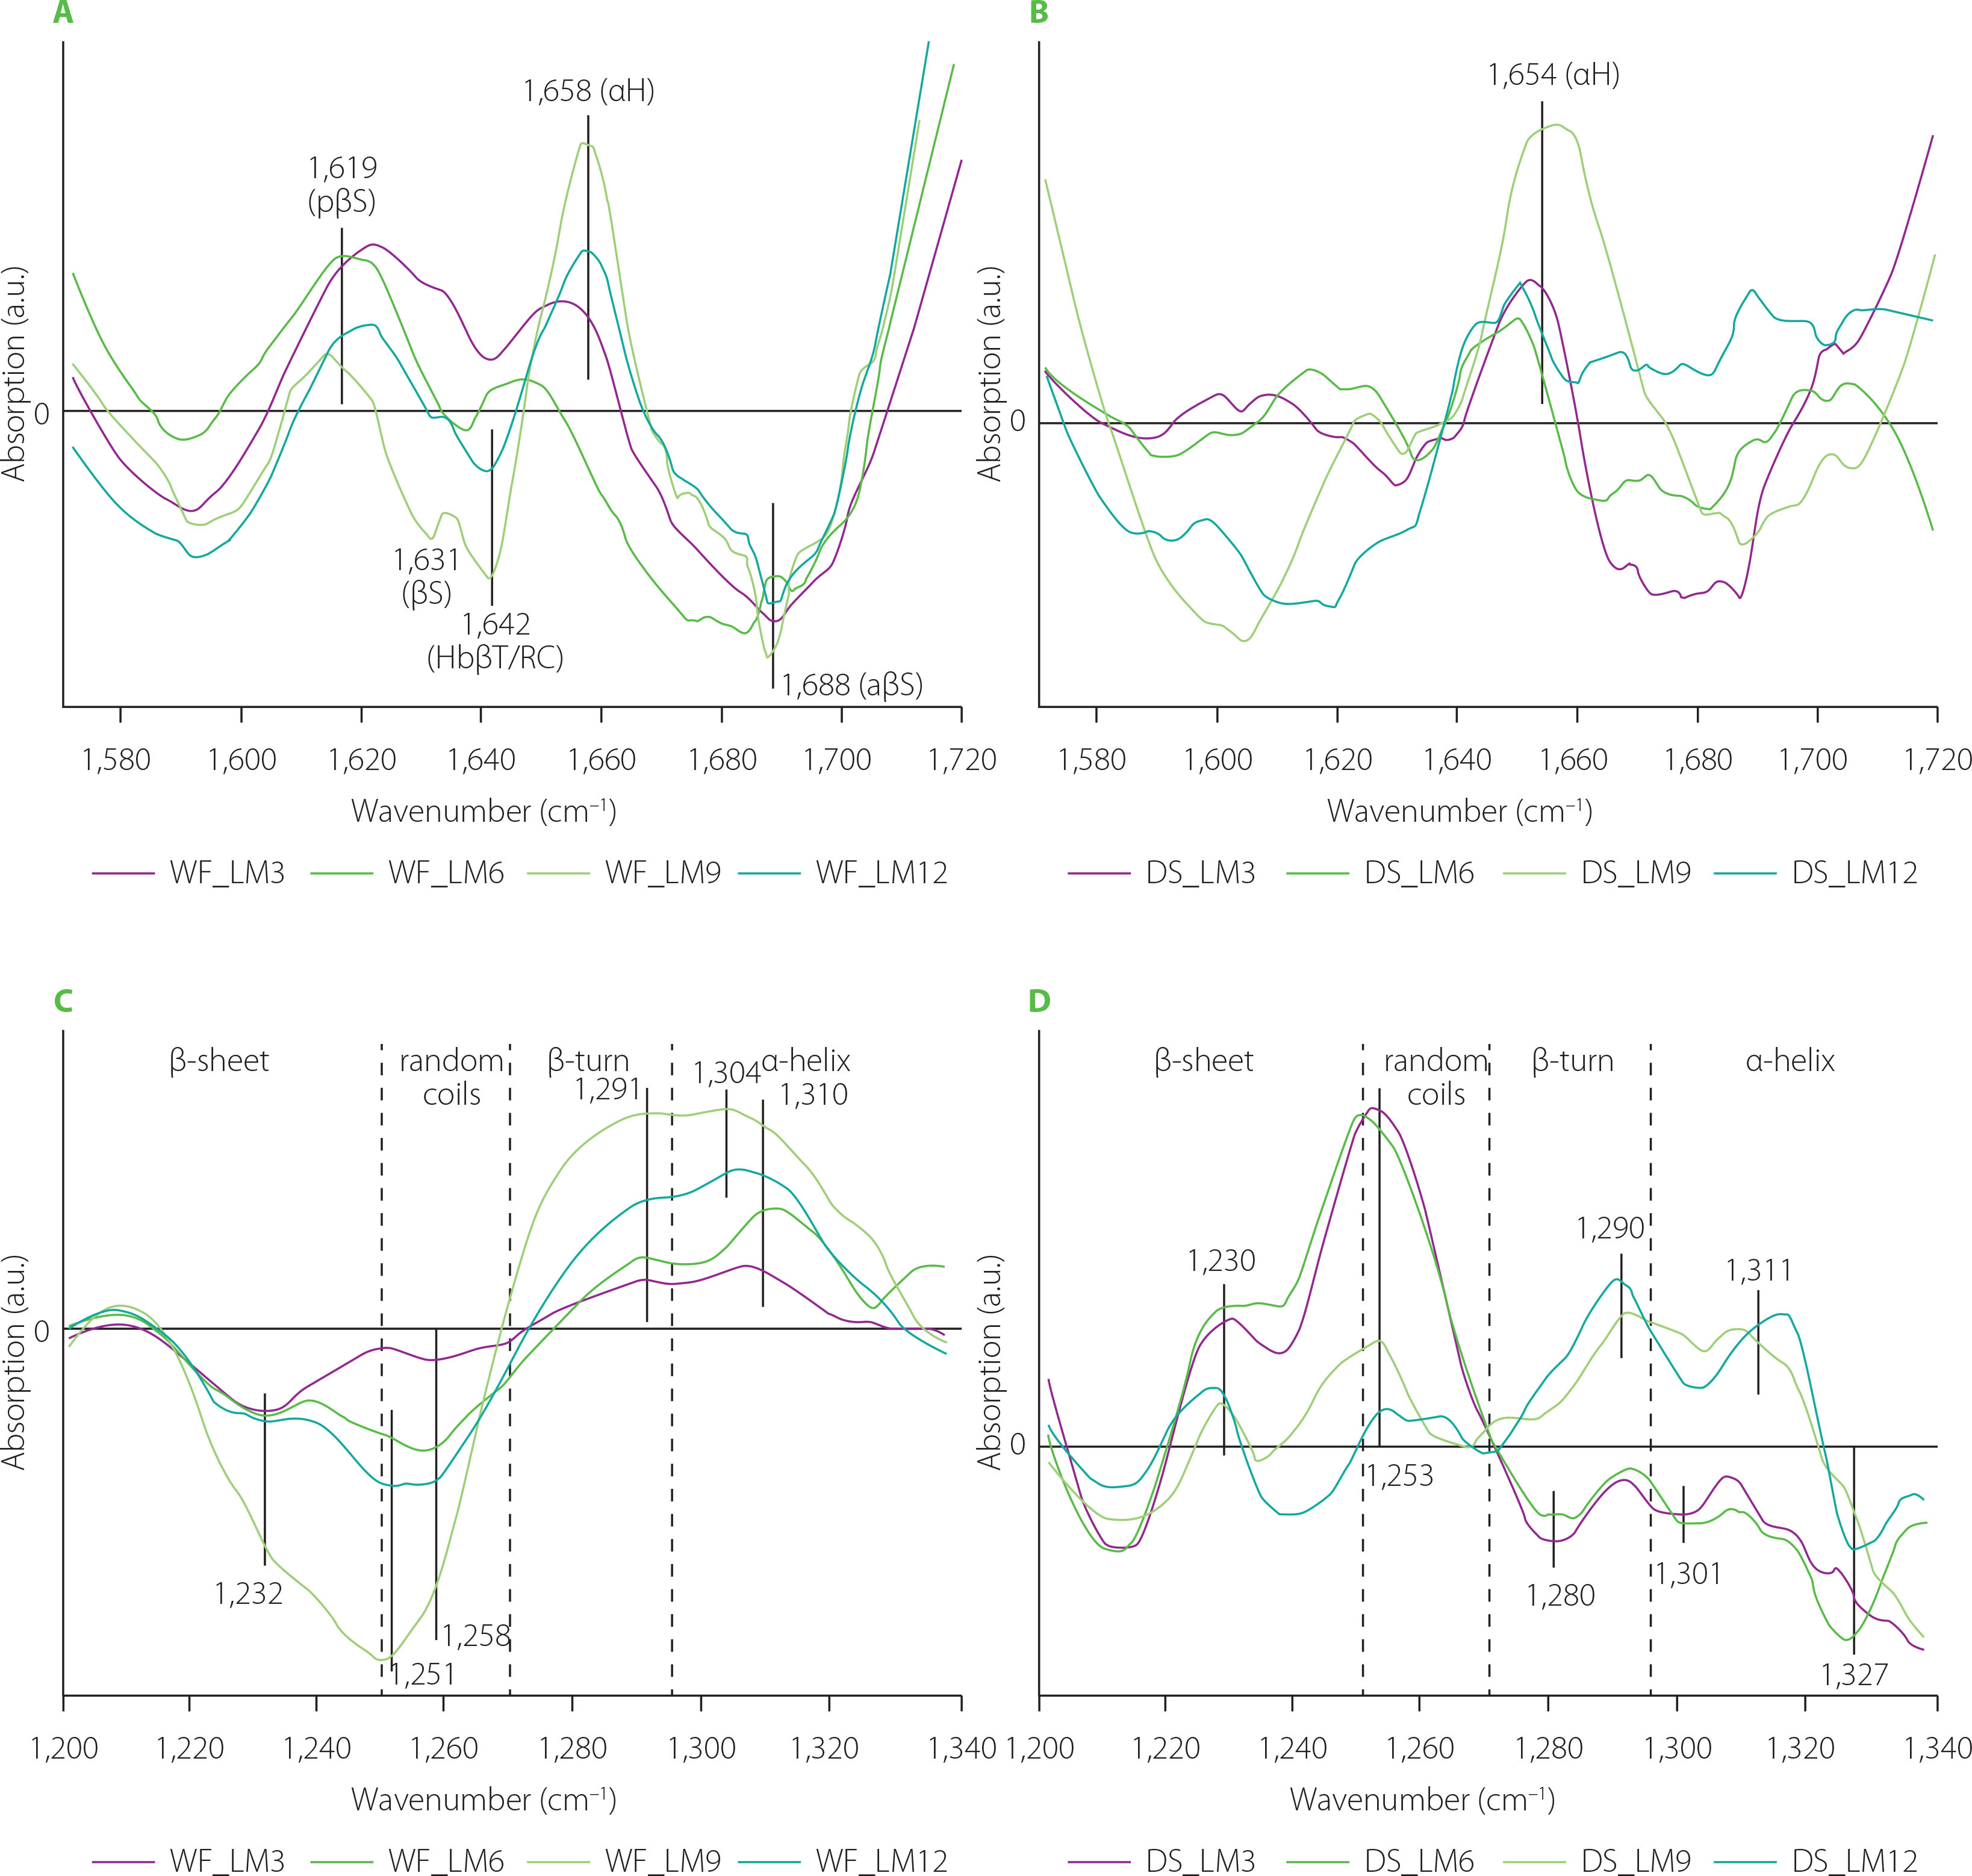
Figure 5 depicts difference spectra concerning structural changes in the gluten structure caused by addition of lion’s mane mushroom powder to the WF and DS doughs. In the WF samples, substitution of WF with the lion’s mane powder induced the appearance of pseudo-β-sheet (ca. 1,619 cm−1) and α-helices (ca. 1,658 cm−1) with the simultaneous disappearance of antiparallel-β-sheets (ca. 1,688 cm−1). Additionally, two negative bands at 1,631 and 1,642 cm−1 were observed for gluten modified with the lion’s mane powder at two highest substitution levels. These bands can be assigned to β-sheets and H-bonded β-turns or/and random coils [Secundo & Guerrieri, 2005]. The spectra of DS doughs showed one positive band connected with α-helices. The other parts of difference spectra, assigned to β-structures, were negative. Analysis of the amide III band showed an increase in the contents of β-turns and α-helices at the expense of β-sheets and random coils in the WF samples. The use of the lion’s mane powder in a dough recipe exerted a different effect on the gluten structure in the DS samples. Doughs obtained by DS substitution with 3% and 6% (w/w) of lion’s mane powder were characterized by positive bands in the spectral regions assigned to β-sheets and random coils. In turn, the highest content of lion’s mane powder induced an increase in the content of β-turns and α-helices and a considerable decrease in the contents of β-sheet and random coils. Decreasing the number of β-sheets and β-turns can cause a decrease in the elasticity of the gluten network and, consequently, hinder proper growth and gas retention during dough fermentation. This can be visible as a decrease in the technological parameters describing wheat bread quality, such as specific bread volume, porosity, or crust hardness. A decrease in the specific bread volume and crust hardness has been observed by Łysakowska et al. [2025a], who studied the effect of WF substitution with lion’s mane powder in the amounts of 3%–12% (w/w) on bread dough and bread quality. Similar results in terms of specific bread volume have been determined for bread with 5% (w/w) of lion’s mane powder in its recipe. However, none of the textural parameters of bread (hardness, springiness, cohesiveness, gumminess, chewiness, resilience) changed upon the lion’s mane addition [Ulziijargal et al., 2013]. Additionally, the structural changes observed in the present study can be related to the chemical composition of the mushrooms’ powder. Lion’s mane and C. sinensis powders share a similar chemical composition in terms of fibre and protein contents [Łysakowska et al., 2025a, b]. Hence, they should trigger similar structural changes, as it was observed in the case of reishi- and chaga-enriched doughs. However, similar changes in the gluten secondary structure were observed only in the amide III band of the DS spectra (Figures 3D and 5D). The addition of C. sinensis and lion’s mane to dough formula caused the formation of β-sheets with hydrogen bonds of type II (positive band at ca. 1,235 cm−1). According to Nawrocka et al. [2018a], H bonds of this type can be formed between gluten polypeptide chains and fibre polysaccharides and/or polypeptide chains of proteins present in the mushrooms powders. In the case of chaga and reishi, the spectral region assigned to β-sheets (1,200–1,250 cm−1) included a negative band at ca. 1,238 cm−1. The band at 1,238 cm−1 can be connected with hydrogen bonds of type I, which are formed between gluten polypeptide chains in the dough [Nawrocka et al., 2018a]. Moreover, a significant increase in the intensity of band assigned to random coils (1,250–1,270 cm−1) was observed for doughs enriched with C. sinensis, reishi and lion’s mane (Figures 3D, 4D, 5D). These analyses suggest that the structural changes observed in the β-sheet spectral region can be due to the presence of dietary fibre and proteins in the mushroom powders. In turn, the changes in the random coil region may be attributed to a high content of proteins in the studied powders. Reishi and lion’s mane contain ca. 15% protein, while the fibre content is ca. 70% for chaga and reishi, and ca. 50% for C. sinensis and lion’s mane [Lu et al., 2021; Łysakowska et al., 2024; 2025a]. Generally, analysis of the difference spectra showed that the changes observed in the secondary structure of the gluten depended on the type of the material used for dough preparation, i.e., wheat flour or durum semolina, as well as species of medicinal mushroom and its chemical composition. The difference spectra in the amide I band for WF samples had a positive band assigned to pseudo-β-sheets, whereas DS spectra contained positive bands connected with aggregates or α-helices. In the case of amide III band, WF spectra showed negative bands in the spectral regions connected with β-sheets and random coils, and positive bands in the regions of β-turns and α-helices. DS spectra showed opposite orientation of these spectral regions. The structural differences observed between WF and DS can be due to their physicochemical parameters, such as gluten index and particle size (Table 1). Finding a correlation between the chemical composition of the tested mushrooms and the structural changes observed in gluten is, however, very difficult because both the dough and the mushroom powder are complex matrices. Therefore, determining the mechanism of interaction between two such matrices is very difficult. However, previous studies addressing the rheological properties of dough and the technological properties of bread showed a significant reduction in the quality of dough, bread and pasta as a result of mushroom addition. In the case of bread dough, it was observed an increase in water absorption and dough stability and a decrease in the dough softening and dough extensibility. These farinographic changes were observed in the wheat bread as a decrease in the crumb porosity, loaf volume and springiness [Lu et al., 2018; Łysakowska et al., 2024; 2025a; Ulziijargal et al., 2013]. In turn, pasta enriched with edible mushroom powders showed an increase in the cooking loss and a decrease in the water absorption index [Lu et al., 2016]. The increase in the cooking loss of the pasta can be attributed to a loss of the gluten network continuity that may be related to the competition for water between mushroom powder rich in dietary fibre and gluten network [Tudorica et al., 2002].
Figure 5
Fourier transform infrared difference spectra in the amide I band (A and B), and amide III band (C and D) of the doughs from wheat flour (WF) and durum semolina (DS) substituted with 3–12% (w/w) lion’s mane powder (LM3–LM12, respectively). pβS, pseudo-β-sheets; βS, parallel-β-sheets; HbβT, hydrogen bonded β-turns; RC, random coils; αH, α-helices; aβS, antiparallel-β-sheets.
Changes in OH stretching region (water populations)
The gluten network in dough may contain water in different forms, such as water molecules linked to the gluten network by strong and weak hydrogen bonds, small hydrogen bonded water clusters, water molecules participating in hydrogen bonds through two hydrogen atoms from one molecule, and unbound water molecules (“free water”). Changes in the particular water forms can be determined by analyzing OH stretching region in the FT-IR spectrum (2,500–4,000 cm−1) [Bock & Damodaran, 2013].
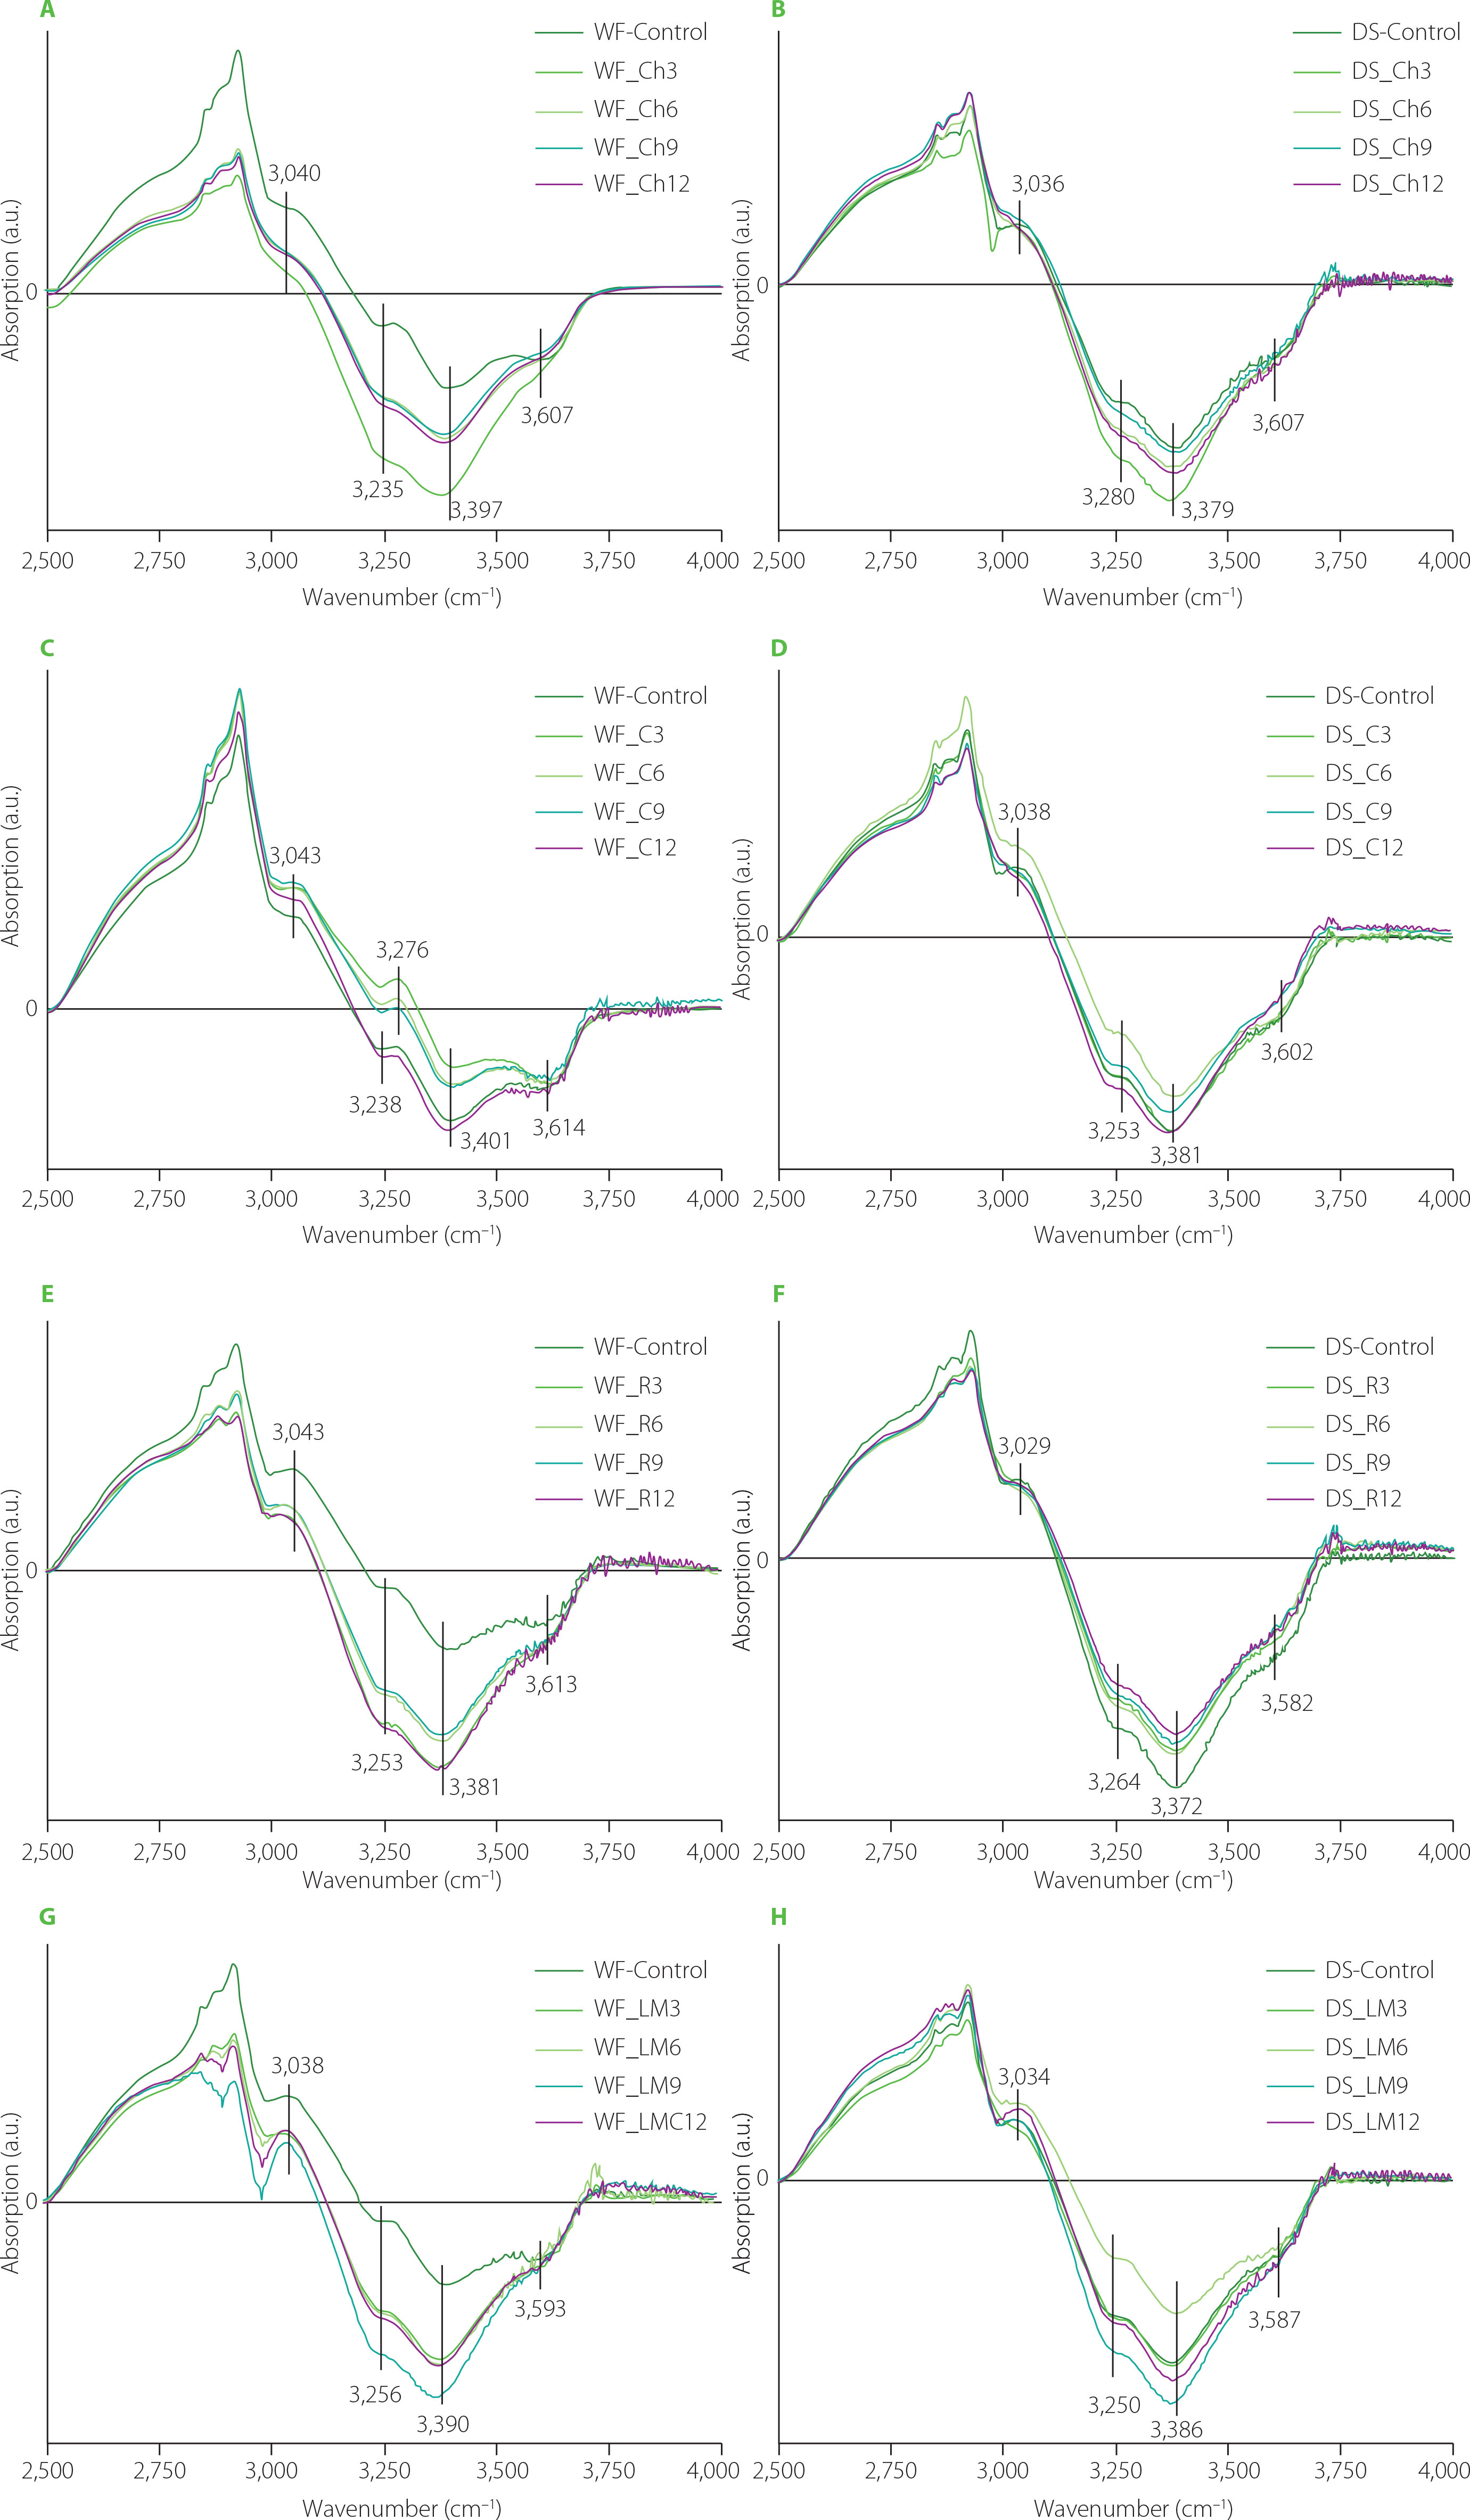
Spectra concerning changes in the water populations in dough caused by the addition of the medicinal mushroom powders to dough formula are depicted in Figure 6. Almost all spectra showed one positive band at ca. 3,040 cm−1 assigned to strong hydrogen bonds formed between gluten network and water molecules [Bock & Damodaran, 2013]. Additionally, three negative bands were observed at ca. 3,250; 3,390; and 3,600 cm−1 which can be assigned to water molecules involved in the formation of two hydrogen bonds [Cotugno et al., 2001], small hydrogen bonded water clusters [Bock & Damodaran, 2013], and free water molecules [Cotugno et al., 2001]. Only in the case of WF_C3 and WF_C6 samples (Figure 6C) was a positive band observed at ca. 3,276 cm−1. This band can be ascribed to hydrogen-bonded-associated chains of water molecules in bulk water [Jain et al., 1989]. Analysis of the spectra indicated that WF and DS substitution with the mushroom powders did not affect or slightly affected water populations in the dough samples, presumably due to the fact that powders had high contents of proteins, fats, phenolics etc., which also might have interacted with the gluten network. Hence, the observed structural changes in the gluten network may be partially related to the competition for water between gluten and mushroom dietary fibre. Similarly to the present study, research into the effect of oil pomace on the gluten structure in the bread dough showed slight changes in the water populations [Rumińska et al., 2020]. On the contrary, great changes in water populations were observed after the use of dietary fibre preparations as additives to bread wheat dough [Nawrocka et al., 2017; 2020] or fibre polysaccharides [Nawrocka et al., 2018b]. The differences in the water populations observed between the present study and studies concerning dietary fibre preparations can be related to the chemical composition of the additives used. For example, dietary fibre preparations, which differ in the ratio of insoluble dietary fibre (IDF) and soluble dietary fibre (SDF), may trigger changes in the intensity of the bands assigned to particular water populations. Such differences were observed for model bread dough modified with chokeberry and flax dietary fibre preparations (IDF/SDF ≅ 14 and 2 for chokeberry and flax, respectively) [Nawrocka et al., 2015; 2017]. Similar differences in the intensity of the bands assigned to water populations were observed upon model dough enrichment with four fibre polysaccharides (microcrystalline cellulose, inulin, apple, and citrus pectin), which differed in their water holding capacity [Nawrocka et al., 2018a, b]. Moreover, some additives may contain considerable amount of fat like oil pomace. In this case, analysis of the spectral region of water populations showed a slight effect of these additives on these populations [Rumińska et al., 2020].
Figure 6
Fourier transform infrared difference spectra in the OH stretching region of the doughs from wheat flour (WF) and durum semolina (DS) substituted with 3–12% (w/w) chaga (Ch3–Ch12) (A–B), Cordyceps sinensis (C3–C12) (C–D), reishi (R3–R12) (E–F), and lion’s mane (LM3–LM12) (G–H) powders. WF-Control and DS-Control, wheat flour and durum semolina doughs unmodified with lion’s mane mushroom powder.
CONCLUSIONS
Fourier transform infrared spectroscopy was deployed to determine structural changes in the gluten network induced by powders from four medicinal mushroom. Additionally, the changes were studied in two types of doughs prepared from wheat flour and durum semolina. Analysis of the FT-IR spectra showed that the type of the observed structural changes depended on material type used to prepare the dough as well as species of medicinal mushroom and its chemical composition. As a result of mushroom powder addition, the formation of additional pseudo-β-sheets (aggregated structures) was observed in wheat flour doughs, whereas aggregates and additional α-helices were formed in the durum semolina doughs. The structural differences observed between dough materials can be related to the gluten index and particle size. Amounts of particular water populations did not change or changed slightly in the presence of medicinal mushroom powders, presumably due to the complex chemical composition of the powders, which contain not only large amounts of dietary fibre but also protein, fat, phenolics, minerals, etc. Analysis of the phenolic profile showed that the mushroom powders contained antioxidants, known from their positive effects on the human organism, such as syringic acid, sinapic acid, genistein, and daidzein. The compounds other than dietary fibre also interact with a gluten network during dough mixing. Hence, the structural changes observed in the gluten network may be partially related to the competition for water between gluten and mushroom dietary fibre.