ABBREVIATIONS
ABCG2, ATP-binding cassette subfamily G member 2; ALT, alanine aminotransferase; AST, asp artate aminotransferase; Caspase-1, cysteinyl aspartate specific proteinase-1; EHPPL, enzymatically extracted pectin from Premna ligustroides Hemsl. leaves; GAPDH, glyceraldehyde 3-phosphate dehydrogenase; HE, hematoxylin-eosin; IL, interleukin; LPS, lipopolysaccharides; MCP-1, monocyte chemoattractant protein-1; MSU, monosodium urate; MyD88, myeloid differentiation primary response protein 88; NF-κB, nuclear factor-κB; NLRP3, NOD-like receptor thermal protein domain associated protein 3; PMSF, phenylmethanesulfonyl fluoride; PVDF, polyvinylidene-fluoride; SOP, standard operating procedures; TBST, tris-buffered saline with Tween 20; TLR, toll-like receptor; PDZK1, PDZ domain-containing protein 1; TNF-α, tumor necrosis factor-α; NSAIDs, nonsteroidal anti-inflammatory drugs.
INTRODUCTION
Dysregulation of purine metabolism or reduced uric acid excretion can lead to elevated blood uric acid levels, resulting in crystal-induced inflammatory joint diseases due to the deposition of monosodium urate (MSU) crystals [Dalbeth et al., 2021]. Symptoms include hyperuricemia, redness, swelling, fever in bones and joints, intermittent joint pain, gout, kidney stones, and joint deformities, all of which significantly affect patients’ daily lives [Perez-Ruiz et al., 2015]. The incidence of these conditions is rising, with a notably higher prevalence among younger individuals [Dehlin et al., 2020]. Gout is primarily caused by purine metabolism disorders and abnormal inflammatory pathways [Pascart & Lioté, 2019]. MSU crystals stimulate the release of inflammatory mediators, which induce and perpetuate inflammation [Roddy & Choi, 2014]. Research has demonstrated that even in the absence of gout, soluble uric acid can trigger inflammation in renal cells by activating NOD-like receptor thermal protein domain-associated protein 3 (NLRP3) inflammasomes [Kim et al., 2015]. Furthermore, soluble uric acid increases the expression of PDZ domain-containing protein 1 (PDZK1) and ATP-binding cassette subfamily G member 2 (ABCG2) in intestinal cells via the toll-like receptor (TLR) 4 and NLRP3 inflammasome signaling pathway [Chen et al., 2018]. TLR2 and TLR4 are critical in the production of interleukin (IL)-1β in response to MSU crystals [Guo et al., 2019]. High uric acid levels can also damage the intestinal mucosal barrier in mice, increasing intestinal permeability and enabling the translocation of intestinal bacteria, inflammatory cytokines, and lipopolysaccharides (LPS) into the bloodstream. LPS in the gut further elevates xanthine oxidase (XOD) activity, contributing to increased blood uric acid levels [Guo et al., 2021]. The TLR4/nuclear factor-κB (NF-κB) and NLRP3 signaling pathways, which involve key cytokines and inflammatory mediators such as TLR4, myeloid differentiation primary response protein 88 (MyD88), NLRP3, IL-1β, IL-6, and tumor necrosis factor-α (TNF-α), are crucial targets for the treatment of hyperuricemia and gout [Sun et al., 2024]. The NF-κB pathway is particularly implicated in the release of inflammatory cytokines like TNF-α, IL-6, and IL-1β in the context of gout.
During acute gout episodes, first-line treatments such as nonsteroidal anti-inflammatory drugs (NSAIDs), colchicine, glucocorticoids, and allopurinol may lead to adverse reactions [Dalbeth et al., 2021; Shi et al., 2020]. Diet plays a pivotal role in reducing systemic inflammation and influencing the progression of chronic diseases. Numerous studies suggest that certain food components or natural ingredients can alleviate arthritis, gout, and hyperuricemia [Huang et al., 2022; Li et al., 2021; Li et al., 2025]. Therefore, identifying effective compounds from edible sources for gout management is of significant importance. Premna ligustroides Hemsl., a shrub from the Verbenaceae family (genus Premna L.), also known as Premna microphylla Turcz. [Liu et al., 2021b], thrives in the mountainous regions of Sichuan, Chongqing, and Hubei, China. The P. ligustroides is known for its antioxidant potential due to content of phenolics, diterpenoids and alkaloids [Duan et al., 2022]. Leaves of P. ligustroides are also rich in pectin with the content of 35 g/100 g [Liu et al., 2021b]. Research by Song et al. [2021] revealed that polysaccharides derived from this plant reduce inflammation by enhancing intestinal resistance. P. ligustroides pectin can be effectively extracted with water after pectinase and cellulase treatment [Liu et al., 2023]. Such enzymatically hydrolyzed pectin from P. ligustroides leaves (EHPPL) showed potent anti-inflammatory properties [Deng et al., 2025].
The aim of this study was to examine the impact of EHPPL on ankle joint swelling in rats with MSU-induced acute gouty arthritis and understanding how EHPPL can alleviate gout symptoms. Study findings may provide valuable insights into improving uric acid crystal metabolism through dietary intervention.
MATERIALS AND METHODS
Materials
The leaves of P. ligustroides were purchased from Mianyang Changshan Agricultural Technology Co., Ltd. (Sichuan, China). Allopurinol tablets were obtained from Hefei Jiulian Pharmaceutical Co., Ltd. (Anhui, China). Sodium urate crystals were sourced from Shanghai Macklin Biochemical Co., Ltd. (Shanghai, China).
Twenty male specific pathogen-free (SPF) Sprague-Dawley (SD) rats, aged 5 weeks and weighing 200–220 g, were acquired from Hunan Slake Jingda Experimental Animal Co., Ltd. (Hunan, China) under License No.: SCXK (Xiang) 2019-0004. The animals were housed in the SPF-level barrier facility of the Experimental Animal Center of Pharmacy, Southwest University (Facility license No.: SYXK (Yu) 2020-0006), under controlled conditions: relative humidity of 53±2%, temperature of 23±1°C, and a 12 h light/dark cycle. The animal procedures adhered to ARRIVE (Animals in Research: Reporting In Vivo Experiments) guidelines and were approved by the Laboratory of Animal Welfare and Ethics Committee of Southwest University (IACUCI No.: IACUC-20230425-02).
Biochemical kits for determinations of uric acid, creatinine, urea nitrogen, and enzyme-linked immunosorbent assay (ELISA) kits for determinations of aspartate aminotransferase (AST), alanine aminotransferase (ALT), creatinine, urea nitrogen, TNF-α, monocyte chemoattractant protein-1 (MCP-1), LPS, NLRP3, and caspase-1 were purchased from Nanjing Jiancheng Bioengineering Institute (Jiangsu, China). Biochemical kits for IL-18, IL-10, and IL-10 were obtained from Quanzhou Ruixin Biotechnology Co., Ltd. (Fujian, China). Antibodies for NLRP3 and NF-κB p65 were purchased from Affinity (Jiangsu, China), and TLR4 antibodies and anti-fluorescence quenching sealing tablets were from Wuhan Sanying (Hubei, China). Antibodies for TLR2 and p-NF-κB p65 were obtained from Beijing Bioss Biotechnology Co., Ltd. (Beijing, China), MyD88 from Boster Biological Technology Co., Ltd. (USA), glyceraldehyde 3-phosphate dehydrogenase (GAPDH) from Hangzhou Xianzhi Biotechnology Co., Ltd. (Zhejiang, China), and fluorescent (CY3)-labeled sheep anti-mouse IgG from Wuhan Doctoral Biotechnology Co., Ltd. (Hubei, China).
Preparation of enzymatically hydrolyzed pectin from P. ligustroides leaves
The EHPPL was prepared as described in our previous publications [Deng et al., 2025; Liu et al., 2023]. The leaves were soaked in hot water at a 1:10 ratio (w/w), ground into a paste, and treated with an enzyme mixture consisting of pectinase and cellulose at a 1:1 ratio (w/w) at 50°C for 5 h. The ratio of the enzyme mixture to the leaf paste was 1:100 (w/w). After hydrolysis and suction filtration, the filtrate was further passed through a reverse osmosis membrane. The next step of purification was precipitation with ethanol (50–70%) and drying, followed by macroporous resin adsorption to achieve a molecular weight range of 5,000–35,000 Da. The composition of EHPPL was determined in our previous study [Liu et al., 2023]. In 100 g, it contained 1.33 g of protein, 1.13 g of ash, and 45.13 g of galacturonic acid. A degree of esterification was 12.56 g/100 g. The monosaccharide composition was 48.08% of glucose, 33.48% of galacturonic acid, 10.17% of arabinose, 3.03% of galactose, 1.39% of mannose, 1.25% of rhamnose, and 2.56% of xylose, with a rhamnose to galacturonic acid ratio of 0.04%.
Modeling, intervention and sampling in an in vivo experiment
After 7 days of adaptive feeding, the rats were randomly assigned to a normal control (NC) group (n=5) and a model group (n=15). The model was induced according to the method described by Zhuge et al. [2025], with some modifications. Under ether anesthesia, the right lower limb of each rat was positioned at a right angle to fully expose the ankle joint. A 4.5 injection needle was inserted into the joint cavity, guided by the posterior ligament at a 35° angle. The model group received 0.25 mL of a 5% (w/v) MSU suspension (finely ground MSU crystals were suspended in phosphate-buffered saline, PBS) into the joint cavity, while the NC group was injected with 0.25 mL of PBS. The model group was then randomly divided into three subgroups: M group, PC group, and T group (n=5 each).
Four hours after modeling, the PC group was administered allopurinol (9 mg/kg, equivalent to the human dose) orally, while the T group received EHPPL (450 mg/kg, based on preliminary experimental results) orally. The M and NC groups received an equivalent dose of saline orally. The treatment lasted for 7 days, with free access to food and water. The rats’ gait was monitored daily, and ankle joint circumference was measured.
Blood was collected from the eye socket 12 h after the last intervention. Urine was collected 24 h prior to the experiment’s conclusion. At the end of the experiment, the rats were euthanized under ether anesthesia, and blood was drawn from the abdominal aorta. After allowing the blood to stand at room temperature for 30 min, it was centrifuged at 1,000×g for 15 min at 4°C to obtain serum. Liver and kidney tissues were weighed, and a 0.5 cm × 0.5 cm section from above the ankle joint was harvested. The right part of the tissue was fixed in 4% paraformaldehyde for hematoxylin-eosin (HE) staining, while the left part was stored in liquid nitrogen for western blot analysis.
Histological observation of the ankle joint
The right ankle joint samples were used for histological examination. Standard operating procedures (SOP) for pathological testing were followed, including dehydration, embedding, slicing, staining, and sealing. Samples were examined at 20× and 200× magnifications using the Pannoramic DESK (3DHISTECH, Budapest, Hungary) and CaseViewer 2.4 software (3DHISTECH).
Ankle joint swelling was assessed daily for 7 days post-modeling using a 2–3 mm paper strip and vernier caliper. Joint swelling degree was calculated according to Equation (1):
where: A1 represents joint circumference at different time points and A2 represents initial circumference.
Determination of biochemical indicators of serum and urine
Biochemical indicators, including serum uric acid, urea nitrogen, creatinine, AST, ALT, TNF-α, MCP-1, IL-18, IL-1β, IL-10, LPS, NLRP3, and caspase-1, as well as uric acid content in urine, were measured according to the reagent kit instructions.
Western blot analysis
Ankle joint tissue was placed in a 2 mL Eppendorf tube, to which clean steel balls were added. Then, 200 μL of lysis buffer (containing 2 μL of phenylmethanesulfonyl fluoride (PMSF) and 2 μL of phosphatase inhibitor) were added for tissue lysis. The tube was homogenized using a tissue disruptor (SCIENTZ-24, Ningbo Xinzhi Biotechnology Co., Ltd., China). After homogenization, the tube was placed on ice for 30 min to ensure complete lysis, followed by centrifugation at 15,000×g for 5 min at 4°C. The supernatant was 20-fold diluted with PBS, and protein concentration was measured using a Multiskan FC microplate reader (Thermo Scientific, Waltham, MA, USA). For protein denaturation and membrane transfer, the polyvinylidene-fluoride (PVDF) membrane was soaked in tris-buffered saline with Tween 20 (TBST) with 5% skim milk powder and sealed on a shaker at room temperature for 2 h. After blocking, the membrane was incubated overnight at 4°C with specific primary antibodies (rabbit polyclonal antibodies for TLR2, MyD88, NF-κB, and NLRP3 at a 1:1,000, v/v, dilution, and TLR4 at a 1:4,000, v/v, dilution) in blocking buffer. After five 5-min washes with TBST, the membrane was incubated with secondary antibodies (1:10,000, v/v, dilution) for 2 h, followed by five additional 5-min washes with TBST. The membrane was then dried and scanned using the SH-523 chemiluminescence imaging system (Hangzhou Shenhua Technology Co., Ltd., China), and grayscale values were analyzed. Band intensities were compared to the standard protein – GAPDH.
Statistical analysis
Data were analyzed using Statistix software, version 9.0 (Analytical Software, Tallahassee FL, USA) with completely randomized analysis of variance (ANOVA) and all-pairwise comparisons Tukey’s honestly significant difference (HSD) test. Results were plotted using Excel 2010 (Microsoft, Redmond, WA, USA), and differences between groups were considered statistically significant at p<0.05.
RESULTS AND DISCUSSION
Serum level of uric acid and creatinine, and ankle joint condition at 12 h after modeling
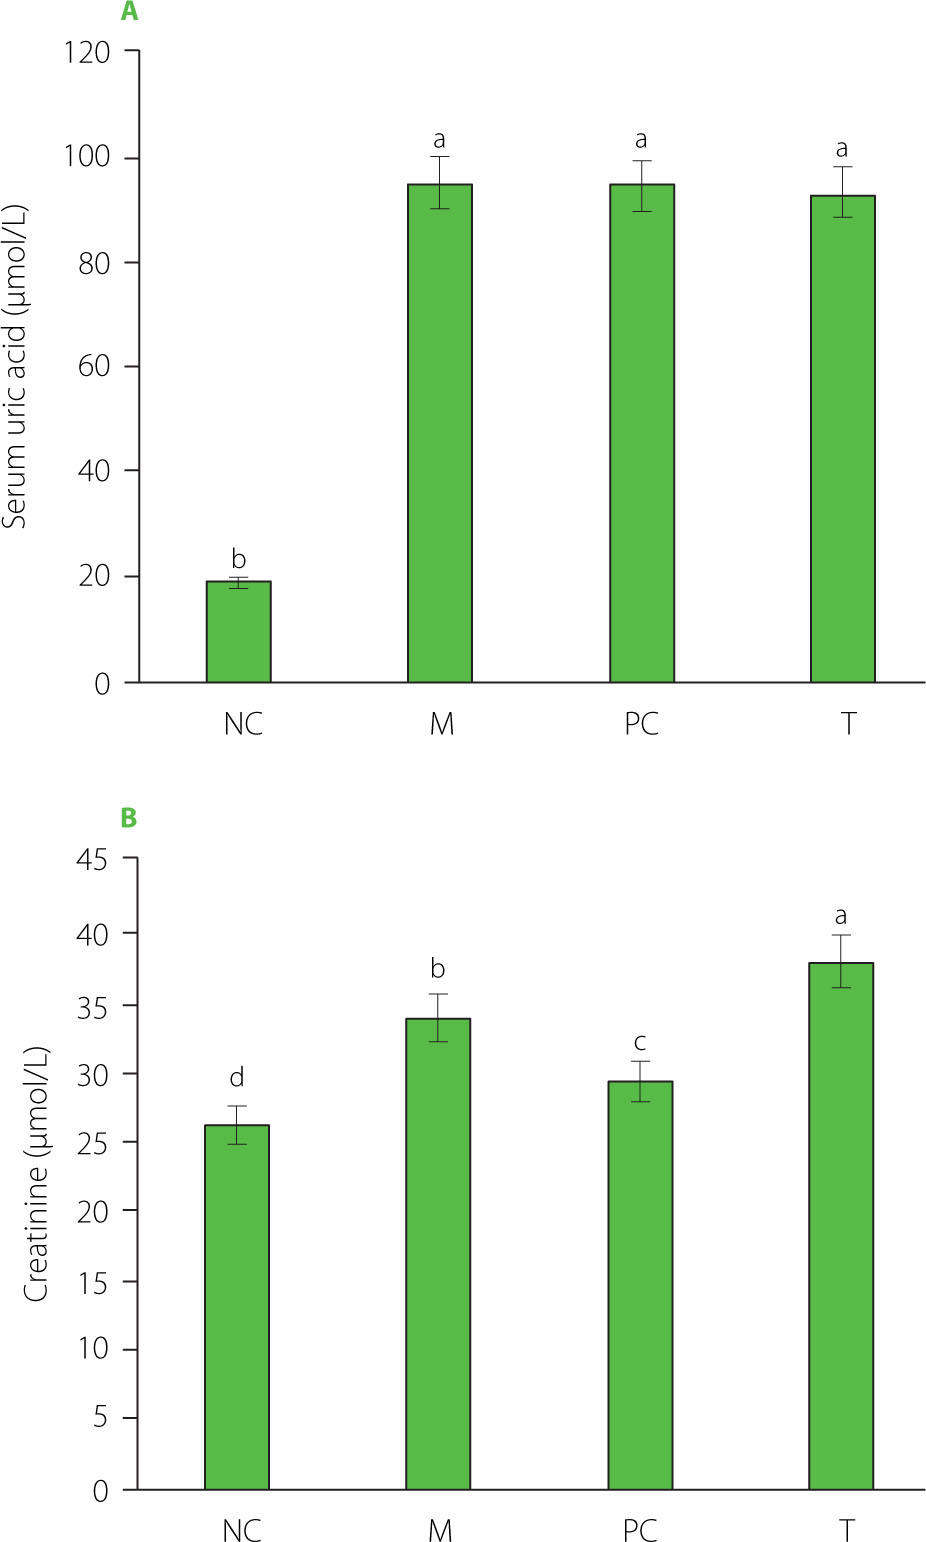
At 12 h post-modeling, the right ankle joints of the rats exhibited varying degrees of redness, swelling, loss of bone markers, limited movement, curled feet, and a three-legged gait. Significant increases were found in serum uric acid and creatinine levels (p<0.05) after 12 h of modeling, with serum uric acid reaching 95.10 μmol/L (Figure 1). MSU crystals were metabolized and entered the bloodstream, elevating uric acid levels, which in turn triggered systemic inflammation [Perez-Ruiz & Becker, 2015]. Excess uric acid crystallized, causing localized inflammation and tissue damage [Kushiyama et al., 2016].
Figure 1
Serum uric acid (A) and creatinine (B) levels at 12 h after modeling. Data are presented as mean ± standard deviation (n=3). Different lowercase letters indicate significant differences (p<0.05) between groups. NC, normal control group; M, model group (gout-induced rats); PC, allopurinol group; T, group receiving enzymatically hydrolyzed pectin from leaves of Premna ligustroides Hemsl. (EHPPL).
Changes in the body weight of rats during the intervention period
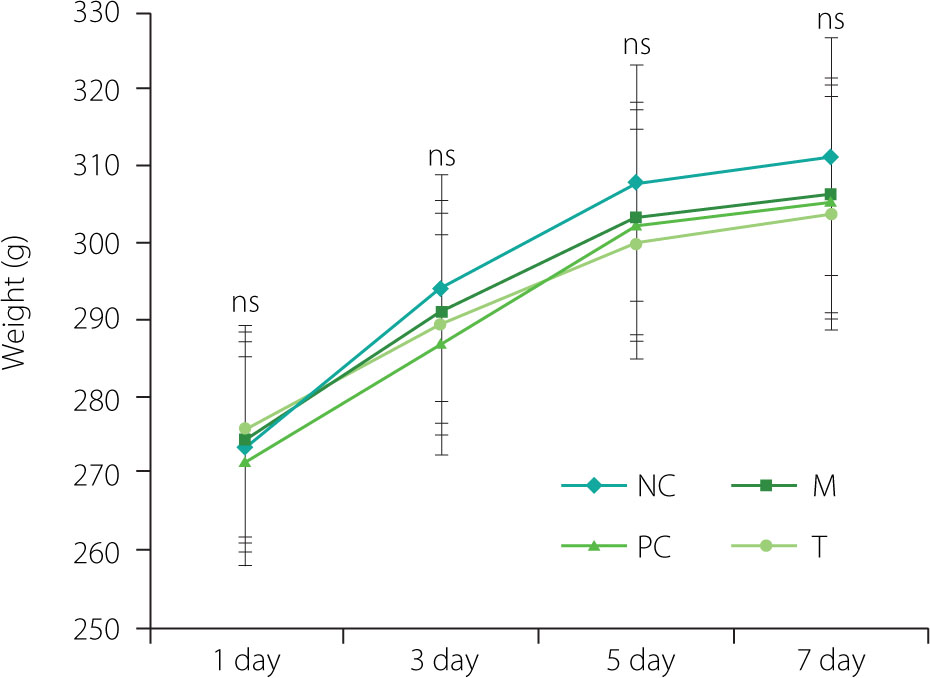
During the feeding adaptation phase, the rats appeared healthy, exhibiting shiny fur, good general condition, and normal eating habits. After MSU injection, they showed reduced activity and appetite. However, rats in the T and PC groups gradually resumed normal activity after receiving EHPPL or allopurinol. As presented in Figure 2, the changes in body weight remained stable, with no significant fluctuations, and there were no significant differences in the final body weight of rats from different groups (p≥0.05), indicating the relative safety of EHPPL.
Figure 2
Changes in rat body weight during the intervention period. Data are presented as mean ± standard deviation (n=5). ns denotes no significant differences (p≥0.05) between groups on the same day. NC, normal control group; M, model group (gout-induced rats); PC, allopurinol group; T, group receiving enzymatically hydrolyzed pectin from leaves of Premna ligustroides Hemsl. (EHPPL).
Swelling degree and pathological analysis of ankle joints in rats
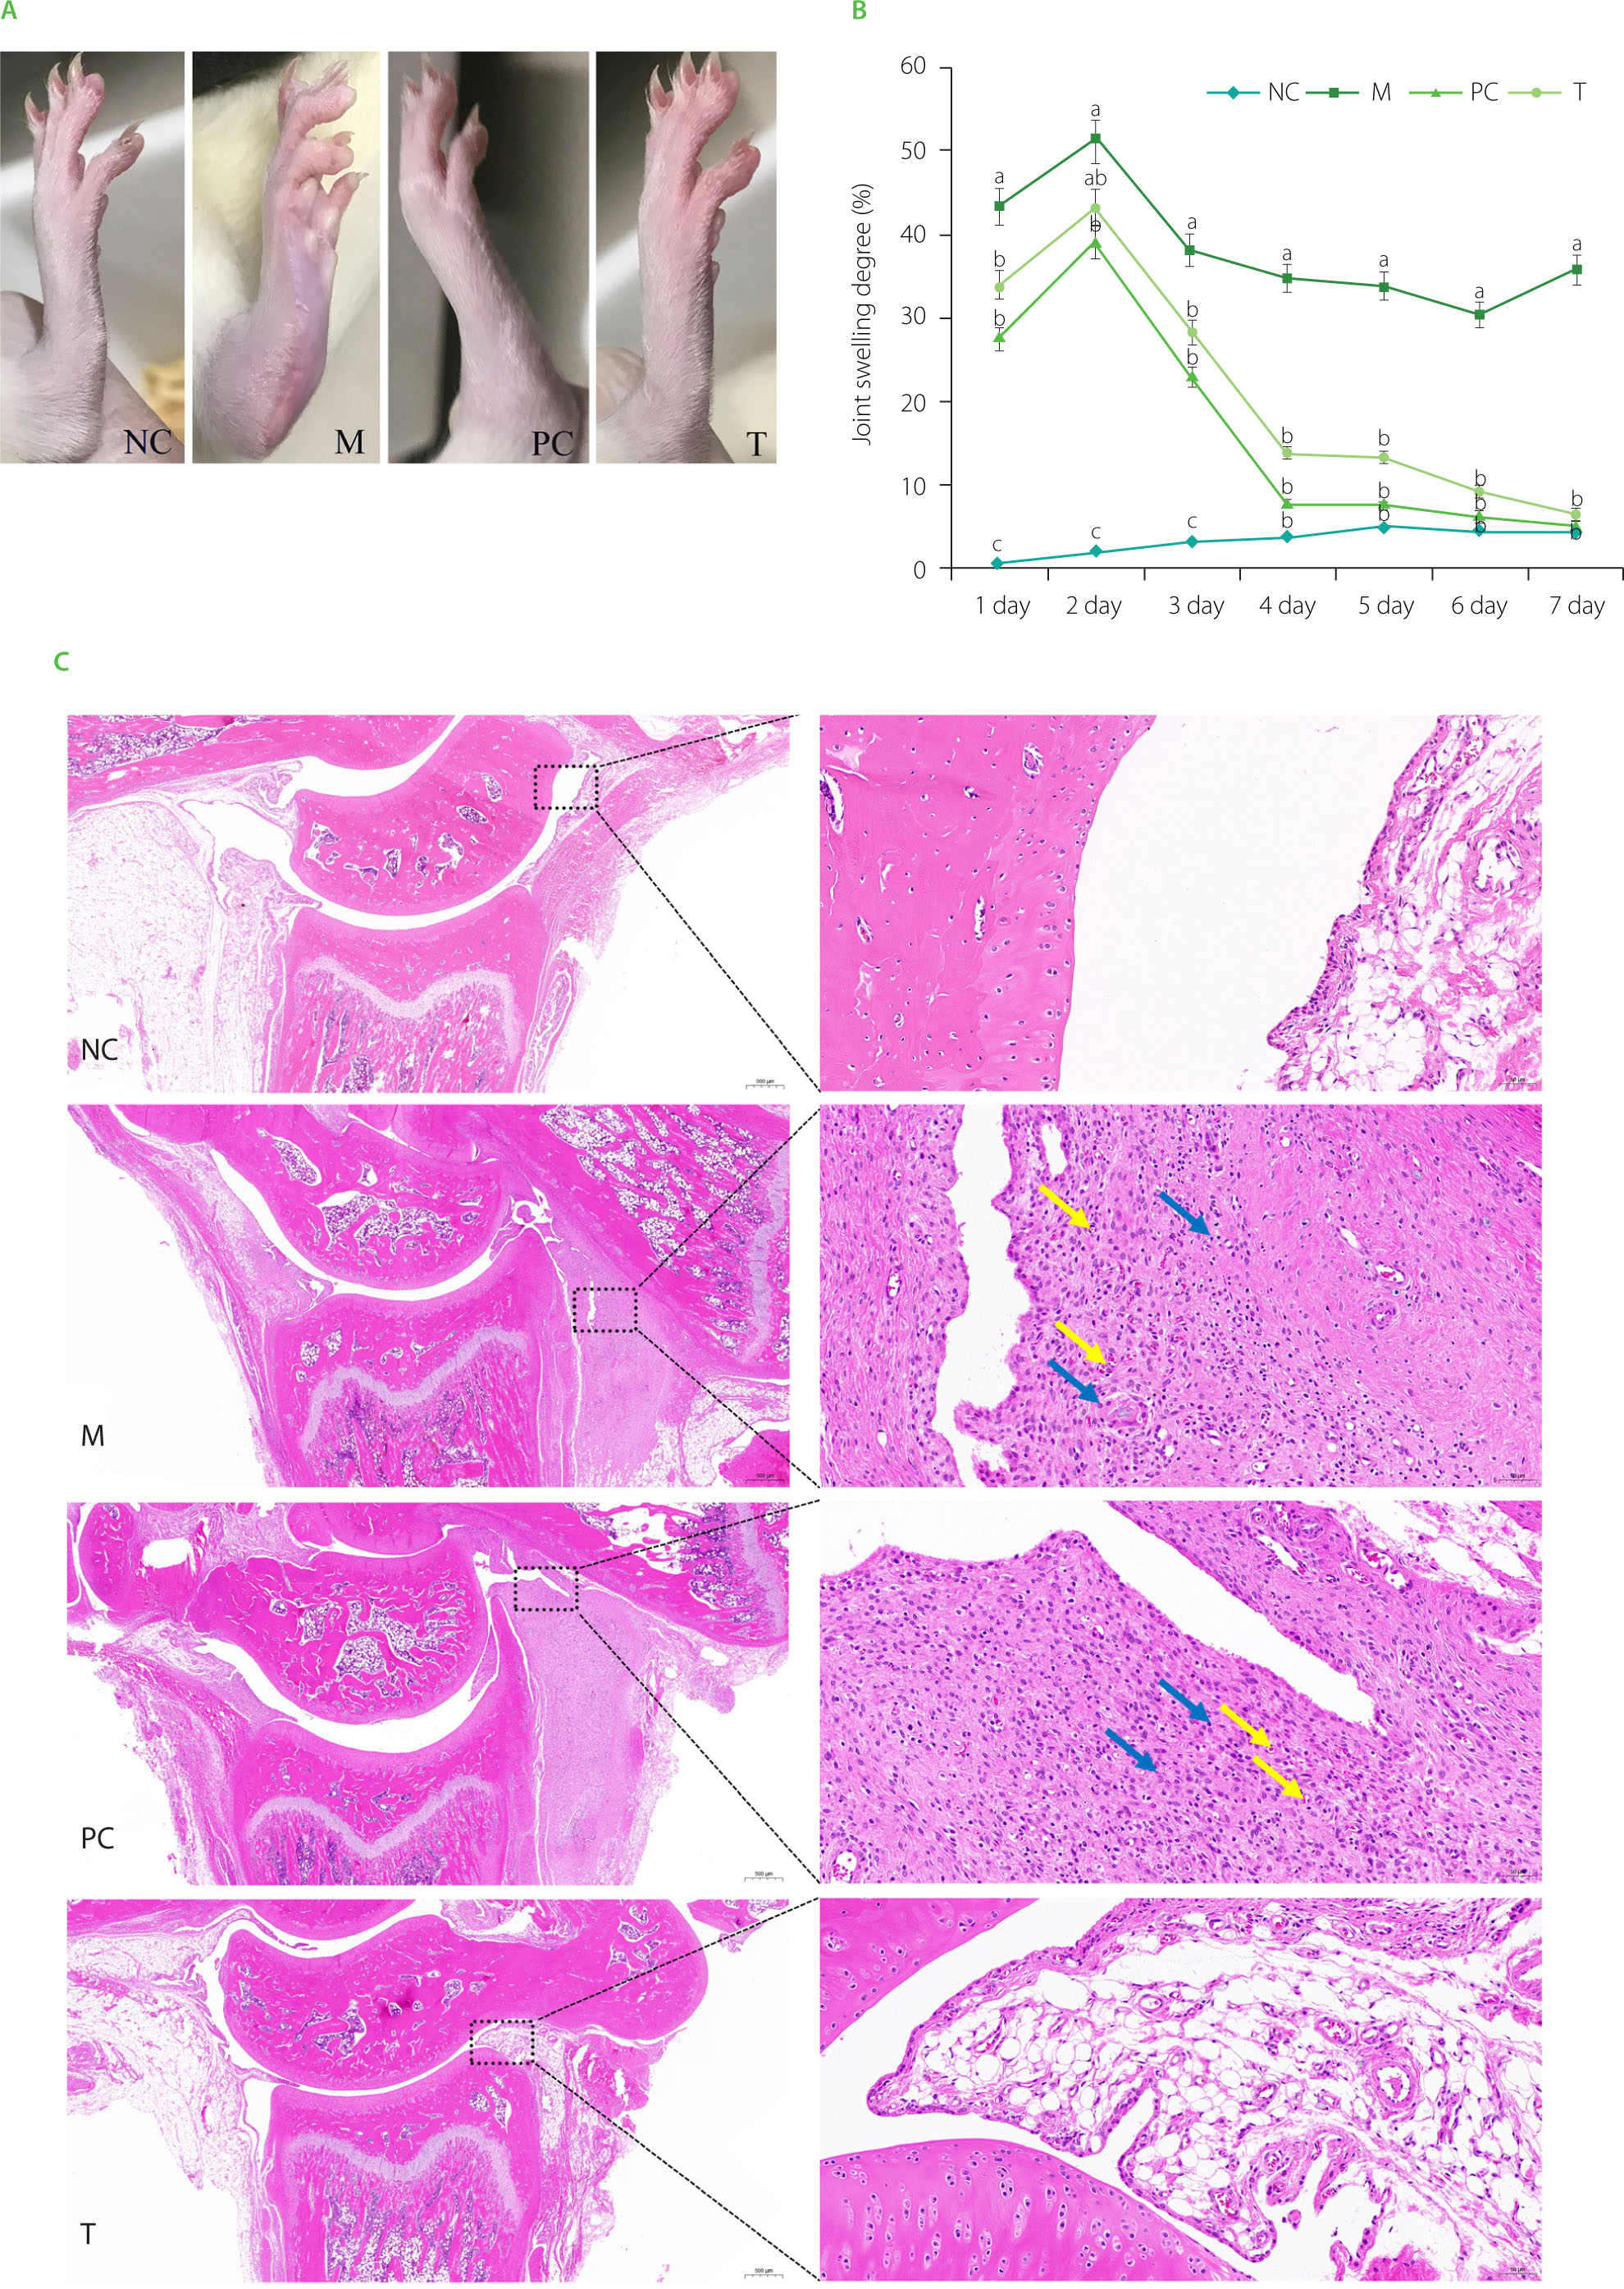
As presented in Figure 3A, on the 4th day post-modeling, rats in the M group exhibited ankle redness and swelling. In contrast, the PC and T groups showed nearly normal conditions. As presented in Figure 3B, ankle joint swelling degree peaked on the second day post-modeling, with the M group displaying significantly greater swelling than the NC group (p<0.05). Treatment with EHPPL and allopurinol reduced ankle redness and joint swelling degree returning it nearly to normal by day 4 (p≥0.05). Gait gradually improved, normalizing by day 7.
Pathological sections of ankle joints are shown in Figure 3C. The NC group exhibited normal structure, smooth cartilage, and uniform tissue staining with no signs of synovial proliferation or inflammation. The M group displayed severe synovial connective tissue proliferation, neovascularization (yellow arrow), and infiltration by lymphocytes and macrophages (blue arrow). The PC group showed slight synovial proliferation, neovascularization (yellow arrow), and immune cell infiltration (blue arrow). The T group exhibited normal ankle joint structure with no pathological abnormalities.
Figure 3
Ankle joint condition after 4 days of intervention (A), joint swelling degree (B), and histology images of the ankle joint at 20× (left images) and 200× (right images) magnifications (C). Data are presented as mean ± standard deviation (n=3). Different lowercase letters indicate significant differences (p<0.05) between groups on the same day. NC, normal control group; M, model group (gout-induced rats); PC, allopurinol group; T, group receiving enzymatically hydrolyzed pectin from leaves of Premna ligustroides Hemsl. (EHPPL).
Serum levels of uric acid, creatinine, and urea nitrogen, and the uric acid content in urine
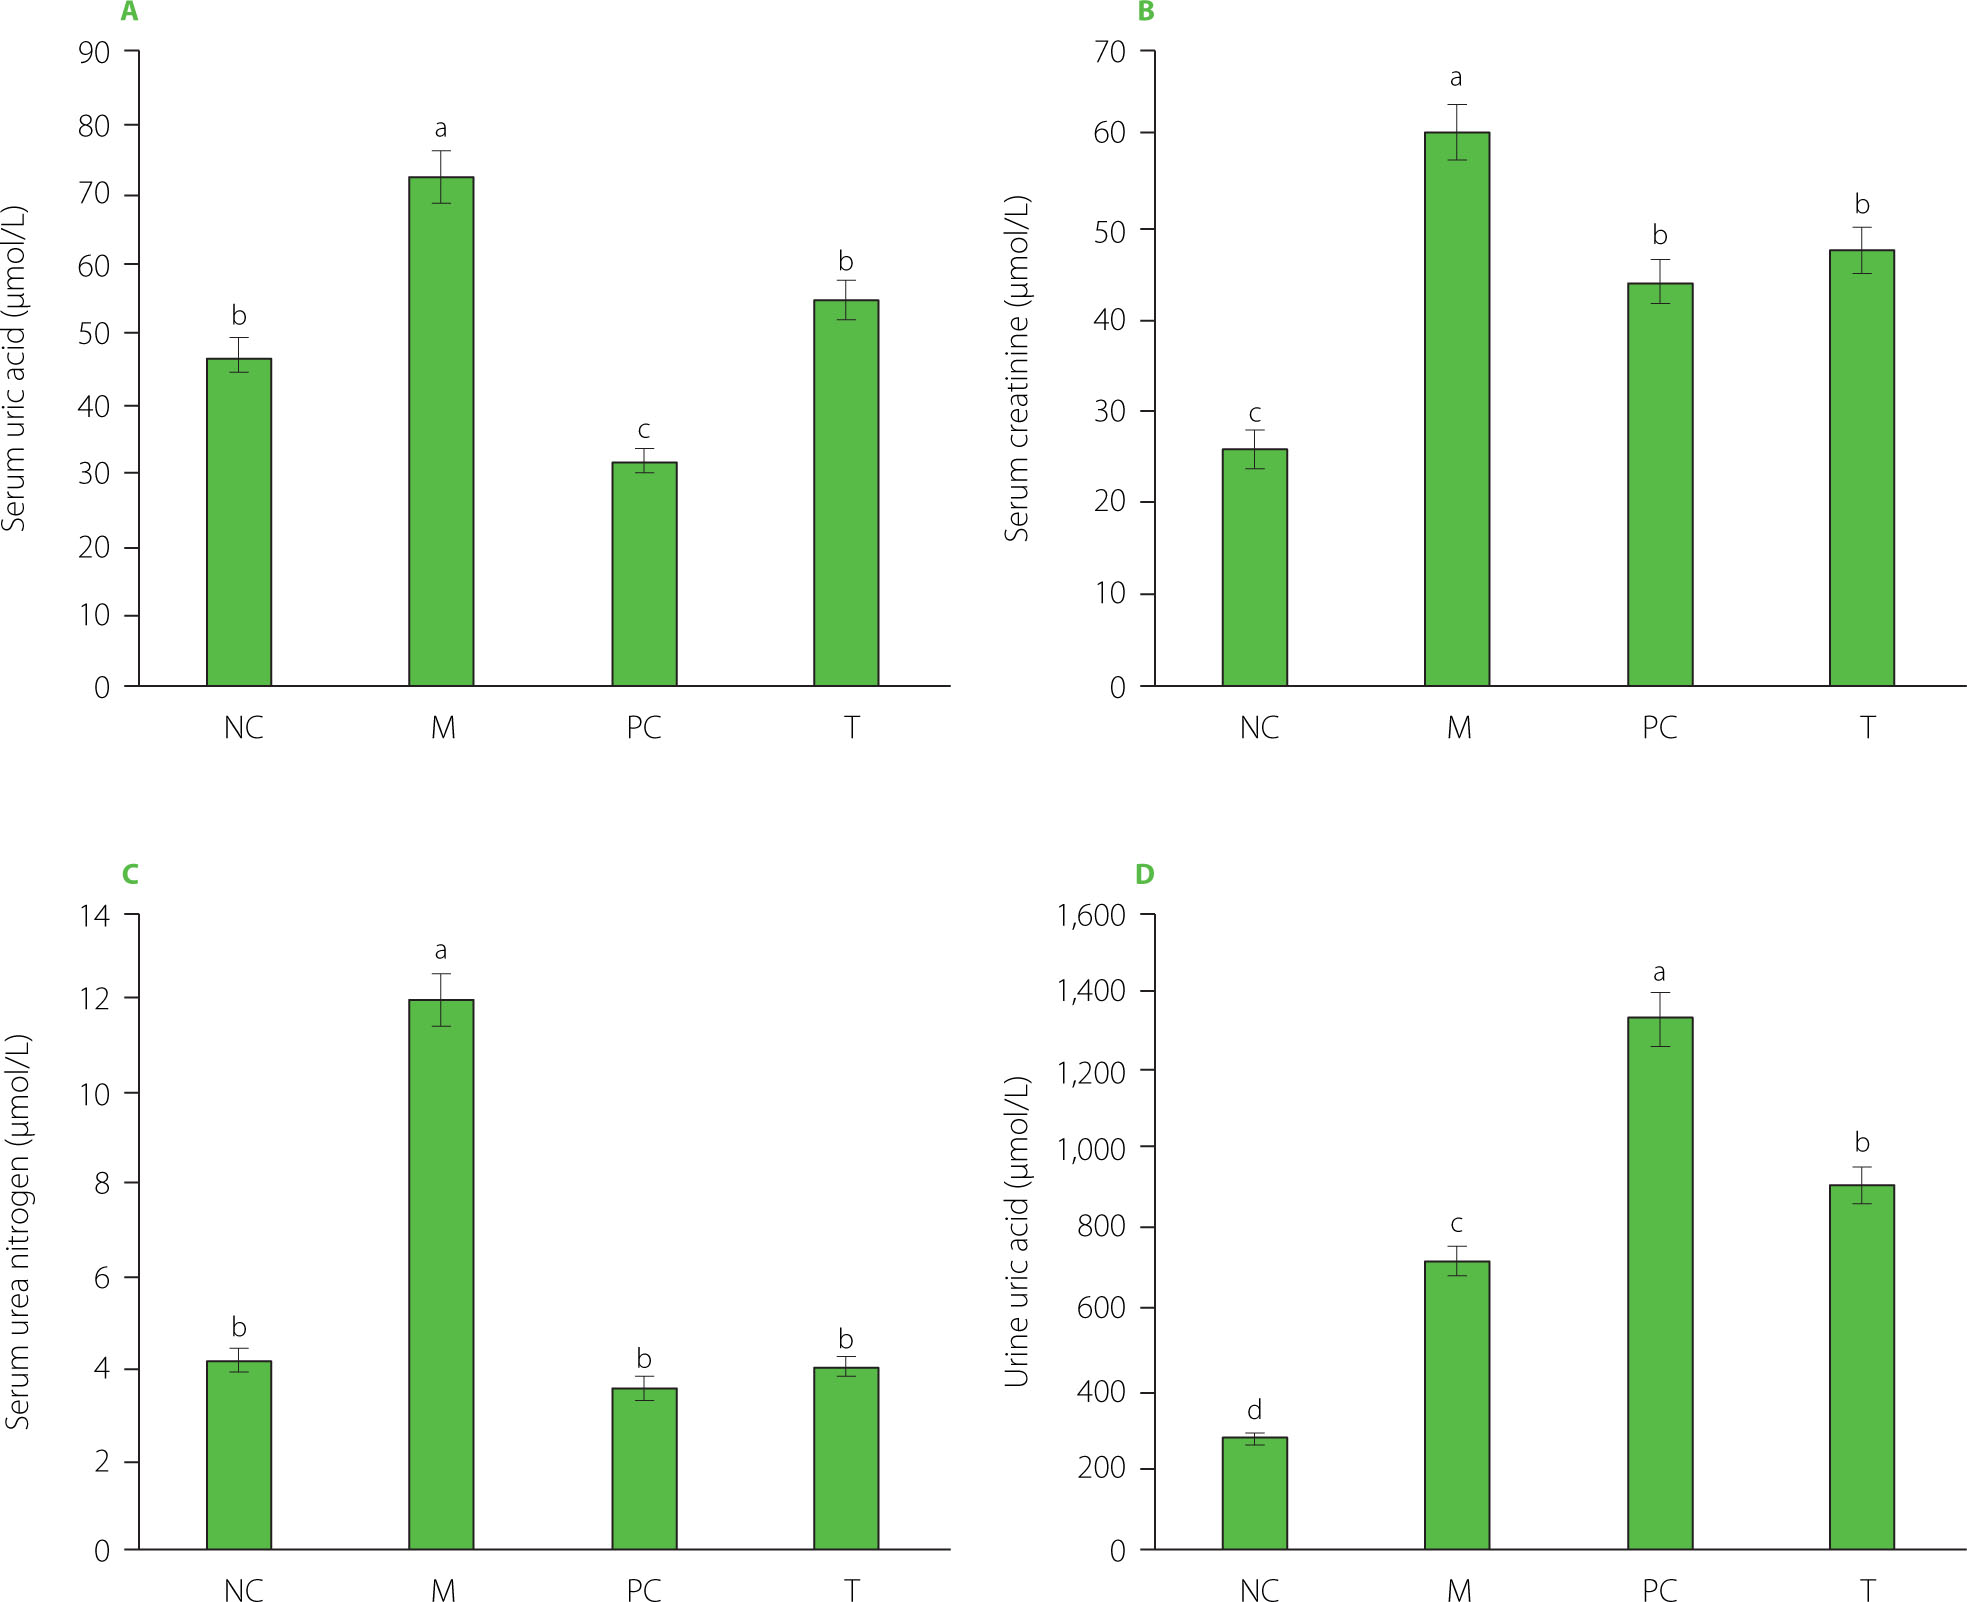
As shown in Figure 4A–C, the M group exhibited significantly elevated serum uric acid, creatinine, and urea nitrogen levels compared to the NC group (p<0.05). However, after the treatment with EHPPL and allopurinol, the T group and PC groups showed a significant reduction in these indicators (p<0.05). EHPPL reduced serum uric acid from 73.38 to 54.85 μmol/L and urea nitrogen levels from 11.97 to 4.02 mmol/L (p<0.05), returning levels to those similar to the NC group. Serum creatinine concentration is a key indicator of renal function [Zhang et al., 2018], suggesting that MSU may potentially damage the kidneys, while EHPPL could offer renal protection. Additionally, Figure 4D shows a significant increase in urinary uric acid excretion (p<0.05) in the PC and T groups, indicating that both EHPPL and allopurinol facilitated uric acid elimination via urine. Numerous studies have confirmed that polysaccharides can influence uric acid metabolism. For instance, polysaccharides from γ-irradiated and non-irradiated Schizophyllum commune have demonstrated kidney uric acid-lowering effects in Kunming mice [Yin et al., 2022]. Li et al. [2021] found that a polysaccharide from Enteromorpha prolifera, containing rhamnose, glucuronic acid, galactose, arabinose, and xylose, significantly reduced serum uric acid, serum urea nitrogen, serum XOD, and liver XOD levels in hyperuricemic mice. Similarly, Wang et al. [2021] showed that neutral polysaccharides extracted from corn silk effectively decreased blood uric acid levels, reduced liver XOD activity, improved kidney damage, and enhanced uric acid excretion in hyperuricemic mice.
Figure 4
Serum uric acid (A), creatinine (B), and urea nitrogen (C) levels, and uric acid content in urine (D) of rats. Data are presented as mean ± standard deviation (n=3). Different lowercase letters indicate significant differences (p<0.05) between groups. NC, normal control group; M, model group (gout-induced rats); PC, allopurinol group; T, group receiving enzymatically hydrolyzed pectin from leaves of Premna ligustroides Hemsl. (EHPPL).
Liver and kidney indexes and serum enzyme activity
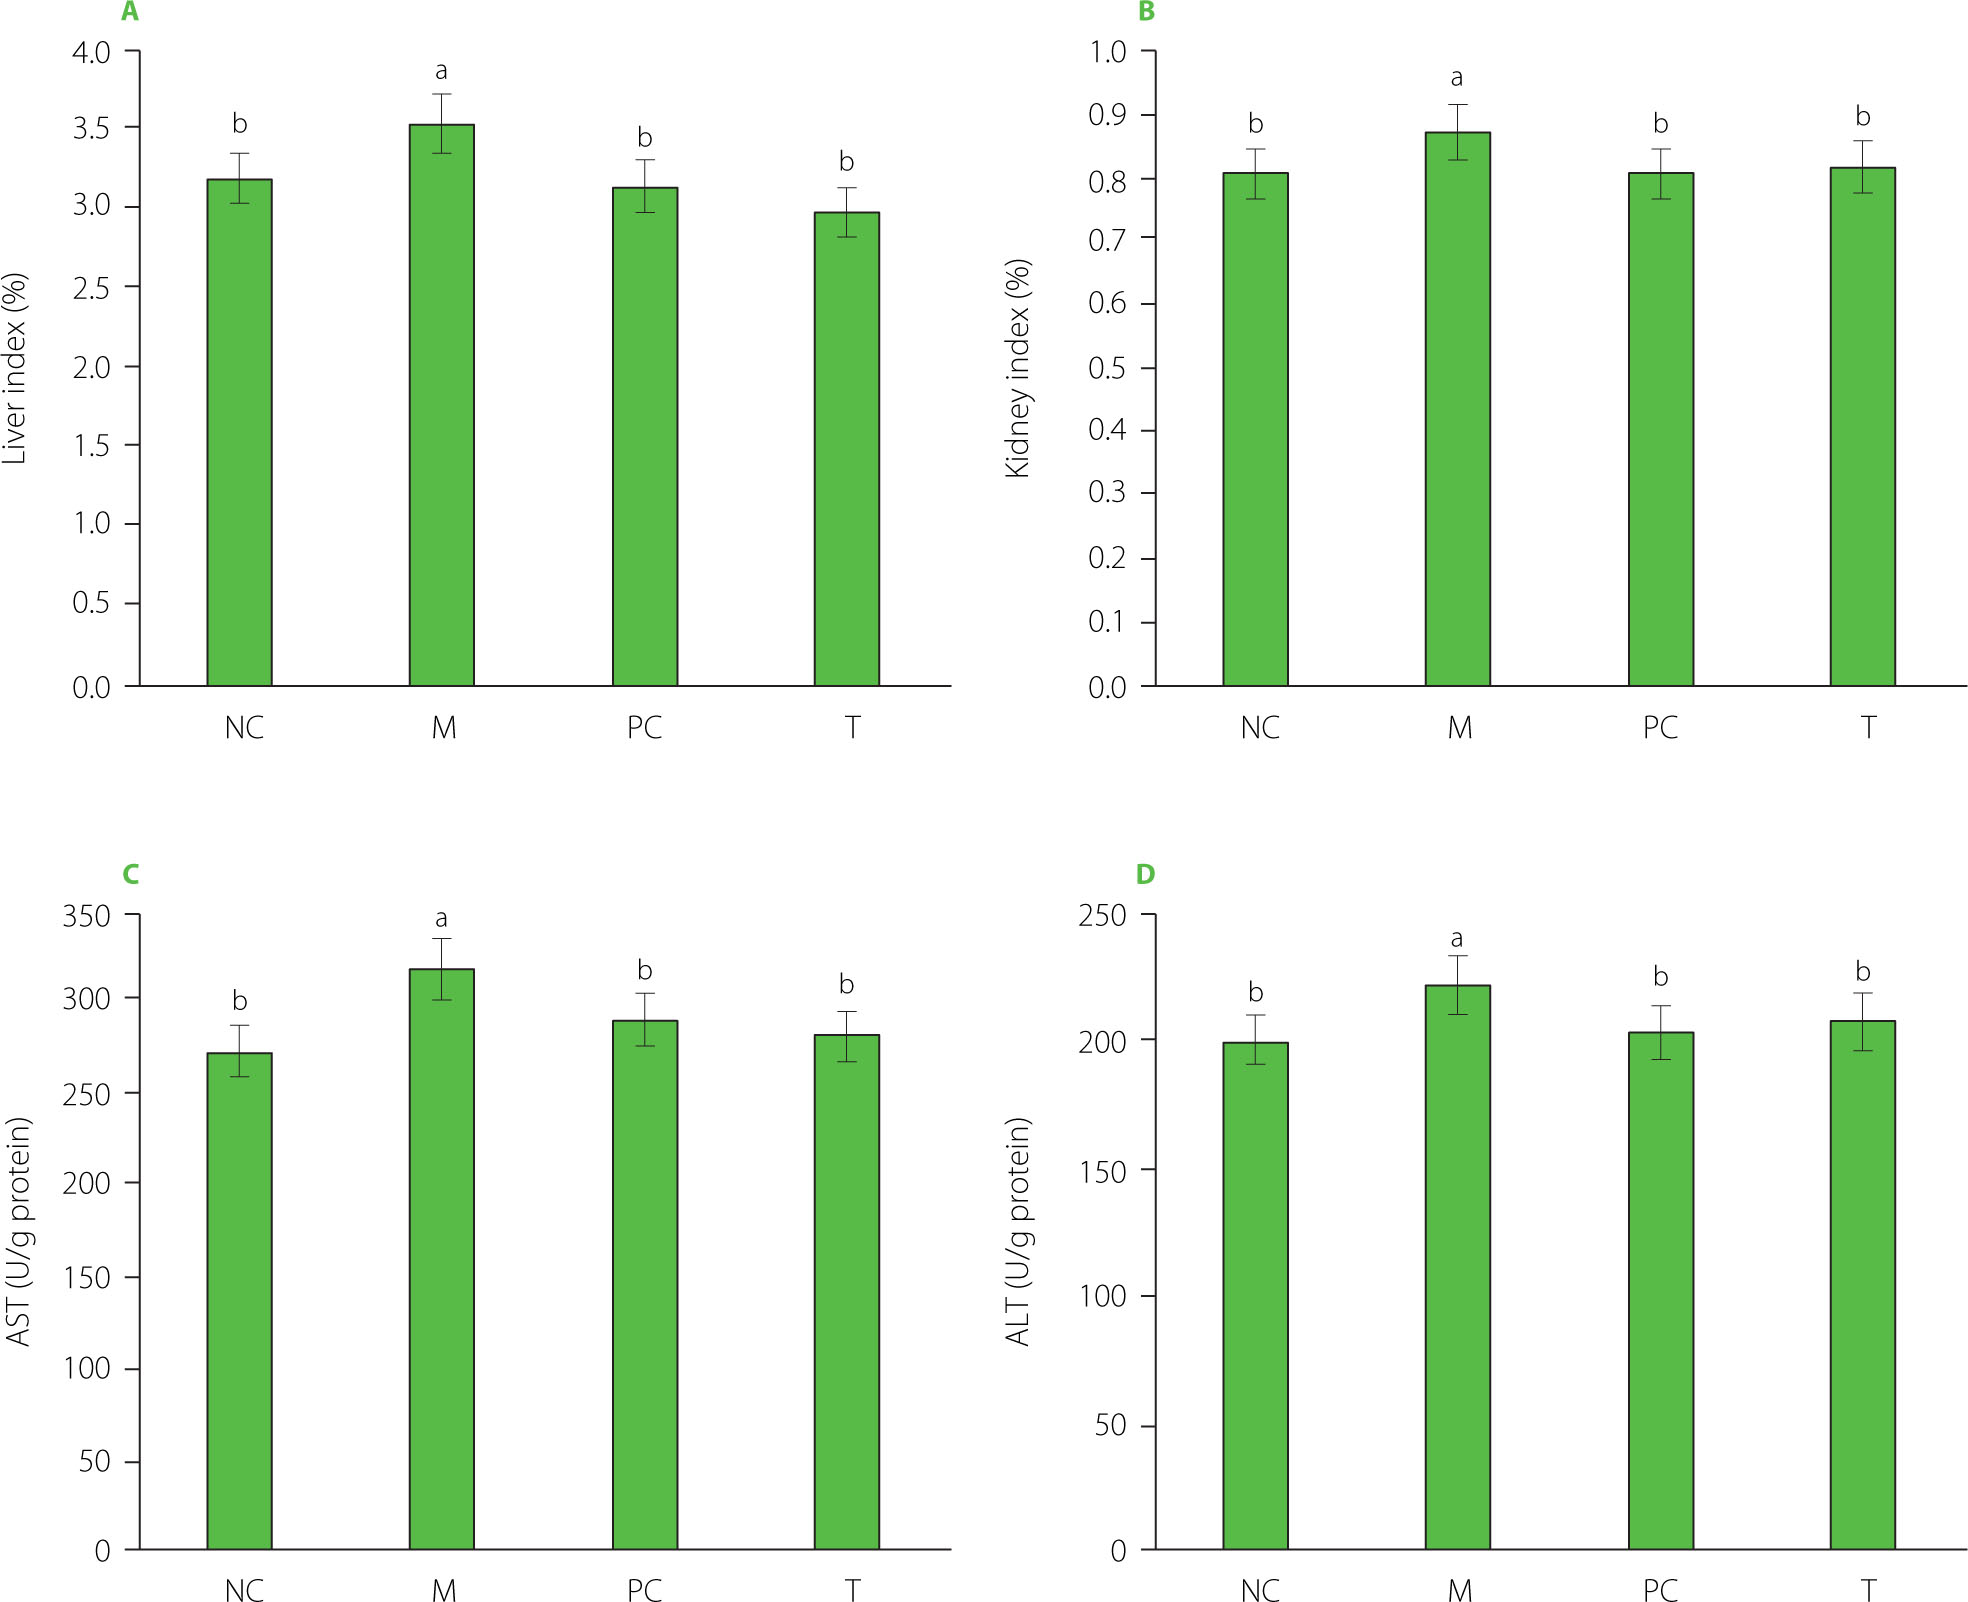
As presented in Figure 5A and 5B, the liver and kidney indexes in the M group were significantly elevated (p<0.05) compared to the other groups. High uric acid levels are known to induce oxidative stress, leading to considerable damage, particularly to the kidneys and liver [Liu et al., 2021a; Packer et al., 2020]. In our experiment, MSU injection resulted in a significant increase in uric acid levels in the M group, reaching 95.10 μmol/L, which was five times higher than in the NC group (Figure 1A), potentially contributing to organ damage. Moreover, as presented in Figure 5C and 5D, serum AST and ALT activity levels were notably elevated in the M group, indicating liver damage in this group. When liver cells are damaged, enzymes like AST and ALT are released into the bloodstream. Impaired liver and kidney function can disrupt uric acid metabolism and excretion, further exacerbating gout symptoms.
Figure 5
Liver index (A) and kidney index (B), serum aspartate aminotransferase (AST) levels (C), and alanine aminotransferase (ALT) levels (D) of rats. Data are presented as mean ± standard deviation (n=3). Different lowercase letters indicate significant differences (p<0.05) between groups. NC, normal control group; M, model group (gout-induced rats); PC, allopurinol group; T, group receiving enzymatically hydrolyzed pectin from leaves of Premna ligustroides Hemsl. (EHPPL).
Our prior research demonstrated that EHPPL could reduce the abnormal elevation of the liver index in mice with hypercholesterolemia [Deng et al., 2025]. Seabuckthorn polysaccharides have been shown to alleviate insulin resistance in diabetic rats, reducing liver and kidney damage. This effect is attributed to the inhibition of the PERK/ATF4/CHOP pathway activity [Yao et al., 2021]. Polysaccharides from Salvia miltiorrhiza Bunge residue exert anti-liver injury effects and immune enhancement [Jiang et al., 2020]. Additionally, sulfate polysaccharides from brown algae have been demonstrated to lower blood uric acid levels in hyperuricemic mice, regulate urea nitrogen and creatinine levels, improve kidney function, reduce oxidative damage to liver and kidney tissues, and help maintain normal organ function [Jiao et al., 2011]. Neutral polysaccharides in corn silk also exhibit anti-hyperuricemia effects by inhibiting XOD activity, reducing blood uric acid production, protecting kidney function, and promoting uric acid excretion [Yuan et al., 2022]. Furthermore, the green alga Enteromorpha prolifera polysaccharides reduce uric acid accumulation in mice by enhancing ABCG2 protein expression [Li et al., 2021]. These findings suggest that EHPPL may effectively improve liver and kidney function in rats by enhancing uric acid clearance.
Serum inflammatory markers
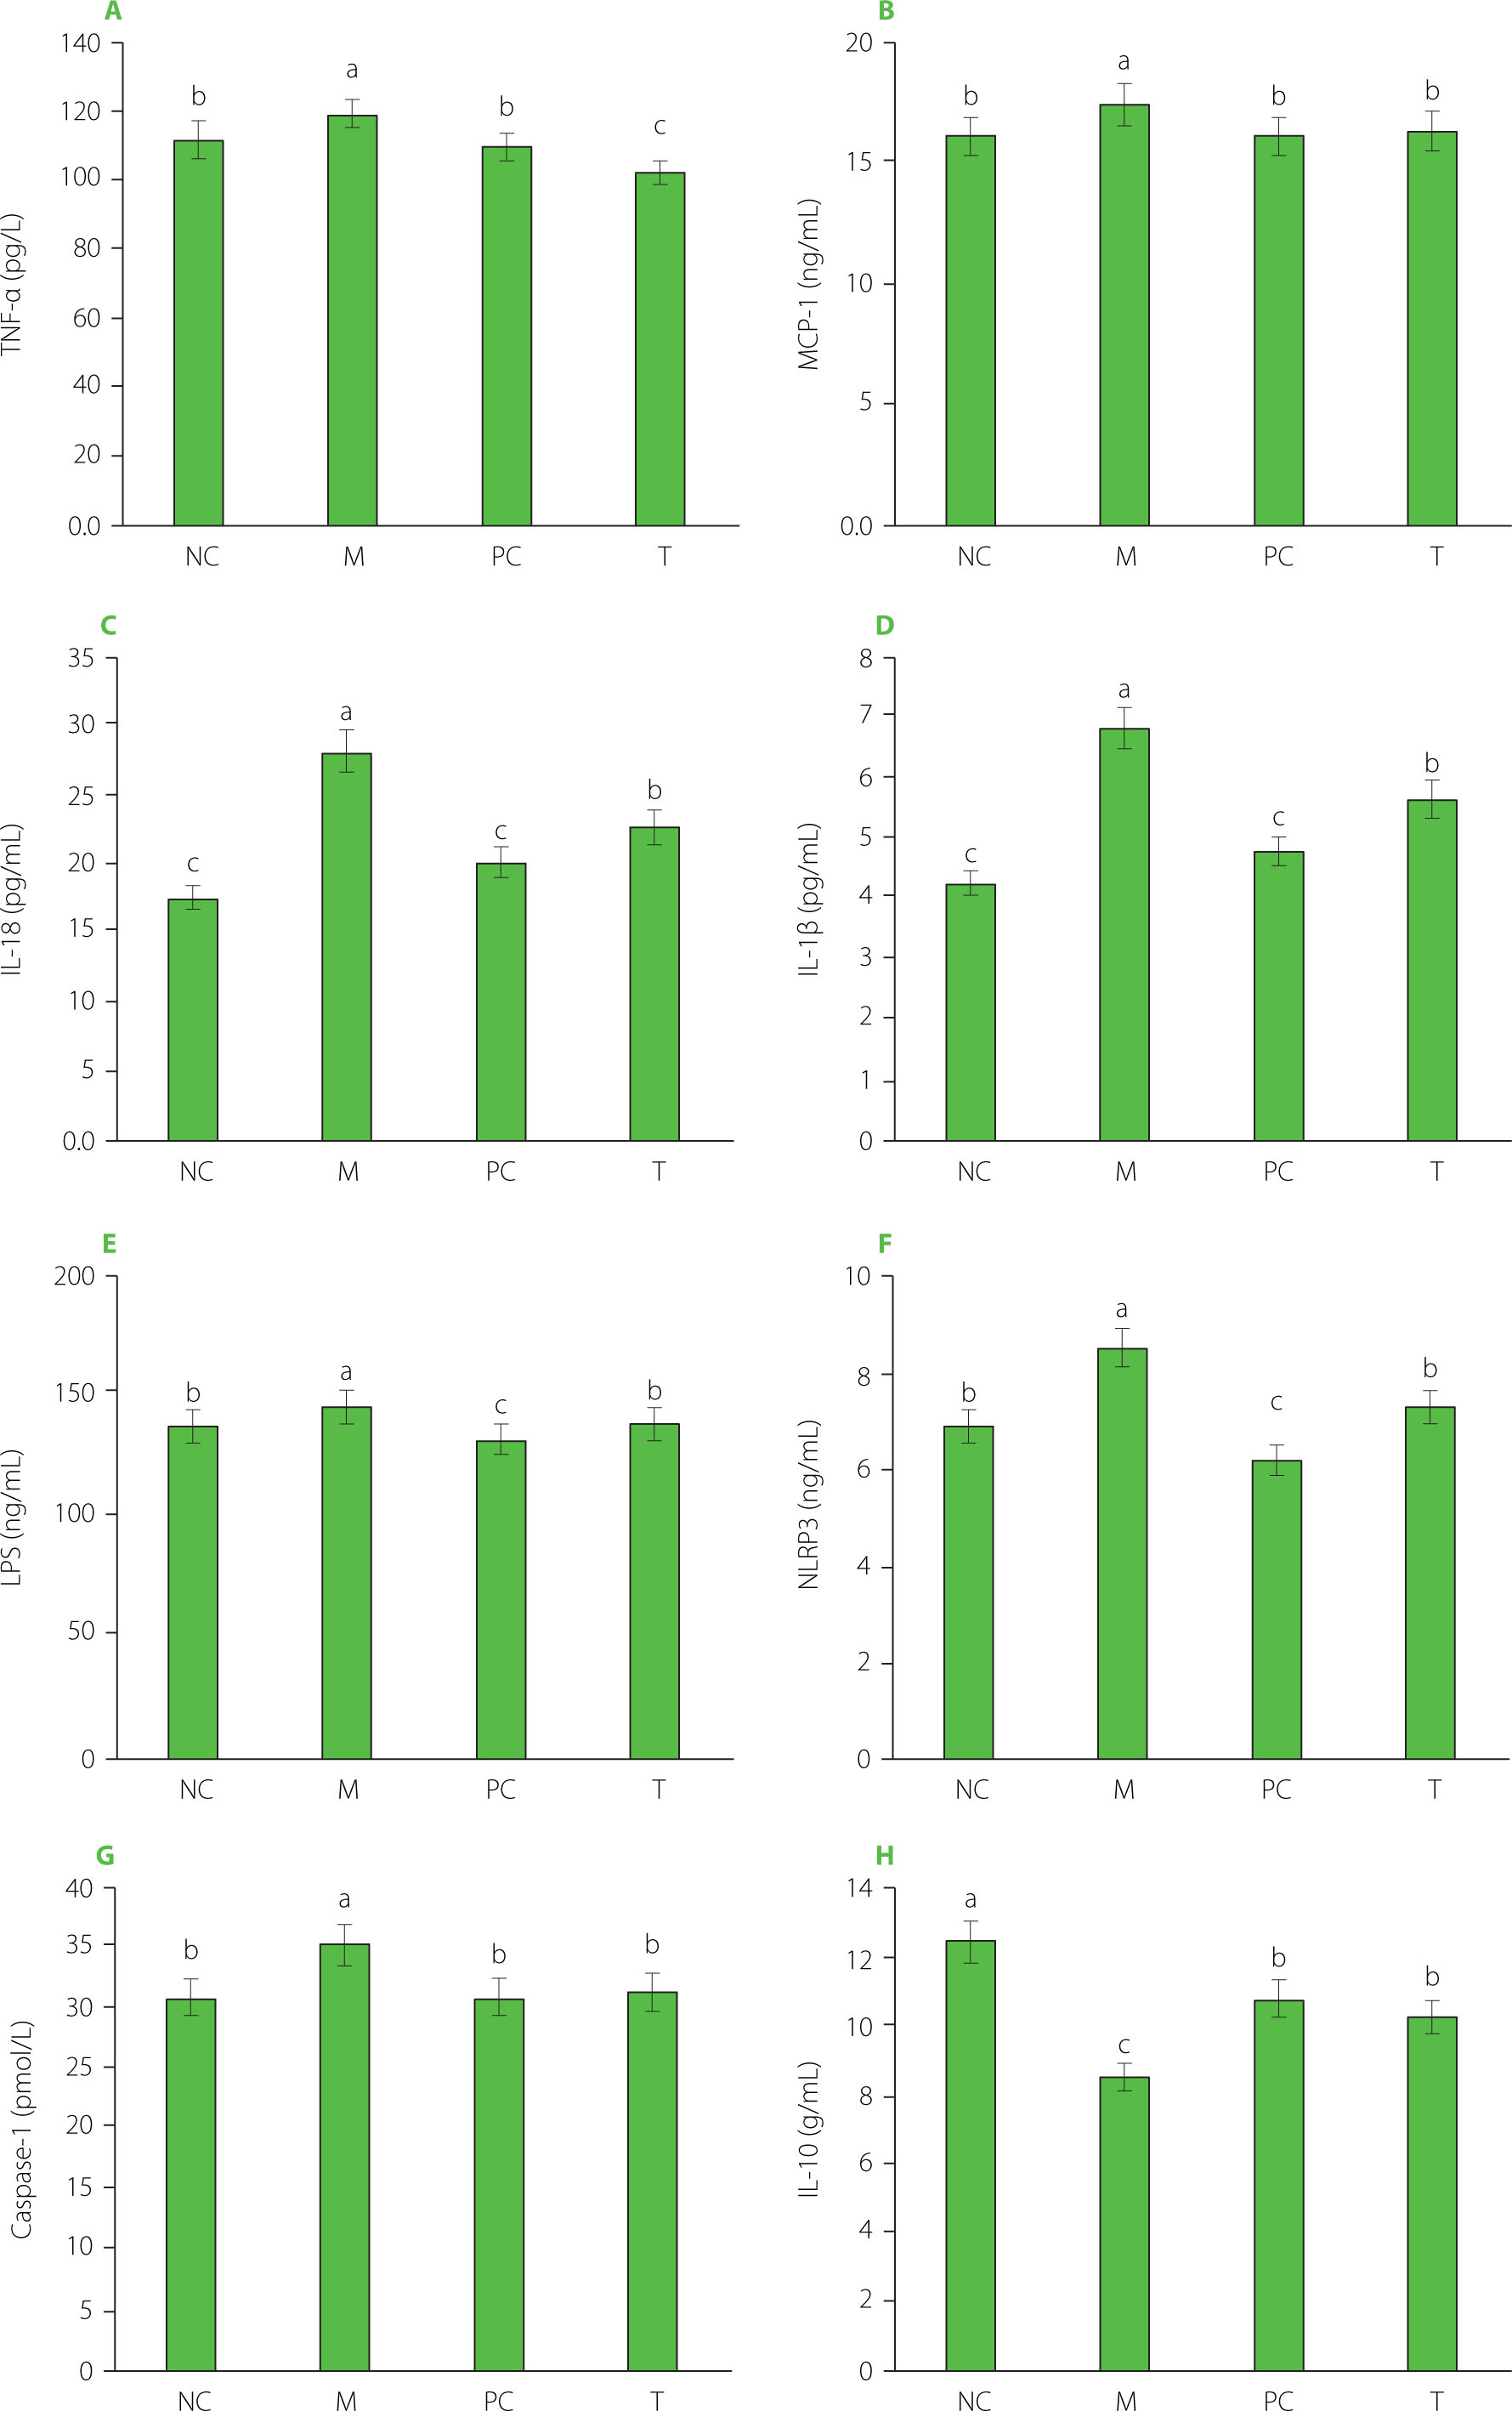
The M group exhibited significantly elevated levels of inflammatory markers, including TNF-α, MCP-1, IL-18, IL-1β, LPS, NLRP3, and caspase-1, compared to the NC group (p<0.05) (Figure 6). Following EHPPL treatment, the T group showed a pronounced reduction in these markers compared to the M group (p<0.05). Acute gout is often characterized by joint inflammation driven by the secretion of inflammatory mediators and immune cell infiltration. The NLRP3 inflammasome plays a pivotal role in activating caspase-1, leading to the maturation of IL-1β and IL-18, both of which are critical in gout pathogenesis. Specifically, IL-1β release triggers inflammation, and excessive NLRP3 inflammasome activation is a primary source of IL-1β in gout [Kim, 2022]. In the present study, MSU stimulated the secretion of inflammatory markers such as TNF-α, MCP-1, IL-18, IL-1β, LPS, NLRP3, and caspase-1, while simultaneously reducing the anti-inflammatory cytokine IL-10. Natural ingredients in food, such as chrysanthemum extract [Peng et al., 2019], moringa leaf hydrolysate [Tian et al., 2021], rhizomes of Smilax glabra Roxb. [Wang et al., 2019], celery seed extract [Li et al., 2019], Dendrobium candidum leaf macroporous resin extract [Lou et al., 2020], and Dendrobium loddigesii Rolfe extract [Zhang et al., 2020], can alleviate arthritis and hyperuricemia by reducing inflammatory responses. In this context, EHPPL was found to inhibit MSU-induced NLRP3 activation, thereby improving gout symptoms through the reduction of inflammatory mediator secretion and immune cell infiltration, as confirmed by HE staining (Figure 3C).
Figure 6
Levels of TNF-α (A), MCP-1 (B), IL-18 (C), IL-1β (D), LPS (E), NLRP3 (F), caspase-1 (G), and IL-10 (H) in rat serum. Data are presented as mean ± standard deviation (n=3). Different lowercase letters indicate significant differences (p<0.05) between groups. NC, normal control group; M, model group (gout-induced rats); PC, allopurinol group; T, group receiving enzymatically hydrolyzed pectin from leaves of Premna ligustroides Hemsl. (EHPPL).
TLR2, TLR4, MyD88, NF-κB, and NLRP3 signaling pathway
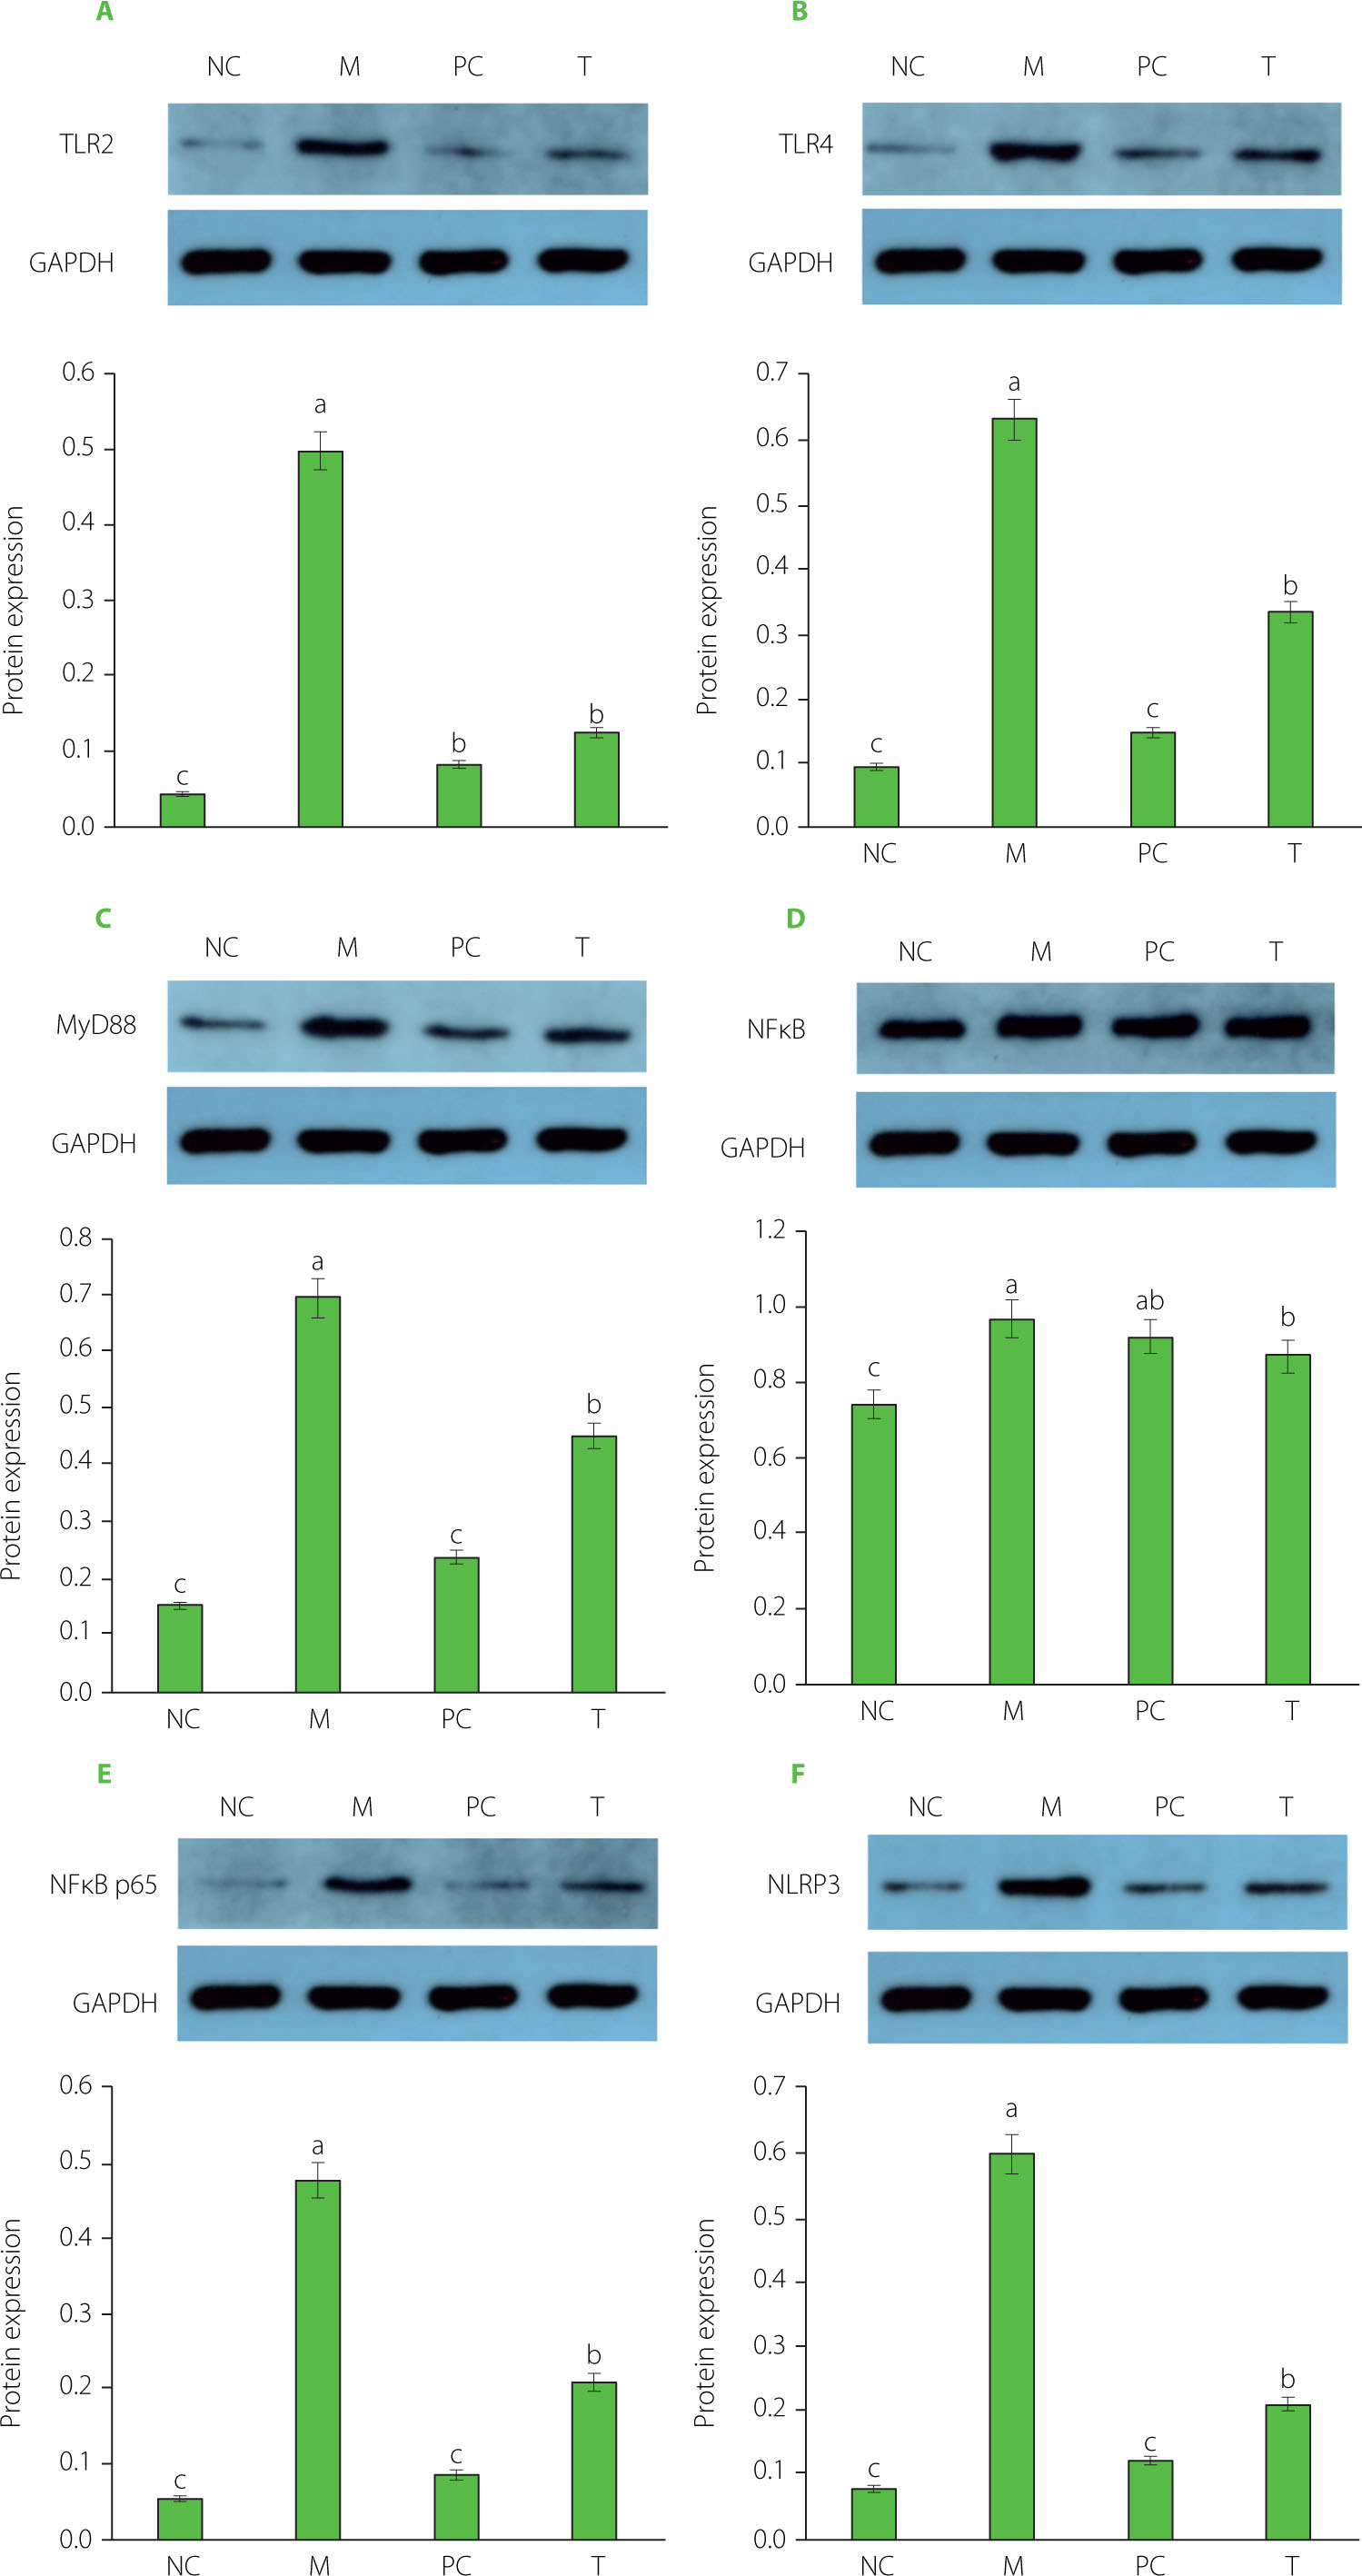
The results regarding key proteins involved in the TLR2/TLR4/MyD88/NF-κB pathway are shown in Figure 7. In the M group, the relative expression levels of TLR2, TLR4, MyD88, NF-κB, and NLRP3 in ankle joint tissue were significantly elevated compared to the NC group (p<0.05). After EHPPL treatment, these proteins were significantly downregulated (p<0.05) compared to the M group. High uric acid levels can activate inflammatory responses, triggering the NLRP3 inflammasome via the TLR4 pathway, which promotes the production of caspase-1 and IL-1β. The TLR4/NF-κB signaling pathway plays a critical role in regulating inflammatory factors and immune responses. TLR4, a transmembrane receptor, responds to inflammatory stimuli by activating the MyD88 protein, which, in turn, enhances NF-κB transcriptional activity. NF-κB then translocates to the nucleus and activates the expression of pro-inflammatory cytokines [Wang et al., 2018]. These findings suggest that EHPPL mitigates the inflammatory response induced by high uric acid levels by inhibiting the TLR2/TLR4/MyD88/NF-κB pathway.
Figure 7
Protein expression of TLR2 (A), TLR4 (B), MyD88 (C), NF-κB (D), NF-κB p65 (E), and NLRP3 (F). Data are presented as mean ± standard deviation (n=3). Different lowercase letters indicate significant differences (p<0.05) between groups. NC, normal control group; M, model group (gout-induced rats); PC, allopurinol group; T, group receiving enzymatically hydrolyzed pectin from leaves of Premna ligustroides Hemsl. (EHPPL).
Under normal conditions, inflammatory cells typically express low levels of NLRP3 protein. However, external stimuli activate NF-κB, leading to increased NLRP3 expression, which subsequently activates caspase-1 and promotes the expression of IL-1β and IL-18 precursors [Kim, 2022]. IL-1β plays a central role in joint inflammation, contributing to the swelling and pain characteristic of acute gout. The NLRP3 inflammasome drives IL-1β release, exacerbating the inflammatory response by inducing vasodilation and attracting neutrophils to the site of urate crystal deposition [Guo et al., 2021; Zeng et al., 2020]. Furthermore, activated caspase-1 promotes the release of pro-inflammatory mediators, leading to pyroptosis [Aglietti & Dueber, 2017]. Inhibiting IL-1β and caspase-1 generation effectively alleviates inflammation, as demonstrated by EHPPL’s anti-inflammatory effects in gout rats. These results suggest that EHPPL’s anti-inflammatory properties are likely due to its ability to inhibit NLRP3 inflammasome activation.
CONCLUSIONS
This study demonstrated that EHPPL significantly reduced inflammation in gout rats by decreasing pro-inflammatory cytokines, limiting inflammatory cell infiltration, and inhibiting NLRP3 inflammasome activation. Its anti-inflammatory effects were closely associated with the regulation of the NLRP3 inflammasome. However, further research is needed to fully elucidate the interactions between EHPPL, uric acid, oxidative stress, and the NLRP3 pathway. EHPPL shows promise as a dietary intervention for managing gouty arthritis.