ABBREVIATIONS
BB, bee bread; CC50, 50% cytotoxic concentration; GAE, gallic acid equivalent; IAV, influenza A virus; IC50, half maximal inhibitory concentration; MDCK, Madin-Darby canine kidney cells; MEM, minimal essential medium; MTT, 3-(4,5-dimethylthiazol-2-yl)-2,5-diphenyltetrazolium bromide; PBS, phosphate buffer saline; QE, quercetin equivalent; SDS, sodium dodecyl sulfate; TFC, total flavonoid content; TPC, total phenolic content; UPLC-HRMS, ultra-performance liquid chromatography–high-resolution mass spectrometry.
INTRODUCTION
Viral infections remain a constant and serious challenge to global health, playing a major role in both morbidity and mortality worldwide [Asma et al., 2022]. Despite considerable progress in modern medicine, the continuous emergence and re-emergence of viral pathogens, coupled with the ever-present risk of pandemics, underscore the urgent need for effective antiviral strategies [Márquez-Bandala et al., 2025]. Current antiviral therapies, while crucial, often face limitations such as the development of drug resistance and the potential for adverse side effects [Lam & Baumgarth, 2019]. This makes the exploration of alternative and complementary approaches essential, particularly those derived from natural sources, which may offer improved safety profiles and novel mechanisms of action.
Throughout history, diverse civilizations have utilized bee products, including honey, propolis, bee pollen, and bee bread, for their therapeutic properties, notably in the treatment of infections. This rich history of folk medicine has spurred a growing scientific interest in the bioactive compounds present in these bee-derived products and their potential health benefits [Asma et al., 2022]. Modern research aims to validate these traditional applications and to identify the specific components responsible for their observed effects.
Among these bee products, bee bread stands out as a particularly intriguing product. It is formed through a natural process within the honeycomb cells, where worker bees collect pollen from flowers and mix it with honey or nectar and their own salivary secretions [Bakour et al., 2022]. This mixture then undergoes fermentation, transforming it into bee bread. The resulting bee bread boasts a rich nutritional composition, including significant amounts of proteins, carbohydrates, lipids, amino acids, vitamins, and minerals [Aylanc et al., 2023; Ćirić et al., 2022]. Furthermore, bee bread contains a variety of bioactive compounds, such as polyphenols (mainly flavonoids), and enzymes, which presumably contribute to its therapeutic potential [Mărgăoan et al., 2019]. Besides being crucial in bee bread production, the fermentation process may also enhance bee bread bioavailability and bioactivity compared to bee pollen.
Bee products, including honey, propolis, bee venom or royal jelly, possess antiviral potential against DNA and RNA viruses. Their mechanism of action involves decreasing viral load, viral replication inhibition, reduction of DNA synthesis, or reduced adhesion to the host cells [Otręba et al., 2025]. Furthermore, the antiviral effects of bee products, such as honey and propolis, are primarily attributed to a diverse array of bioactive secondary metabolites, specifically phenolic compounds (flavonoids and phenolic acids), as well as specialized molecules like methylglyoxal and organic acids [Asma et al., 2022; Otręba et al., 2025]. Although other bee products, like honey and propolis, have been extensively studied in this context, research on the antiviral potential of bee bread remains relatively limited [Asma et al., 2022]. However, initial in vitro studies have provided evidence that bee bread may inhibit mammalian viruses, including influenza A virus [Asoutis Didaras et al., 2022; Dimitriou et al., 2023]. These initial findings provide a strong rationale for further investigation of the antiviral activity of bee bread, particularly against clinically important human pathogens, such as the influenza virus.
The main goal of this research was to explore the antiviral potential of eighteen bee bread samples derived from Polish apiaries against influenza A H1N1 virus. Its second aim was metabolomic analysis of bee bread extracts and an attempt to identify individual compounds or groups of compounds that are responsible for this antiviral effect.
MATERIALS AND METHODS
Chemicals, reagents, and cell cultures
All chemicals and reagents were purchased from commercial sources. Minimal essential medium supplemented with Earle’s balanced salts and fetal bovine serum was obtained from Biosera (France). Bradford reagent, phosphate buffer saline (PBS), sodium dodecyl sulfate (SDS), 3-(4,5-dimethylthiazol-2-yl)-2,5-diphenyltetrazolium bromide (MTT), TPCK trypsin, sodium nitrite, aluminum chloride, sodium hydroxide, quercetin, formic acid, and acetonitrile were bought from Merck (Darmstadt, Germany). Ethanol and HCl were bought from POCH (Gliwice, Poland). Syringe filters (0.22 μm, Millex) were purchased from Millipore (Billerica, MA, USA). Ultrapure water (18.0 MΩ) was produced using the Milli-Q Advantage A10 System (Millipore, Billerica, MA, USA). Madin-Darby canine kidney (MCDK) cells were obtained from Vircell (Granada, Spain), and the clinical influenza A H1N1 strain was provided by Dr. Nikolaos Siafakas (ATTIKON General University Hospital of Athens, Greece). M30F2/08 and M264R3/08 primers were obtained from Eurofins Genomics (Ebersberg, Germany), and FastGene Scriptase II from Nippon Genetics (Tokyo, Japan).
Sample preparation
The investigation of antiviral potential of bee bread included 18 samples (n=18) of dried polyfloral bee bread (BB) pellets derived from apiaries located in different regions of Poland (products were collected from 2020 to 2022). Sample identifiers (BB1–BB18) follow the original laboratory coding; numbers BB5 and BB12 were not assigned at the collection stage. All tested BB samples were firstly homogenized in a ceramic mortar. Extracts were prepared for MTT and antiviral assays according to the protocol described previously by Dimitriou et al. [2023]. The BB samples were suspended in a minimum essential medium (MEM) at a 1:10 ratio (w/w) and incubated for 1 h at ambient temperature. Afterwards, the mixtures were centrifuged (10,000×g, 10 min), and supernatants were filtered through 0.22 μm syringe filters. The obtained MEM extracts were stored at 4°C for further analysis.
For total phenolic content and total flavonoid content (TPC and TFC, respectively) determination, the BB samples were dissolved with MilliQ water in a 1:5 ratio (w/w) and incubated for 2 h on a rotary shaker at ambient temperature and 100 rpm. Subsequently, suspensions were centrifuged at 10,000 rpm (corresponding to approximately 8,400×g) for 10 min and filtered using 0.22 μm syringe filters. The obtained aqueous BB extracts were stored at 4°C for further analysis.
Cell viability assay
Cytotoxicity of the analyzed BB samples against MCDK cells was determined with the MTT colorimetric method [Asoutis Didaras et al., 2022]. The MCDK cells were seeded in the wells of 96-well plates in MEM supplemented with 2% fetal bovine serum followed by 24 h of incubation at 37°C. Afterwards, the MEM medium was removed, and 100 μL of each BB MEM extract were added into cells – the final concentrations of BB MEM extracts in the wells were in the range from 0.25 to 32 μL/mL. Subsequently, the Madin-Darby canine kidney (MDCK) cells treated with BB extracts were incubated for 24 h at 37°C. Then, 20 μL of an MTT solution (2.5 mg/mL) were added into each well, and the plates were incubated for 1 h at 37°C. MTT is converted into crystalline formazan as a result of the enzymatic reduction of the tetrazolium salt by mitochondrial dehydrogenases, yielding an insoluble product that precipitates within metabolically active cells. After incubation, 100 μL of the MTT solvent (10% SDS and 0.01 M HCl) were added into wells in order to dissolve the formed formazan crystals. The measurement was taken at 570 nm using a microplate reader.
Antiviral activity assay
Antiviral activity of BB against influenza A H1N1 virus was assessed with the cell culture assay following the protocol published previously [Dimitriou et al., 2023]. The MDCK cells and the dilutions of BB MEM extracts, ranging from 0.25 to 32 μL/mL, were prepared as described in the cell viability assay section. The virus stock of influenza A virus (IAV) in MEM was prepared in a 1:10 ratio (v/v) with the addition of 1 μg/mL of TPCK trypsin. Afterwards, the virus stock was mixed with BB MEM extracts in a 1:1 ratio (v/v). The positive control was virus stock mixed with MEM in a 1:1 ratio (v/v) and the negative control was just the MEM medium. Subsequently, all the mixtures were incubated for 1 h at 37°C. After incubation, the medium was removed from 96-well plates containing MCDK cells, and 200 μL of the prepared mixtures (virus stock with BB extracts, positive and negative control) were added into the wells. All samples were tested in triplicate. The plates containing BB extracts and both negative and positive controls were incubated at 37°C and examined daily for the development of cytopathic effect (CPE). Afterwards, the plates were stored at −80°C for further analysis.
RNA extraction was performed to isolate the viral RNA from infected MDCK cell cultures after exposure to the analyzed extracts [Dimitriou et al., 2023]. Because influenza A is an RNA virus, extracting its genome is essential for downstream quantification. Real-time PCR targeting the M gene of the virus was then used to measure the remaining viral RNA copies, thereby indicating how strongly each sample of BB extract inhibited viral replication or directly inactivated the virus. A reverse transcription assay was performed using an M30F2/08 primer targeting the M gene segment 5’-ATGAGYCTTYTAACCGAGGTCGAAACG-3’ (Eurofins Genomics) and FastGene Scriptase II (Nippon Genetics) according to the manufacturer’s protocol. The synthesized cDNA was stored at −80°C for further analysis.
Antiviral activity was determined by comparative real-time PCR according to protocols provided in earlier works [Asoutis Didaras et al., 2022; Dimitriou et al., 2023]. The relative concentration of viral titer in MCDK cells incubated with different concentrations of BB extracts compared to the viral titer in the control sample (MCDK cells incubated with the virus without any supplementation with BB extract) was calculated targeting the M gene segment M30F2/08 5’-ATGAGYCTTYTAACCGAGGTCGAAACG-3’//M264R3/08 5’-TGGACAAANCGTCTACGCTGCAG-3’ [Eisfeld et al., 2014]. The comparative real-time PCR was conducted using an Eco48 instrument (PCRmax, Staffordshire, United Kingdom) according to the following protocol: 95°C for 2 min, 40 cycles of 95°C for 5 s and 60°C for 30 s followed by a melting curve analysis step. Cycle threshold (Ct) values were used to calculate the relative concentration as a means of 2-ΔCt (Control-Sample), according to EcoStudy (PCRMax).
Calculation of cytotoxicity concentration, half maximal inhibitory concentration, and selectivity index
In this study, the MTT assay was used to calculate cytotoxicity concentration (CC50) of the analyzed BB extracts against MDCK cells. CC50 is the concentration of the agent (in this case: BB extracts) that reduces the uninfected cell viability by 50% [Cavalli et al., 2012]. The absorbance values obtained for each concentration of BB extracts were normalized to the untreated cell control. A dose–response curve was generated by plotting sample concentration against the percentage of viable cells (GraphPad Prism 10, GraphPad Software, Inc., La Jolla, CA, USA), and the CC₅₀ value was defined as the concentration that reduced cell viability to 50% of the control.
For the estimation of the antiviral potential of BB extracts, the calculation of the half maximal inhibitory concentration (IC50) was used, and it is a measure of the effectiveness of a compound in inhibiting biological/biochemical function [Hendriks, 2010]. The IC₅₀ was determined on the basis of quantitative real-time PCR data. The relative amount of viral RNA in each condition was calculated in comparison to the positive control. Dose–response curves were then generated in GraphPad Prism 10 (GraphPad Software) by plotting sample concentration against the percentage reduction in viral RNA levels. The IC₅₀ value was defined as the concentration of the sample that produced a 50% decrease in viral RNA quantity relative to the untreated virus control.
The selectivity index (SI), defined as the ratio of cytotoxicity to antiviral activity [McGaw et al., 2014], was calculated considering both CC50 and IC50.
Total phenolic content and total flavonoid content determination
The total phenolic content (TPC) of the BB aqueous extracts was quantified using the Folin–Ciocalteu method, following the protocol described previously [Pełka et al., 2021] with small modifications. Briefly, 50 μL of the Folin–Ciocalteu reagent, diluted at 1:10 (v/v) with deionized ultrapure water, were combined with 10 μL of the BB aqueous extract. After 5-min incubation, 40 μL of a 7.5% sodium carbonate solution (Na2CO3) were added, followed by 100 μL of ultrapure water to obtain the final reaction volume of 200 μL. The mixture was incubated for 30 min at ambient temperature, and, subsequently, absorbance was measured at 725 nm using a microplate reader (TECAN Spark 10M, Grödig, Austria). The calibration curve was plotted with fresh gallic acid standard solutions in the range of concentrations from 0 to 2.0 mg/mL. The TPC in BB aqueous extracts was expressed as mg of gallic acid equivalent (GAE) per g of the product. All measurements were conducted in triplicate.
The total flavonoid content (TFC) was determined using a modified version of the method reported previously [Gull et al., 2018]. Briefly, 125 μL of distilled water were dispensed in the wells of a 96 well-plate and mixed with 25 μL of BB aqueous extracts and 10 μL of 5% NaNO2. After 5 min of incubation at room temperature, 15 μL of 10% AlCl3 were added, and the plate was incubated 30 min at ambient temperature in the dark. After incubation, 50 μL of 1M NaOH were added. Subsequently, absorbance was read at 510 nm using a microplate reader (TECAN Spark 10M). TFC was calculated using a quercetin calibration curve (concentration of quercetin from 0 to 1.0 mg/mL), and results were expressed as mg of quercetin equivalent (QE) per g of the product. All measurements were performed in triplicate.
Metabolomic analysis using ultra-performance liquid chromatography–high-resolution mass spectrometry
Ultra-performance liquid chromatography–high-resolution mass spectrometry (UPLC-HRMS) analysis enabled the comprehensive profiling and tentative identification of compounds of diverse classes in bee bread based on their chromatographic behavior, accurate precursor ion masses, and characteristic fragmentation patterns. The gathered tandem mass spectrometry (MS/MS) data were compared with reference fragmentation patterns, exact masses, and structural annotations available in the Human Metabolome Database (HMDB), PubChem, and previously published literature which provided spectral libraries, reported MS/MS data, and structural information necessary for tentative compound identification.
Aqueous extracts were prepared by suspending raw bee bread material in MilliQ water at a ratio corresponding to 200 mg of the starting material per mL of the solvent (w/v). The suspensions were vortexed, allowed to extract, and the soluble fraction was collected after filtration through 0.22 μm syringe filters. The filtrates were subsequently analyzed using the UPLC-HRMS technique as described in a previous work with small modifications [Litewski et al., 2024]. A quality control (QC) sample was prepared by combining equal aliquots of all bee bread extracts included in the study. The QC mixture was processed and analyzed in the same manner as the individual samples. QC injections were used to monitor UPLC-HRMS system stability, assess analytical reproducibility, and support data normalization during metabolomic analysis. The UltiMate 3000 UHPLC system by Thermo Scientific Dionex (Waltham, MA, USA) composed of a quaternary pump, a well plate autosampler, a column compartment equipped with a 100 Å Luna Omega Polar C18 column (150×2.1 mm, 1.6 μm, Phenomenex, Torrance, CA, USA), and a diode array detector was used. It was coupled with a high-resolution Thermo Q-ExactiveTM Focus quadrupole-Orbitrap mass spectrometer, manufactured by Thermo (Bremen, Germany). The entire chromatographic system was managed using Chromeleon 7.2.8 software from Thermo Fisher Scientific (Waltham, MA, USA).
The chromatographic separation was performed using a mobile phase consisting of (A) water acidified with formic acid (0.1%, v/v) and (B) acetonitrile acidified with formic acid (0.1%, v/v). The system operated at a constant flow rate of 0.3 mL/min. The gradient elution began at 5% solvent B and increased linearly to 25% B over the first 5 min. It then continued to rise gradually, reaching 50% B at 18 min, followed by a rapid increase to 80% B at 19 min. The gradient then progressed to 100% B by the 25 min and was held constant at this level until 30 min. The initial mobile phase was run for 7 min to condition the column. The injection volume of the samples was 4 μL. The analytes were ionized using heated electrospray ionization (HESI) operated in both positive and negative ion modes. The sheath, auxiliary, and sweep gas flow rates were set to 35, 15, and 3 bar, respectively. Ionization was performed with a spray voltage of 2.5 kV, and the S-lens radio frequency (RF) level was maintained at 50. The capillary temperature was adjusted to 350°C, while the heater was set to 300°C. For the full mass spectrometry (MS) scan, the mass range covered 120 to 1,200 m/z with a resolution of 70,000 full width at half maximum (FWHM). The automatic gain control (AGC) target was 2×10⁵, and the maximum injection time was 100 ms. MS2 parameters included a resolution of 17,500 FWHM, an isolation window of 3 m/z, a collision energy of 30 eV, an AGC target of 1×10⁶, and a maximum injection time of 100 ms. Data processing was performed using Compound Discoverer 3.3 software (Thermo Fisher Scientific) and Freestyle 1.3 software (Thermo Fisher Scientific). Compound identification was performed using the Compound Discoverer 3.3 workflow, which included accurate mass matching, isotopic pattern evaluation, and MS/MS fragmentation pattern comparison against spectral libraries (mzCloud and ChemSpider). Putative identifications were assigned based on mass accuracy, retention time behavior, and fragmentation similarity.
Statistical analysis
The presented data are shown as the means and standard deviation (SD) derived from three measurements. The Shapiro-Wilk test of normality was used to determine data distribution. One-way ANOVA (α=0.05) was run separately on TPC and TFC to assess total variance, followed by pairwise comparisons using Tukey’s honestly significant difference (HSD) test. Statistical groupings were derived using a custom compact letter display approach based on non-significant Tukey comparisons (p≥0.05), assigning alphabetical labels in descending mean order. Statistical analysis of TPC and TFC results was conducted by Python (version 3.13.5, Python Software Foundation, Wilmington, DE, USA) with stats model package (version 0.14.5, NumFOCUS, Austin, TX, USA). A correlation analysis was performed to investigate the associations among cytotoxicity (CC₅₀), antiviral activity (IC₅₀), selectivity index (SI), and phytochemical parameters (TPC and TFC). Because the data were not normally distributed, non-parametric Spearman rank correlation coefficients (rs) were employed to evaluate monotonic relationships between the measured parameters. Corresponding p-values were calculated to determine the statistical significance of each correlation. All analyses were conducted using two-tailed tests. Statistical analysis of the metabolomics data was conducted using MetaboAnalyst 6.0 (https://www.metaboanalyst.ca, accessed on June 11, 2025). Principal component analysis (PCA) was performed to assess overall variation in the data and to visualize clustering patterns among the sample groups. Differential metabolite analysis between the samples showing the greatest variation in biological activity was performed based on a log2 fold change (FC)≥2. A significance threshold of p≤0.1 was applied to distinguish differential metabolites from non-significant ones.
RESULTS AND DISCUSSION
Antiviral potency of bee bread extracts
The cell viability assay with the use of an MTT dye was performed to estimate the toxicity level of BB MEM extracts on MCDK cells. The cytotoxicity was expressed as CC50 and varied from 1.33 to 15.97 μL/mL for all tested samples (Table 1). The least toxic BB sample was BB20 (15.97 μL/mL) followed by BB3 (11.80 μL/mL).
Table 1
Antiviral profile (CC50, IC50, and SI values) of bee bread (BB) aqueous extracts.
The results obtained after comparative real-time PCR revealed a decreasing copy number of IAV H1N1 after the treatment with the BB MEM extracts. The half minimum inhibitory concentration (IC50) of the samples that exhibited antiviral activity was in the range from 0.13 μL/mL (BB13) to 1.09 μL/mL (BB7 and BB15). The IC50 values differed among the tested BB samples, indicating that the antiviral activity of BB might depend on the botanical origin and/or the chemical composition of BB.
The calculation of selectivity index (SI) was performed taking into consideration both CC50 and IC50 values. According to Cavalli et al. [2012], higher SI values indicate a safer and more effective sample. The SI values were between 2.13 and 47.68, thus they were highly variable (over 20-fold). However, four samples revealed SI values higher than 20 meaning that the IC50 value was more than 20 times lower than the corresponding CC50 value. These findings provide evidence supporting the antiviral activity of BB. Due to the limited number of studies on the antiviral properties of bee bread, assessing accurately its effectiveness against influenza remains challenging. Nevertheless, all the SIs calculated for BB extracts in this study are comparable with the SI values obtained for aqueous extracts of BB presented by Dimitriou et al. [2023]. Antiviral activity of other bee products, such as honey, propolis or bee venom, has been described well. These products act through several mechanisms, such as blocking viral entry, inhibiting replication, providing direct virucidal effects, and stimulating the host’s immune response [Asma et al., 2022]. For honey, IC50 values ranged from 3.2 mg/mL (Manuka honey) to 11.3 mg/mL (range honey) with SI values from 22.9 to 7.1, respectively [Otręba et al., 2025]. Honey demonstrates potent anti-influenza activity by directly deactivating viral particles before infection and utilizing bioactive metabolites, like flavonoids and phenolic acids, to block viral attachment and entry into host cells [Otręba et al., 2025]. Furthermore, specialized components, such as methylglyoxal, inhibit the assembly and maturation of new virions, while the product’s low pH and high osmolality provide a physicochemical barrier that suppresses viral replication [Kontogiannis et al., 2022]. In the case of propolis, this apicultural product exhibits notable antiviral activity against influenza A virus, with reported IC50 values ranging from 19.5 to 111.6 μg/mL [Otręba et al., 2025]. Its antiviral mechanism involves the inhibition of viral adsorption and entry into host cells, coupled with the suppression of intracellular replication through the downregulation of viral mRNA synthesis. Additionally, specific secondary metabolites, such as 3,4-dicaffeoylquinic acid, confer indirect antiviral protection by modulating host immune responses, including the upregulation of TRAIL expression to promote the elimination of infected cells and the enhancement of protective antibody titers [Asma et al., 2022]. These findings position bee bread within the broader spectrum of antiviral bee products, suggesting that its bioactivity may follow similar mechanistic patterns. Although the potency varies among samples, the overall antiviral profile of BB aligns with the established antiviral potential observed for other bee products.
Total phenolic and total flavonoid contents of bee breads
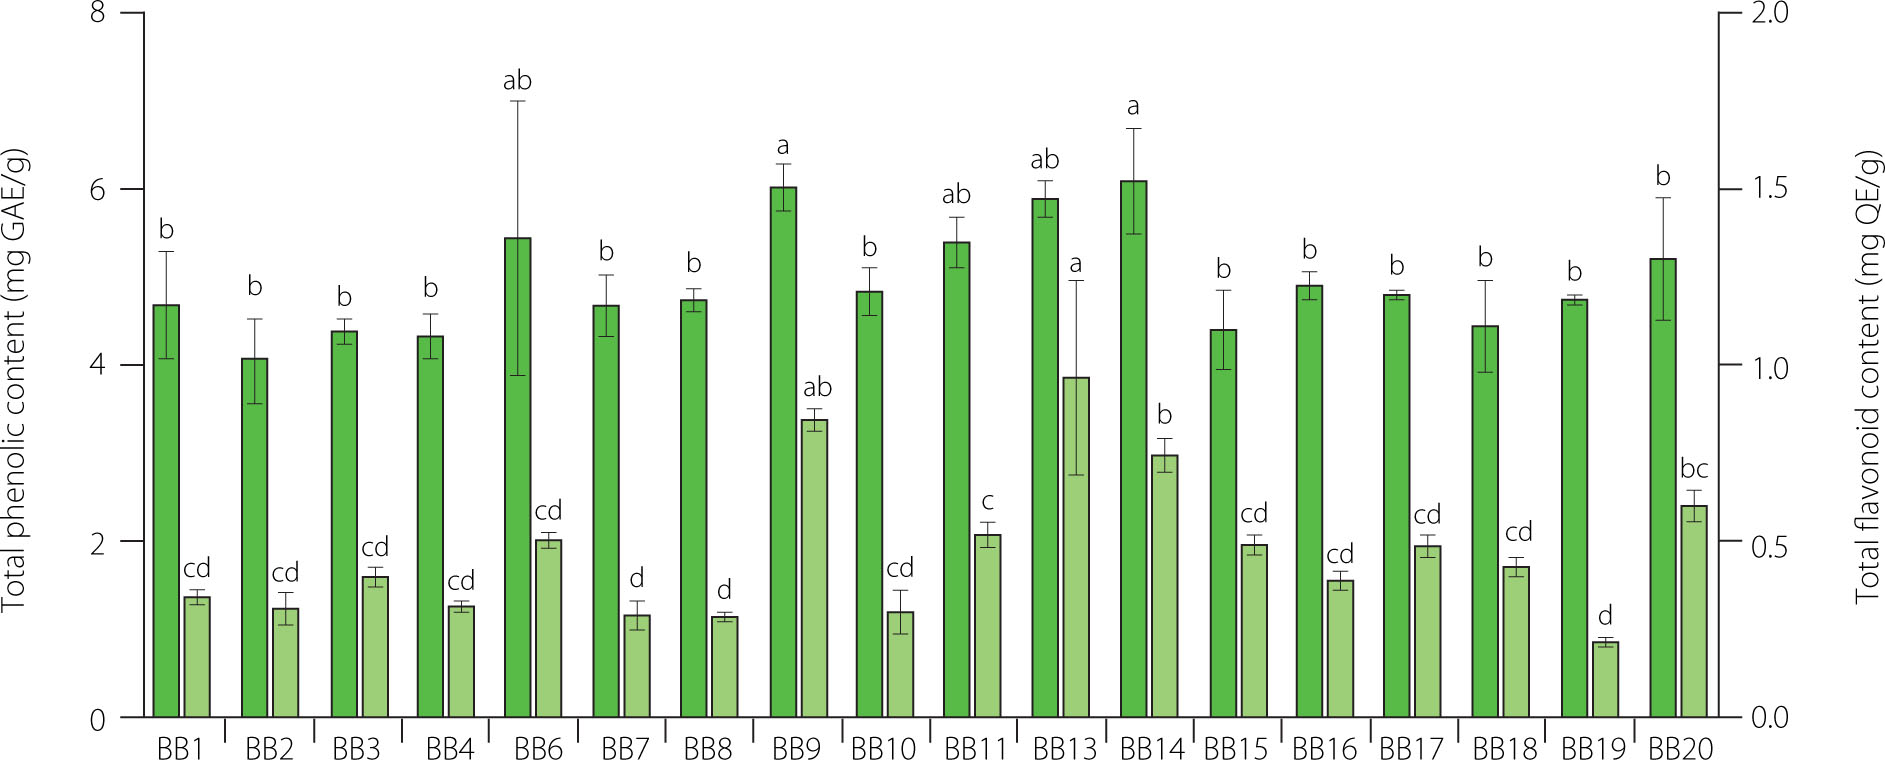
Phenolic compounds, including flavonoids, exhibit health-promoting potential, including anti-inflammatory, anti-cancer, and antimicrobial activities [Stachelska et al., 2025]. Flavonoids are a group of phenolic compounds that are widely present in bee products, including bee bread. In this research, TPC of BB ranged from 4.08 to 6.10 mg GAE/g, and TFC was in the range from 0.22 to 0.97 mg QE/g (Figure 1). In our previous work, TPC values varied from 16.88 to 20.18 mg GAE/g; however, it involved ethanolic extracts of bee bread [Pełka et al., 2021]. The study of Mohammed et al. [2022] proved that 70% ethanol was the best solvent for the extraction of phenolic compounds. Nevertheless, despite its lower extraction efficiency, water is non-toxic and, hence, is considered a safer alternative to ethanol, particularly in the context of antiviral activity. Concerning the TFC, in the study of Sawicki et al. [2022], bee bread methanolic extracts contained approximately 5 mg of QE/mL. What is more, Mayda et al. [2020] presented data on the total flavonoid content ranging from 1.81 to 3.74 mg of QE/g BB, depending on botanical origin. Nevertheless, TFC of BB can be highly variable, as reported for BB collected in Romania, which was lower, between 0.45 to 1.86 mg QE/g [Ilie et al., 2024]. This difference between samples might be attributed to diverse botanical origin and extraction methods.
Figure 1
Total phenolic and total flavonoid content of bee breads (BB). The results are presented as mean (n=3). Error bars represent standard deviation. Different lowercase letters above each bar denote significant differences among samples according to Tukey’s honestly significant difference post-hoc test at p<0.05. GAE, gallic acid equivalent; QE, quercetin equivalent.
A correlation analysis was performed to further explore potential relationships among cytotoxicity, antiviral activity, selectivity index, and the phytochemical characteristics of the extracts (TPC and TFC), Because the Shapiro–Wilk test indicated that the variables did not follow a normal distribution, non-parametric Spearman rank correlation coefficients (rs) were applied. The analysis revealed a significant negative correlation between IC₅₀ and SI (rs=−0.6636, p=0.0034), as well as IC50 and CC50 (rs=0.1806, p=0.4709), demonstrating that the extracts with stronger antiviral potential (lower IC₅₀ values) were associated with higher selectivity indexes and that the antiviral activity of the extracts was not driven by cytotoxicity. No statistically significant correlations (p>0.05) were observed between IC₅₀, or SI and the TPC or TFC, suggesting that the antiviral and cytotoxic properties of the extracts were not directly dependent on their phenolic content within the tested range. Although phenolics are often highlighted as key contributors to the bioactivity of bee-derived products, bee bread is known to possess a far more diverse profile of bioactive compounds. Its fermentation process and mixed botanical origin generate a complex matrix enriched not only in phenolics but also in peptides, amino acids, lipids, carbohydrates, and various secondary metabolites [Bakour et al., 2022; Ćirić et al., 2022]. Due to its chemical diversity, it is likely that the antiviral activity results from the combined or interacting effects of multiple metabolite classes rather than being driven solely by phenolic compounds. Because TPC and TFC obtained through colorimetric assays offer only broad approximations of the total phenolic and total flavonoid content, they do not provide insight into the specific compounds present. Therefore, a more detailed characterization of the extracts by UPLC-HRMS was performed.
Chemical composition of bee bread aqueous extracts
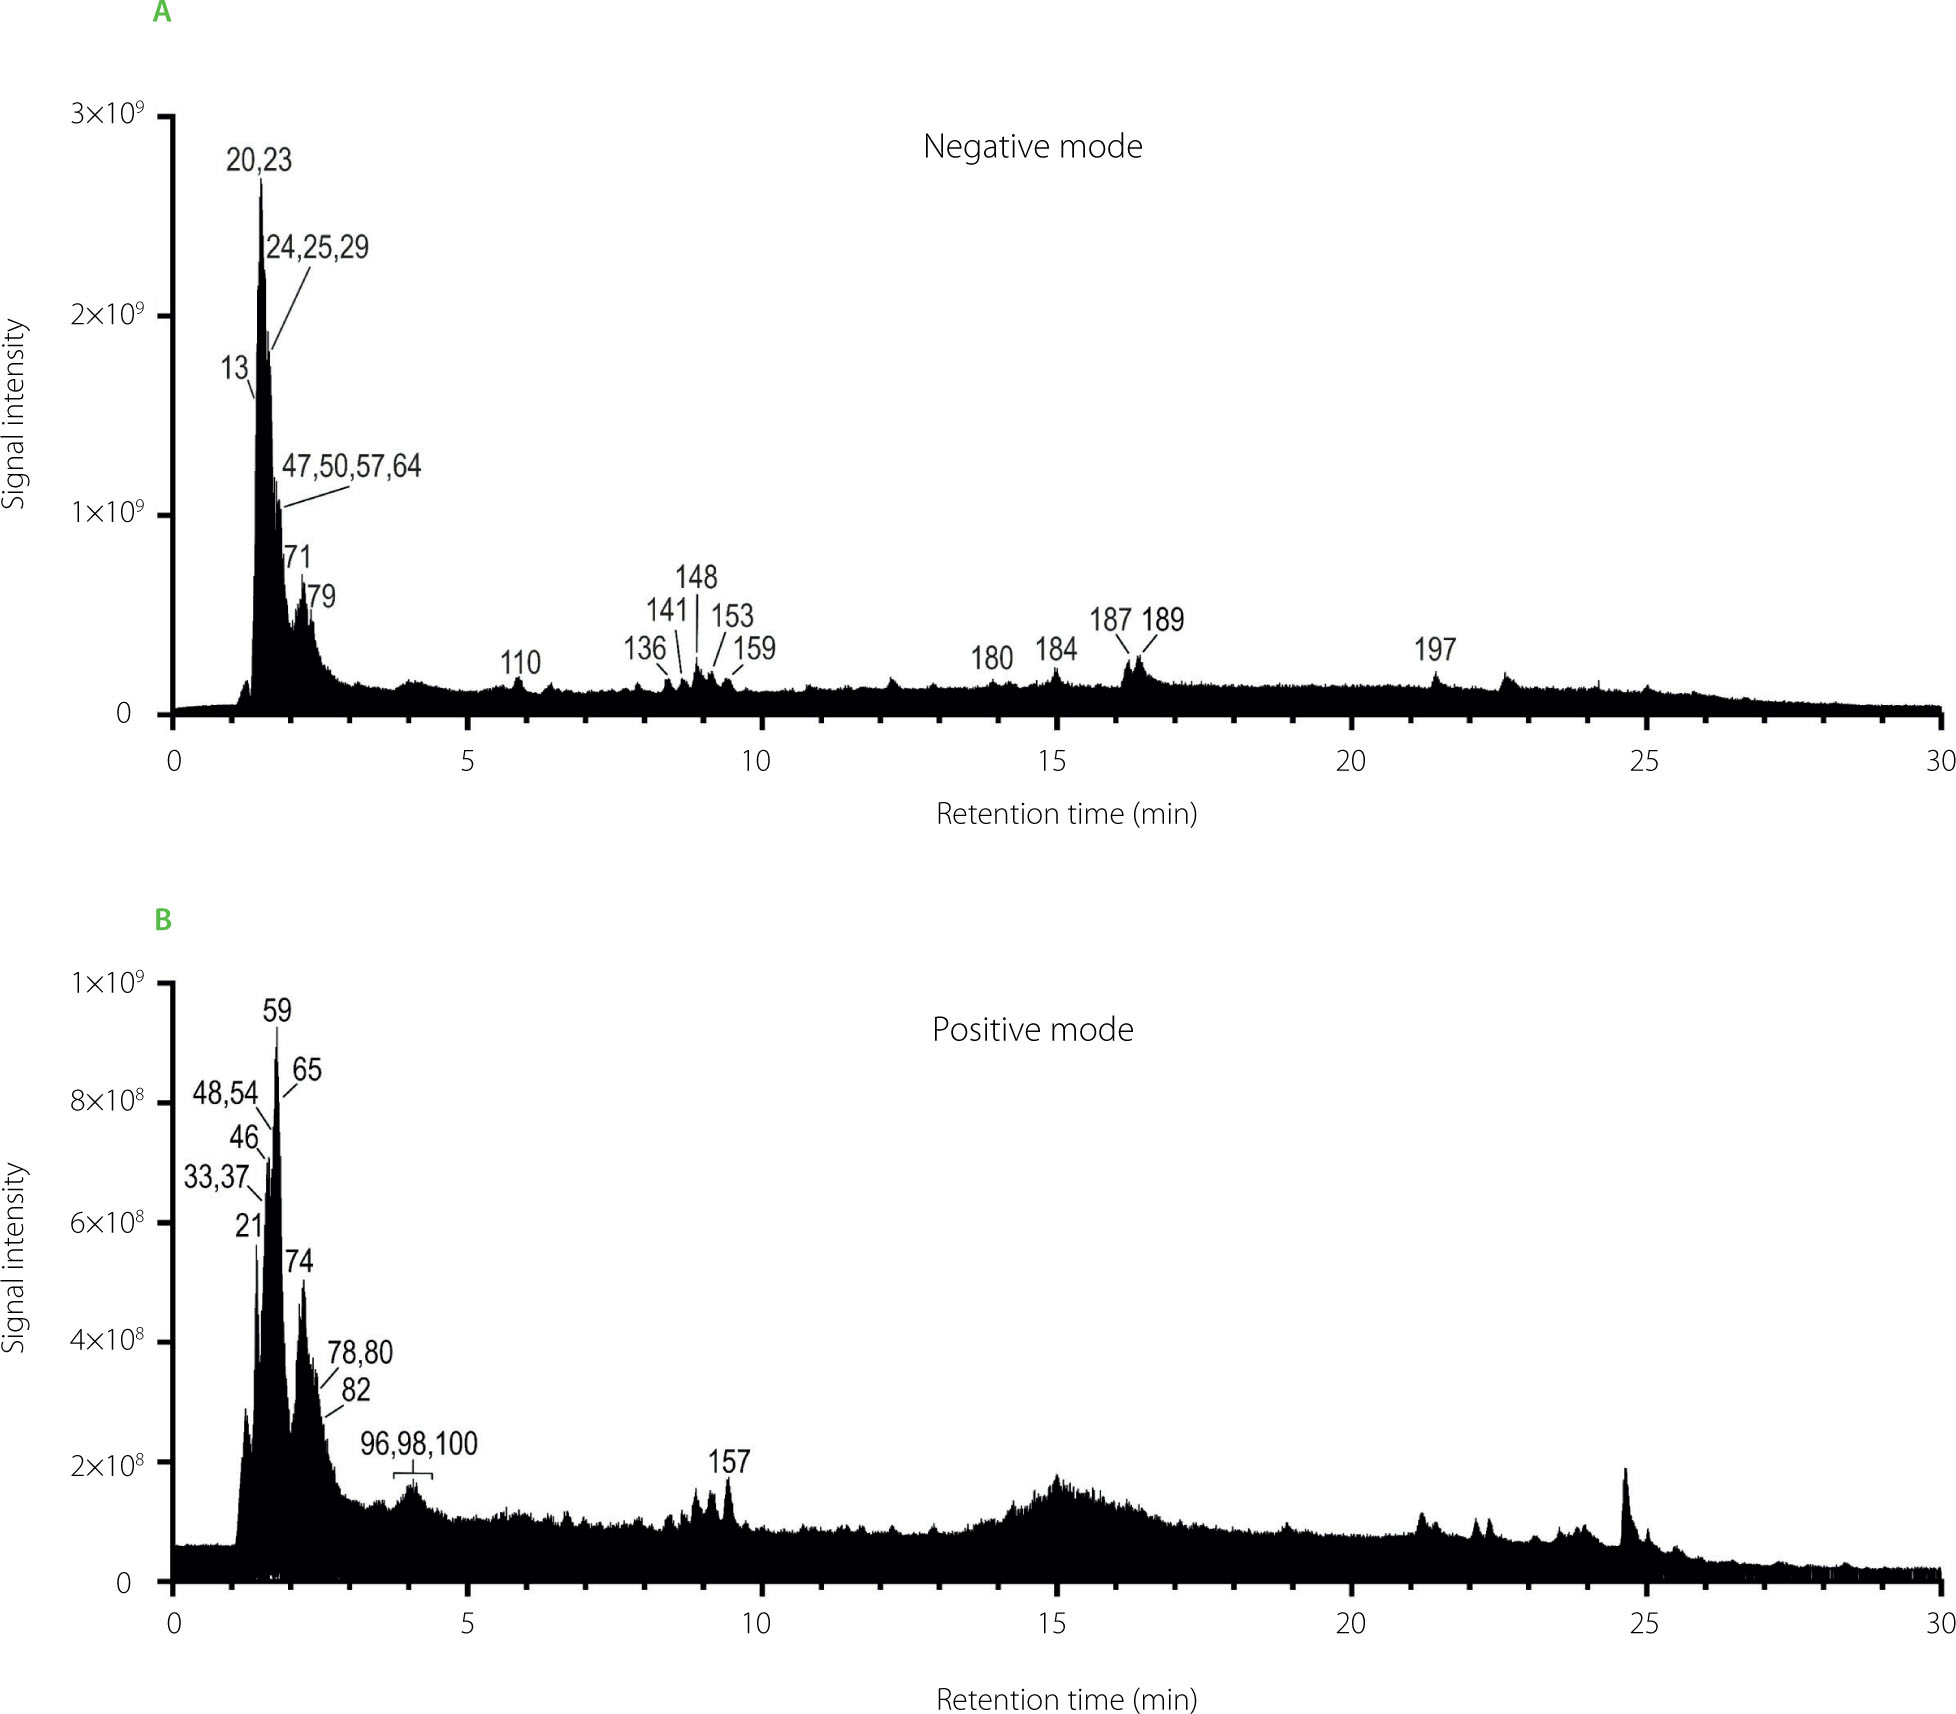
This analytical approach facilitated the annotation of 218 metabolites in BB aqueous extracts analyzed in both negative and positive ionization, that were classified into ten principal categories. These included 45 flavonoids; 39 amino acids, peptides and analogs; 33 carbohydrates and carbohydrate conjugates; 33 lipids; 22 phenylpropanoids and derivatives; 13 nucleic acid components; 11 organoheterocyclic compounds; 8 alkaloids and their derivatives; 5 carboxylic acids; and 9 other compounds (Figure 2). Representative total ion chromatograms (TICs) of the pooled QC sample, acquired in both ionization modes, are shown in Figure 3, illustrating the overall complexity of the analyzed BB extracts. Detailed annotations, including retention time, formula, mass error, diagnostic fragment ions and relative abundances, are summarized in Table S1 in Supplementary Materials.
Figure 2
A sunburst plot showing the classification of the bee bread metabolites tentatively identified by ultra-performance liquid chromatography–high-resolution mass spectrometry (UPLC-HRMS) analysis. Refer to Table S1 in Supplementary Materials for the full information on the metabolites shown in this plot.
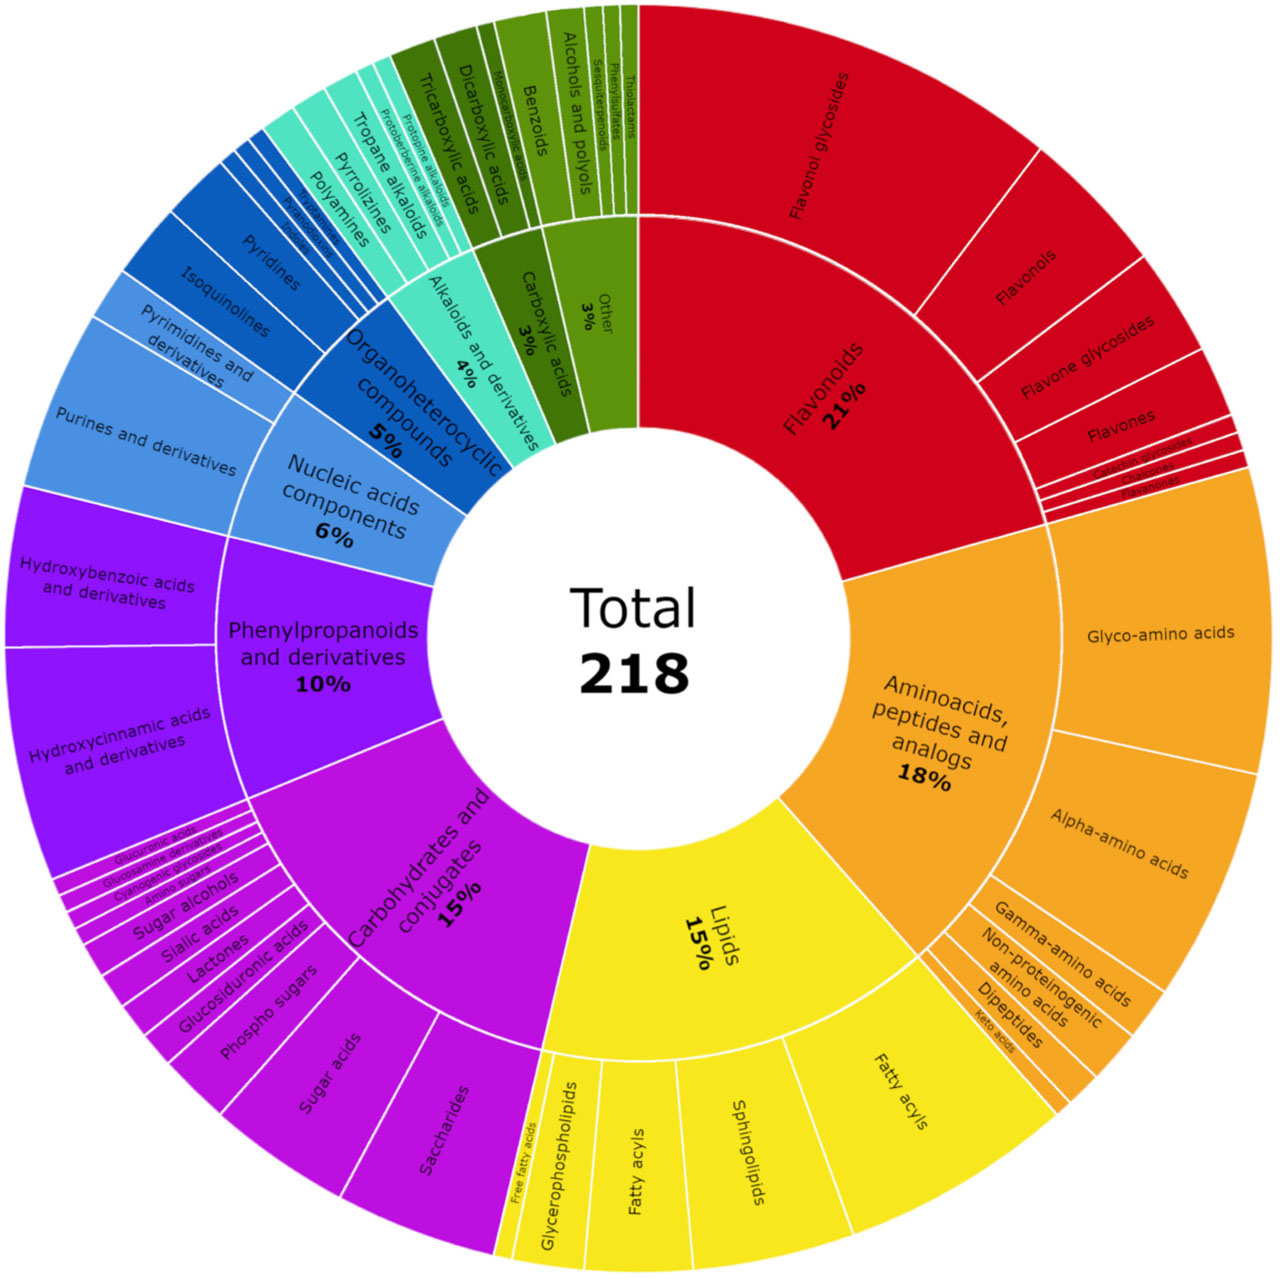
Figure 3
Total ion chromatograms (TICs) of the pooled quality control (QC) sample of bee bread extracts acquired in a negative ion mode (A) and a positive ion mode (B). For peak identities, see Table S1 in Supplementary Materials.
Flavonoid glycosides, particularly derivatives of kaempferol, quercetin, isorhamnetin, and myricetin, were the most prevalent in bee bread (Figure 2, Table S1), which is consistent with findings reported by Bakour et al. [2019]. Their identification was based on aglycone [M−H]– ions (m/z 285.04, 301.03, 315.05, and 317.02, respectively) and diagnostic neutral losses of sugar moieties. Kaempferol was identified as the most abundant flavonoid in the majority of the analyzed bee bread extracts and was highlighted by Ilie et al. [2024], together with quercetin and caffeic acid, as one of the key contributors to the antimicrobial activity of bee bread. Phenylpropanoids and derivatives identified in bee bread comprised simple phenolic acids, their glycosylated derivatives, and various polyamine conjugates. Caffeic, p-coumaric, ferulic, vanillic, protocatechuic, gentisic, salicylic, and 4-hydroxybenzoic acids were annotated from their [M−H]– ions and typical decarboxylation and demethylation fragments, while glycosylated forms showed neutral loss of hexose units. Polyamine conjugates bearing caffeoyl, feruloyl, or coumaroyl residues produced fragment ions corresponding to putrescine or spermidine backbones. These phenolamides, which have been reported in bee products, are increasingly recognized for their antioxidant and anti-inflammatory potential [Qiao et al., 2023; Zhang et al., 2025].
Another major group of metabolites identified in bee bread consisted of amino acids, peptides, and their analogues (Figure 2, Table S1). During fermentation, pollen proteins undergo enzymatic and microbial transformation into more bioavailable forms, resulting in elevated levels of free amino acids and short peptides. Specific amino acids, such as tryptophan and arginine, have been proposed as indicators of the botanical origin of the pollen, while the overall amino acid profile can offer insights into the geographical origin of bee bread [Bakour et al., 2022]. In the analyzed bee bread extracts, the most intense signals corresponded to N-(1-deoxy-1-fructosyl) derivatives – Amadori rearrangement products (ARPs) – which are key intermediates formed during the early stages of the Maillard reaction. Although ARPs are rarely found in nature without thermal processing, they are commonly detected in bee products. In honey, for example, their levels have been reported to gradually increase during storage [Yan et al., 2023]. Several free amino acids were annotated based on the typical neutral losses (e.g., H2O, NH3, COOH), ammonium ions, or side-chain-specific fragment ions. The most intense signals were observed for isoleucine and phenylalanine, both being essential amino acids, which is consistent with previous reports indicating that essential amino acids constitute a major part of the bee bread amino acid pool [Urcan et al., 2021].
Lipids identified in bee bread included glycerophospholipids, sphingolipids, fatty acid derivatives, and acylcarnitines (Figure 2, Table S1). Sphinganine, sphingosine, phytosphingosine, and ceramides with varying acyl chain lengths were detected, suggesting active lipid remodeling and potential microbial or enzymatic transformations during pollen fermentation. Glycerophosphocholine, a common phospholipid in bee products and previously reported in bee bread [Darwish et al., 2022], was confirmed by the diagnostic phosphocholine fragment ion at m/z 184.07, while glycerophosphoinositol and related phospholipids were identified from characteristic headgroup and fatty acyl ions. Linoleic acid, one of the major fatty acids in bee bread [Kaplan et al., 2016], together with its hydroxy- and hydroperoxy-derivatives (e.g., 9,10-DiHODE, 15,16-DiHODE, 9-HPODE), reflected both the high polyunsaturated fatty acid content and oxidative/enzymatic transformations occurring during fermentation and storage. These lipid species are nutritionally relevant and may contribute to the anti-inflammatory and cardioprotective potential attributed to bee bread [Bakour et al., 2022]. Carbohydrates represent another major class of metabolites in bee bread, including simple sugars, sugar alcohols, sugar acids, and numerous phosphorylated saccharides (Figure 2, Table S1). Phosphorylated derivatives, such as mannose phosphate, glucose 1-phosphate, and bisphosphorylated hexoses (d-glucose 2,6-bisphosphate, d-fructose 2,6-bisphosphate), were identified from sequential phosphate losses and diagnostic phosphate fragments, reflecting active carbohydrate metabolism in the bee bread matrix.
Gluconic acid, a product of glucose oxidation by glucose oxidase and a representative of the sugar acids class, was the most abundant compound detected across all analyzed bee bread extracts (Table S1), which is consistent with findings from previous reports on bee products [Aksoy et al., 2024]. Its predominance is biologically relevant, as it is a primary contributor to the acidic pH of bee bread, which plays a key role in its antimicrobial and preservative properties through direct pH reduction and synergistic interactions with hydrogen peroxide and phenolic compounds [Çelik et al., 2022]. Several other sugar acids, including arabinonic, galactaric, glucuronic, and tartaric acids, were also annotated. Low-molecular-weight organic acids, such as malic, quinic, isocitric, and citric acids, commonly reported in bee products, were detected alongside methylsuccinic acid, a methylated derivative of succinic acid not previously described in bee bread. In contrast, acetic, lactic, succinic, and oxalic acids were not detected, due to the mass cutoff of 120 Da applied in the analytical method, rather than their actual absence in the bee bread matrix. Notably, the organic acid profile of bee products remains understudied despite its potential as a quality and authenticity marker [Aksoy et al., 2024; Çelik et al., 2022].
Metabolomic analysis of bee bread extracts
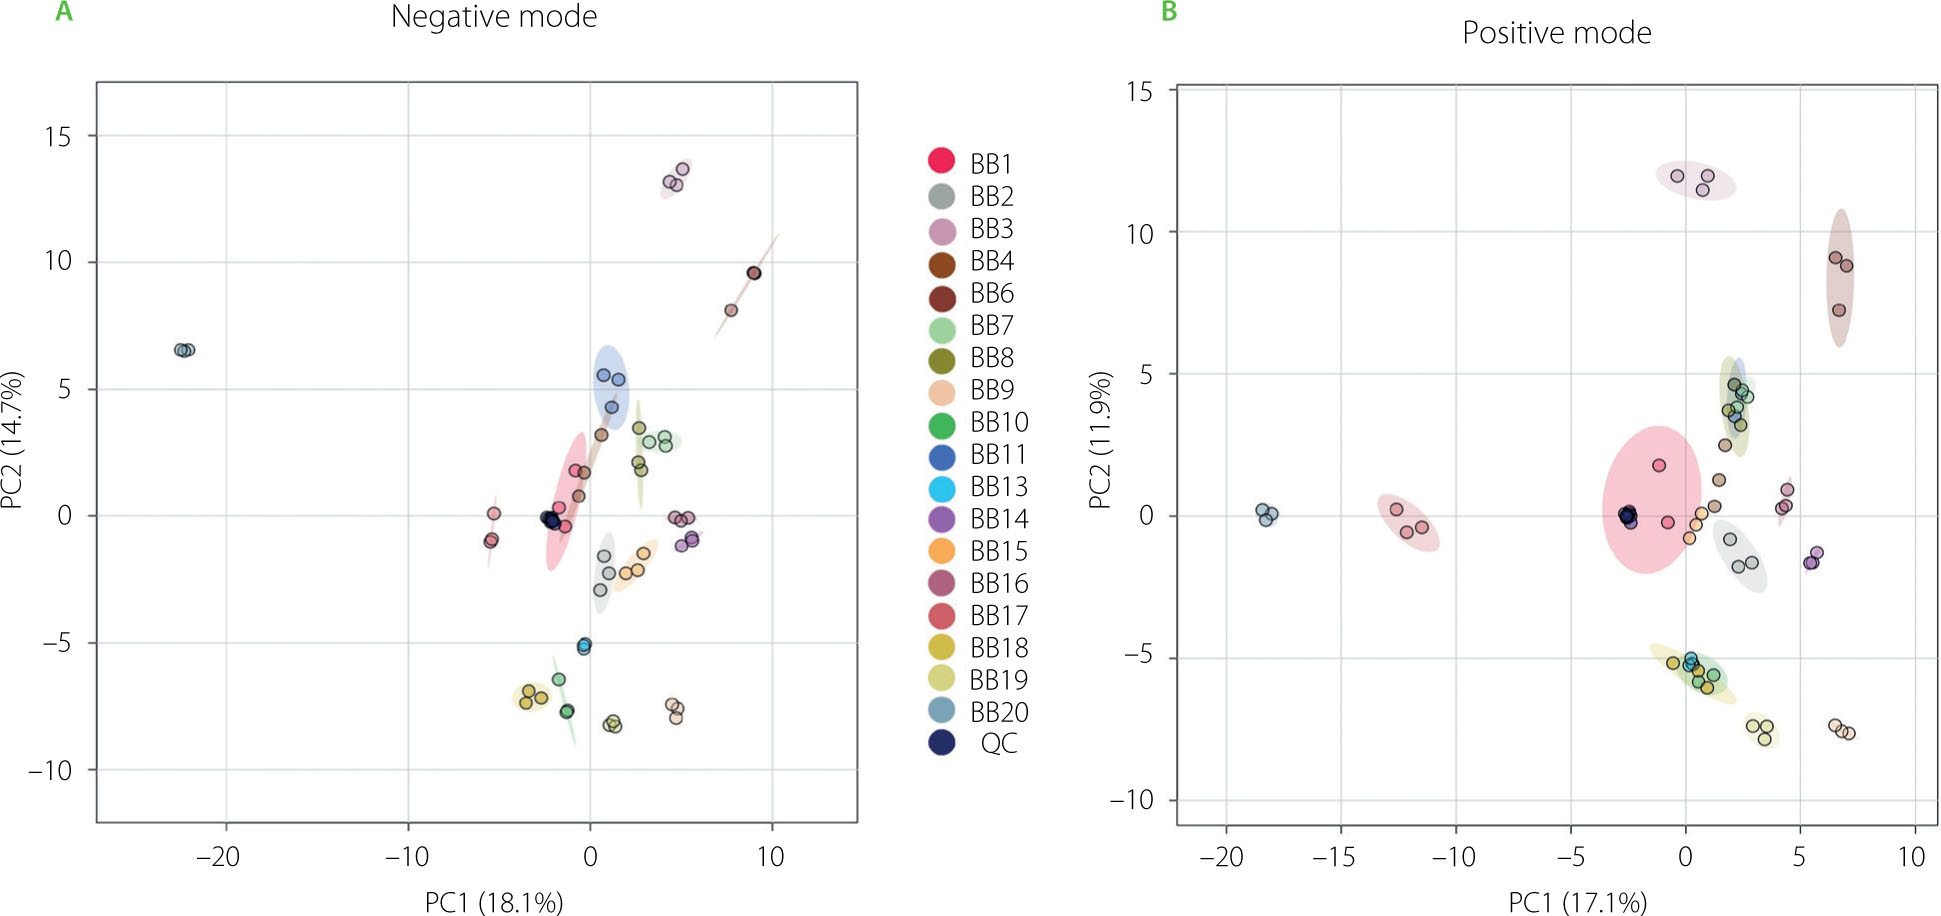
Principal component analysis was used to visualize the variation in metabolomic profiles between the studied bee bread samples (Figure 4). In the negative mode, the first principal component (PC1) explained 18.1% of the total variance, while the second component (PC2) accounted for 14.7% of the total variance. In the positive mode, PC1 and PC2 explained 17.1% and 11.9% of the total variance, respectively. In both modes, the QC sample was clustered tightly near the center of the plot, indicating good reproducibility of the measurements and overall analytical stability of the UPLC-HRMS system. The sample located furthest to the left on both the negative and positive mode PCA (BB20) was most distinct from all other samples in terms of its overall metabolomic profile. This pronounced separation suggests that BB20 possesses unique metabolic characteristics, encouraging further investigation into the factors contributing to its divergence from the other samples. Other groups also formed well-defined clusters, but were positioned closer to the center, which suggests that their profiles are more similar to the overall dataset average. The limited overlap between clusters highlights that PCA effectively distinguishes the metabolomic profiles of the groups of compounds. This separation implies that the underlying metabolic differences between groups are substantial enough to be captured by the first two principal components.
Figure 4
Results of principal component analysis (PCA) of the bee bread (BB) metabolomic data gathered from ultra-performance liquid chromatography–high-resolution mass spectrometry (UPLC-HRMS) analysis in a negative (A) and a positive ionization mode (B). QC, quality control sample.
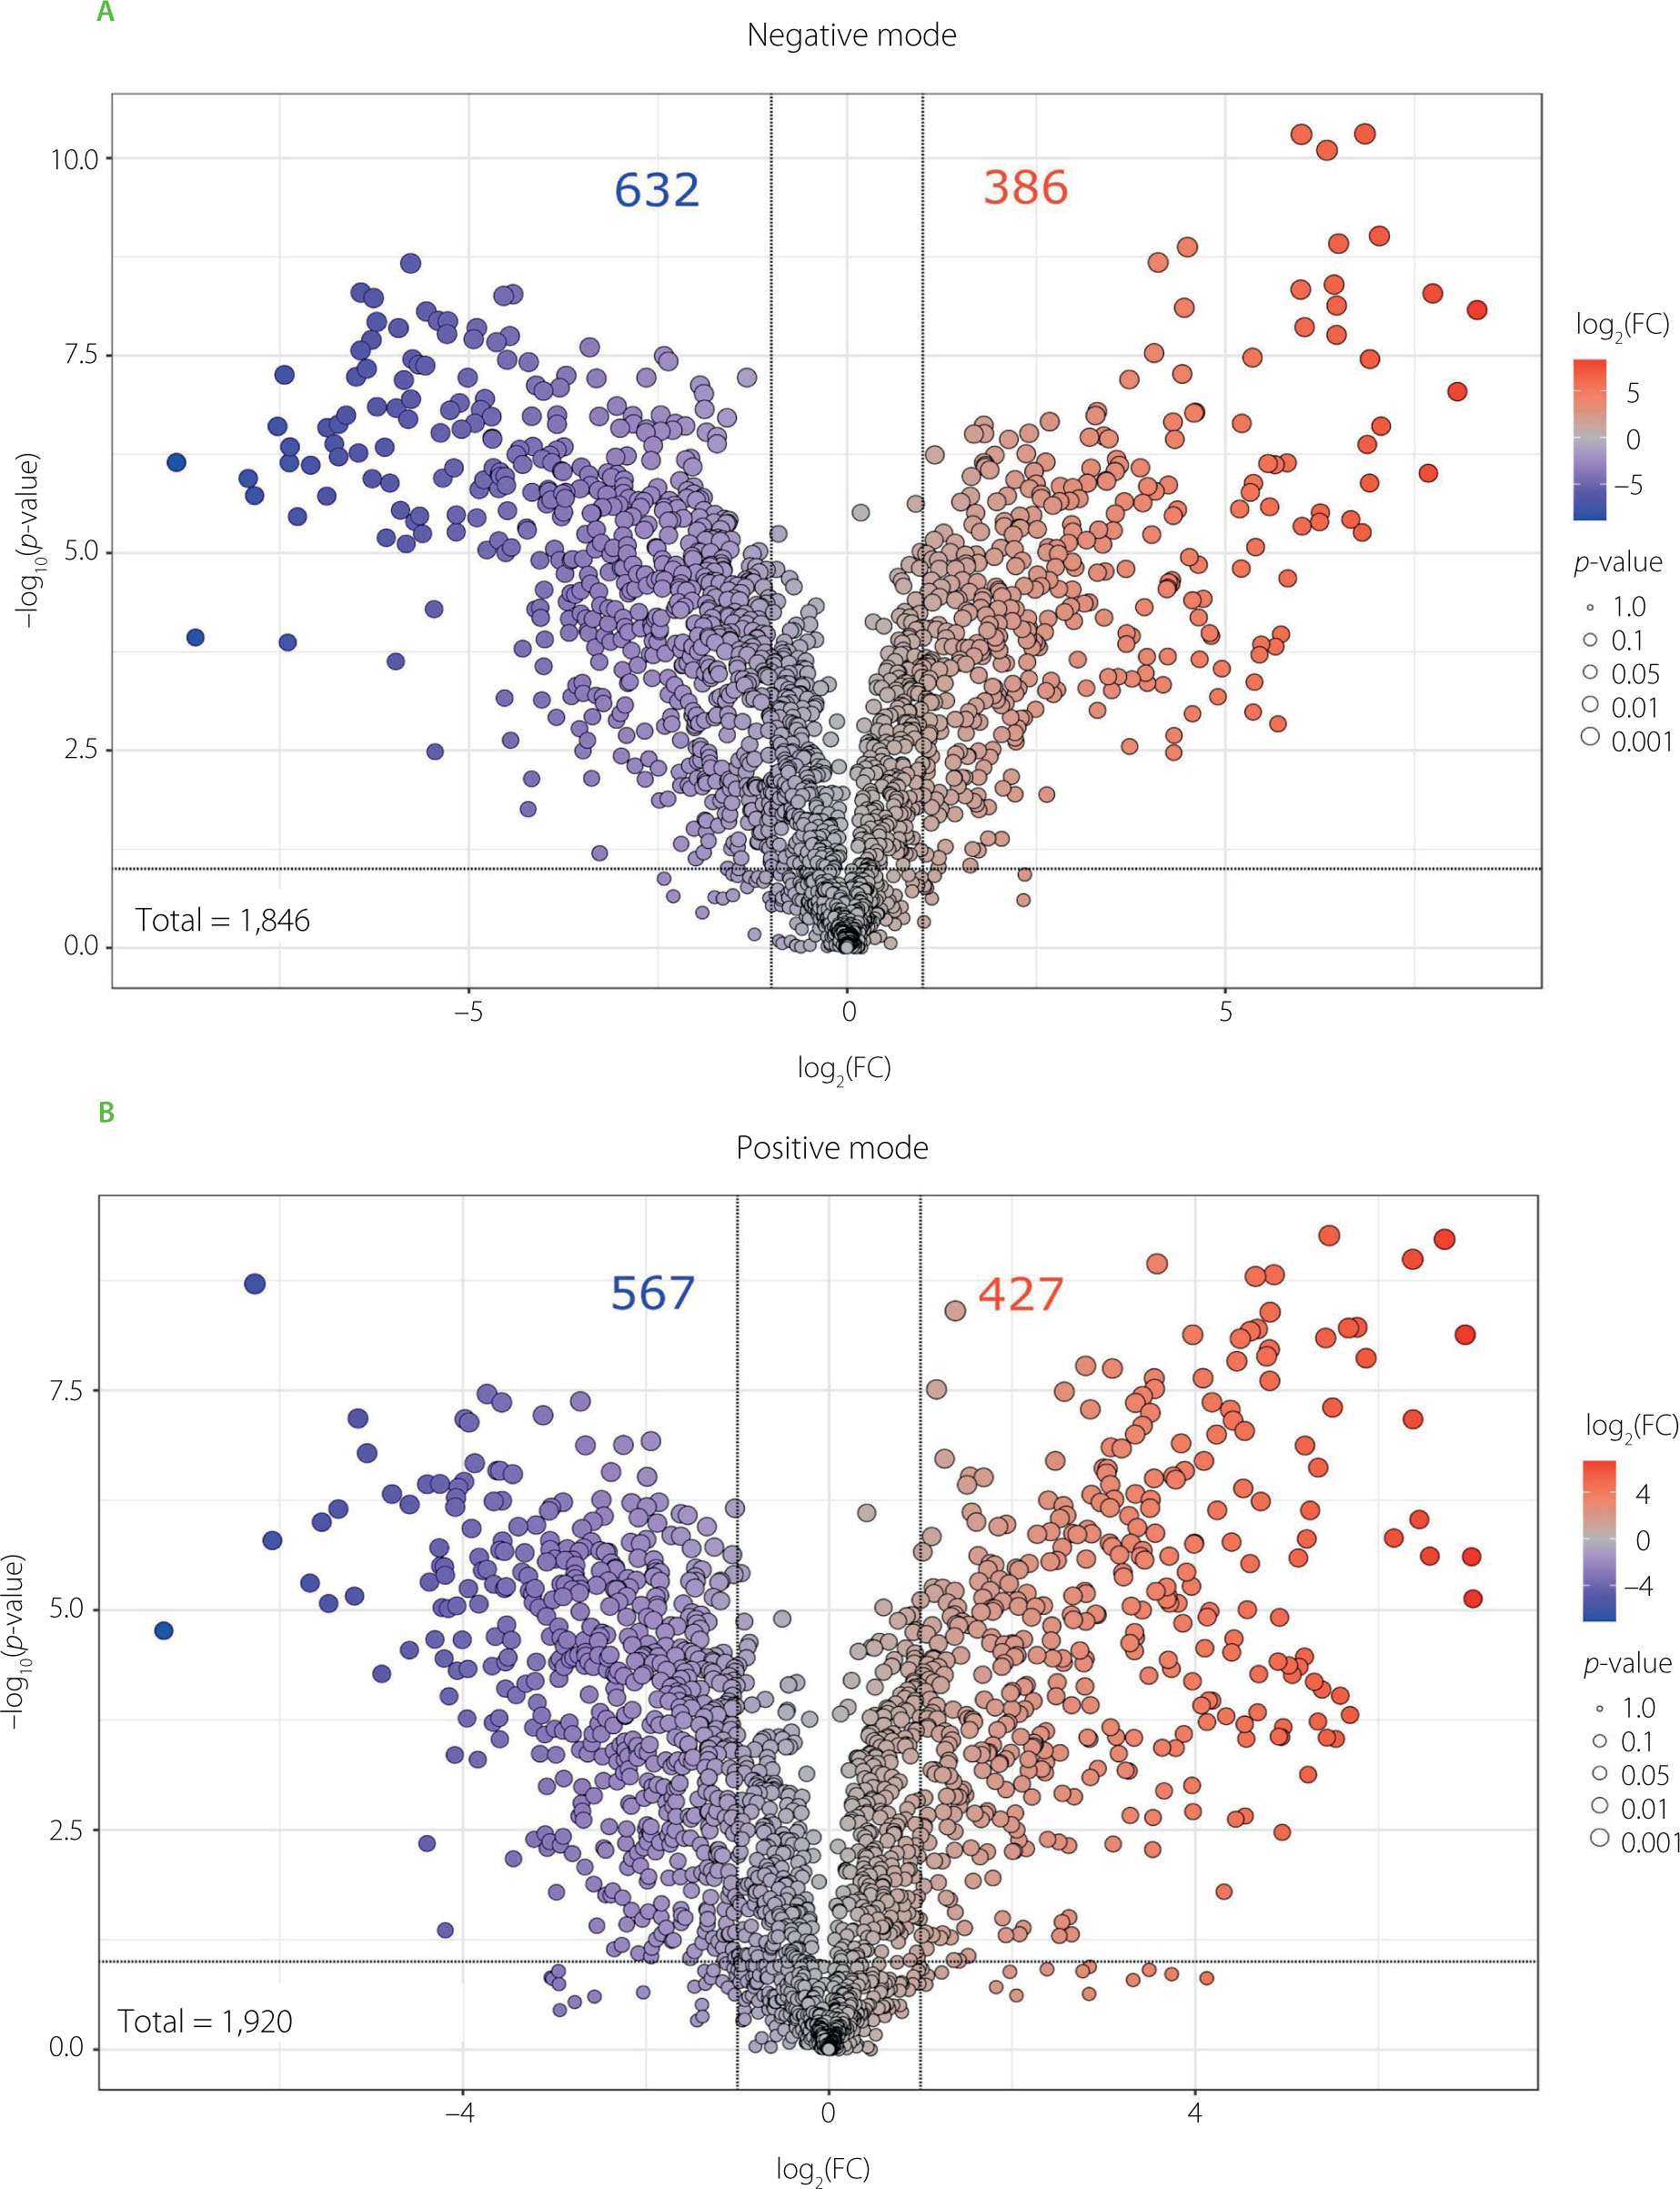
While PCA provides an overview of the separation between sample groups based on their overall metabolomic profiles, volcano plots were used to identify specific features that are significantly different between the most contrasting samples – BB20 (red dots), being the most active against IAV, and BB15 (dark blue dots), being the least active (Figure 5). The upper extremes of the plot (both left and right) emphasize data points that exhibit substantial fold changes along with a strong statistical significance, marking them prime subjects for further analysis. In the negative ionization mode, out of 1,846 detected features, 632 showed a significant decrease and 386 showed a significant increase in BB20 compared to BB15. In turn, 1,920 features were detected in the positive ionization mode, with 567 showing significantly decreased abundance and 427 significantly increased abundance in BB20.
Figure 5
Volcano plots combining the results of fold change (FC) analysis and t-tests comparing metabolomic profiles of two bee bread samples with the highest (BB20, red dots) and lowest (BB15, dark blue dots) antiviral activity determined as the selectivity index.
In the negative ionization mode, the compound that deviated the most from other compounds in BB20 sample (log2(FC)>8) was quercetin 3-O-diglucosyl-N-acetylglucoside (Table S1, Figure 5). Quercetin and its derivatives are recognized for their antiviral efficacy against a wide array of viruses, including major respiratory pathogens such as influenza A virus, respiratory syncytial virus (RSV), rhinovirus (RV), and SARS-CoV-2 [Manjunath & Thimmulappa, 2022]. Their antiviral mechanism primarily involves interference with the viral entry by altering virion surface proteins. Consequently, quercetin may be used as a preventive agent or be used in combination with other pharmacological agents to enhance antiviral activity, potentially reducing toxicity and side effects of co-administrated agents [Di Petrillo et al., 2022]. Besides this compound, luteolin, isorhamnetin, kaempferol derivatives, and other quercetin-related flavonoids were also detected in the BB20 sample. These flavonoids exhibit a broad spectrum of biological activities, encompassing antiviral potential against many groups of viruses, such as influenza A virus [Dong et al., 2014; Ninfali et al., 2020; Yan et al., 2019]. Importantly, the synergistic effects of flavonoid mixtures may enhance their antiviral efficacy, underscoring the need for further investigation into their comprehensive qualitative and quantitative profiles [Ninfali et al., 2020]. On the other hand, in the BB15 sample, in both positive and negative ionization we found outliers belonging to the group of flavonoids, such as kaempferol, isorhamnetin, narcissin, and their derivatives. Despite the presence of flavonoids with established antiviral activity [Badshah et al., 2021], this particular sample exhibited the weakest antiviral effect in the comparative analysis. This discrepancy may be attributed to several factors, including a low content of active flavonoids, limited bioavailability, or antagonistic interactions with other matrix components that may suppress antiviral efficacy.
Furthermore, lactoyl amino acids, such as N-lactoyl-methionine and N-lactoyl-leucine, were identified in the BB20 sample (Table S1). Lactoyl amino acids, derived from amino acids, might indirectly affect immune responses by influencing amino acid metabolism [Naja et al., 2025]. However, there is no evidence for their direct antiviral potential. In the study conducted by Dimitriou et al. [2023], proteinaceous fractions isolated from bee bread demonstrated substantial antiviral activity against IAV. Although the detailed chemical composition of these fractions was not characterized, the reported high selectivity indexes imply the presence of bioactive compounds beyond commonly characterized flavonoids or phenolic acids. Our UPLC-HRMS analysis further revealed the presence of amino acids and related derivatives, potentially originating from peptide-based structures that remained unidentified due to their complex fragmentation patterns. The occurrence of such peptides and proteinaceous compounds may be attributed to the metabolic activity of microbial communities related to bee bread, such as lactic acid bacteria [Asoutis Didaras et al., 2024]. These bioactive peptides and proteins are hypothesized to contribute to the antiviral efficacy observed. Accordingly, comprehensive proteomic profiling of bee bread extracts may help explain the functional contribution of peptide-derived components in their therapeutic applications.
Surprisingly, analysis in the positive ionization mode revealed a considerable presence of organoheterocyclic compounds (Table S1). Among them, raphanusamide – a naturally occurring metabolite in Raphanus sativus L. (radish) – is associated with the plant’s phototrophic response [Chen et al., 2023]. Other alkaloids were identified as well, including palaudine, S-reticuline, salsolinol, protopine, and venoterpine, that were earlier found in many plants belonging to Loganiaceae, Papaveraceae Juss., and Cornaceae families [Deng et al., 2021; Jafaar et al., 2021]. While alkaloids are known to exhibit diverse biological properties, i.e., they possess antioxidant and anti-inflammatory activity and the ability to inhibit DNA and RNA synthesis, determining a viral replication blockage [Ponticelli et al., 2023], the data regarding antiviral activity of particular alkaloids found in our study remain limited. Hence, future research could exploit their presence and concentration in order to determine the botanical origin of BB.
On the other hand, in the BB15 sample, the compounds that deviated the most from other compounds (log2(FC)<-7) were lipid derivatives, such as polyhydroxy fatty acids (9,10,13-trihydroxystearic acid, 9,10,12,13-tetrahydroxyoctadecanoic acid (sativic acid)), oxylipins (DiHODEs, 9-HOTrE), and lactobionic acid (Table S1, Figure 5). Despite exhibiting diverse biological functions [Harlina et al., 2024; Olajide & Cao, 2022], these bioactive lipid derivatives have not been evaluated for their antiviral potential.
Interestingly, in the positive ionization mode, lysophosphatidylcholine (LysoPC, 18:3/0:0) (Table S1, Figure 5) appeared as the most pronounced outlier in BB15. It has been implicated in enhancing influenza A virus replication by modulating the host cellular environment through MAPK, JNK, and PI3K/AKT signaling pathways [Cha et al., 2024]. Thus, its presence may be particularly significant in the context of lower antiviral potential of bee bread.
Nevertheless, the results obtained underscore the complexity of natural matrices, where both pro- and antiviral agents can be present simultaneously. As a result, it seems essential to assess the overall biological impact of the entire metabolite profile, rather than focusing solely on individual components, since their combined interactions may influence the final bioactivity.
CONCLUSIONS
This study demonstrates that aqueous extracts of bee bread possess notable antiviral activity against influenza A virus (H1N1), where 11 out of the 18 studied samples showed selective antiviral action (SI>10). The observed antiviral effects were likely influenced by the complex chemical composition of bee bread, which includes a diverse array of flavonoids, phenolic acids, amino acids, lipids, and carbohydrate derivatives. Metabolomic profiling via UPLC-HRMS revealed 218 distinct compounds, with flavonoids representing the most abundant (45 compounds; 20.6% of all annotated features) and structurally diverse class, dominated by flavonol glycosides. Flavonoids showed the greatest inter-sample variability in relative abundance among all chemical classes (4.2–13.3% of total peak area), with kaempferol and quercetin derivatives collectively accounting for over 60% of total flavonoid peak area, suggesting their key role in the observed variation of antiviral activity across samples. Notably, quercetin derivatives and other flavonoids with known antiviral properties were found in the most active samples. Additionally, 39 amino acid-related compounds (17.9% of total annotated features) and the presence of unidentified high-mass compounds suggest the potential involvement of bioactive peptides, possibly originating from microbial fermentation processes. These findings support the hypothesis that both phenolic and proteinaceous compounds contribute to the antiviral efficacy of bee bread. Further proteomic investigations are, however, needed to elucidate the identity and functional role of peptide-based compounds. Overall, bee bread emerges as a promising functional food supporting viral infection treatment, meriting continued exploration for therapeutic applications.