INTRODUCTION
Ginseng (Panax ginseng C.A. Mey) root is a renowned medicine and component of functional food with numerous bioactivities, which are attributed to compounds contained in it, including ginsenosides, ginseng polysaccharides, polyacetylenic alcohols, peptides and fatty acids [Attele et al., 1999]. Among these compounds, ginseng polysaccharides have aroused widespread concerns and showed numerous biological activities, such as anti-inflammatory, anti-tumor, immunoregulatory, anti-diabetic, and anti-fatigue effects [Huang et al., 2021; Li et al., 2018; Wang J. et al., 2010; Wang K. et al., 2020; Zhou et al., 2020].
Various approaches are used to purify and characterize ginseng polysaccharides. Zhang et al. [2009] fractionated water-soluble ginseng polysaccharides into two neutral fractions and six acidic fractions by a combination of ethanol precipitation, ion-exchange and gel permeation chromatography. The neutral polysaccharides were starch-like glucan or a mixture of starch-like glucan and arabinogalactan. The acidic fractions were composed of neutral sugar, acidic sugar and/or galacturonic acid. Using α-amylase-assisted extraction method and anion exchange and gel permeation chromatography, Sun et al. [2015] fractionated the Panax ginseng root polysaccharides into several neutral and pectic fractions. The neutral fraction contained both amylopectin and amylose, and pectic polysaccharide fraction contained arabinogalactan, type-I rhamnogalacturonan and homogalacturonan-type pectin. These results revealed that water-soluble and insoluble polysaccharides were mainly composed of starch-like neutral polysaccharides.
The molecular weight (MW) of water-soluble ginseng polysaccharides ranged from 3.5 to 110 kDa and those of insoluble ginseng polysaccharides extracted with α-amylaseassisted methods ranged from 5.5 to 430 kDa [Sun et al., 2015; Zhang et al., 2009]. To date, most studies on neutral ginseng polysaccharides focused on starch-like high MW polysaccharides. However, further studies revealed that partial hydrolysis of type-I rhamnogalacturonan pectin fraction from ginseng polysaccharides, which decreased the MW from 110 kDa to 22 kDa, did not appreciably affected the ability of hydrolysate to enhance macrophage phagocytosis in comparison with parent pectin [Zhang et al., 2012]. Also, it was reported that polysaccharides from the leaves of Magnolia kwangsiensis Figlar & Noot with low MW showed much higher antitumor activities than those with high MW [Zheng et al., 2016]. In turn, polysaccharides extracted from Ulva pertusa Kjellman with low MW had stronger antioxidant activity compared with those of high MW [Shi, 2016]. A neutral polysaccharide isolated from American ginseng roots with the MW of 3.1 kDa showed significant antiinflammatory effect [Wang et al., 2015]. These findings indicated that low MW polysaccharides might exhibit high bioactivities. Although there have been a large number of studies on ginseng polysaccharides, understanding the character of low MW polysaccharide is inadequate.
The aim of our study was to establish a novel extraction, fractionation, and purification approach for the exploration of non-starch water-soluble ginseng polysaccharides. The novel neutral polysaccharide was obtained and further characterized using scanning electron microscopy (SEM), gel permeation chromatography (GPC), X-ray diffraction (XRD), Fourier transform infrared spectroscopy (FT-IR), gas chromatography-mass spectrometry (GC-MS), gas chromatography with flame ionization detection (GC-FID), and one-dimensional and two-dimensional nuclear magnetic resonance (NMR). The results could lay the foundation for the improvement of ginseng polysaccharide extraction and structure analysis.
MATERIALS AND METHODS
Chemicals, reagents and materials
Dried ginseng roots were obtained from Beijing Tong Ren Tang Co. (Beijing, China), and identified by Prof. Jianzhong Wang (Beijing Forestry University, Beijing, China). DEAE-52 was purchased from Shanghai Yuanye Bio-Technology Co., Ltd (Shanghai, China). Sephadex G-100 was purchased from Pharmacia Co. (Stockholm, Sweden). Papain, Coomassie brilliant blue G-250, α-amylase and bovine serum albumin were purchased from Sigma Chemical Co. (Saint Louis, MO, USA). Ethanol (95%, v/v), phenol and sulfuric acid were purchased from Beijing Chemical Co., Ltd (Beijing, China). Reference monosaccharide standards (d-glucose (d-Glc), d-galactose (d-Gal), d-xylose (d-Xyl), d-mannose (d-Man), and d-arabinose (d-Ara), trifluoroacetic acid and hexamethyl disilazane (HMDS) were purchased from Sinopharm Chemical Reagent Beijing Co., Ltd (Beijing, China). Trimethylchlorosilane (TMCS) and pyridine were purchased from J&K Scientific Co., Ltd (Beijing, China). All reagents used in experiments were of analytical grade.
Extraction of ginseng polysaccharides
Ginseng roots were extracted with hot water according to the method reported by Yu et al. [2017] with slight modifications. In detail, 50 g of ginseng root powders were defatted with 500 mL of 80% (v/v) ethanol two times at room temperature for 24 h each time. Residues were then extracted with 1000 mL of distilled water three times at 80°C for 3 h each time. The hot water extracts were collected and concentrated with a rotary evaporator (EYELA, Shanghai, China) to a final volume of about 100 mL. The concentrated extracts were precipitated with a fivefold volume of 95% (v/v) ethanol and left to stand overnight at 4°C. Finally, the precipitate was separated by filtration and dissolved in 100 mL of distilled water for further use.
Enzymatic hydrolysis of ginseng polysaccharides
To hydrolyse proteins of the crude extract, 20 U of papain were added to 100 mL of the extract solution, and the mixture was incubated at room temperature for 2 h [Yu et al., 2017]. Then, it was heated at 100°C for 5 min to denature enzyme and stop the reaction, after which the precipitate was removed via centrifugation (2,100×g, 5 min). To further eliminate the starch from crude polysaccharide extract, α-amylase hydrolysis was performed as described by Sun et al. [2015]. Briefly, 80 U of α-amylase were added to 100 mL of the extract and incubated in a water bath at 50°C for 30 min. Following hydrolysis, the mixture was heated to 100°C and kept for 5 min to stop the reaction. The mixture was centrifuged at 2,100×g for 5 min after being cooled down to room temperature. Finally, supernatants were collected, lyophilized, and 4.66 g of crude polysaccharides (GP) were obtained for further fractionation.
Ion-exchange and gel permeation chromatography analysis
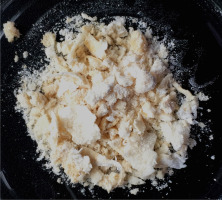
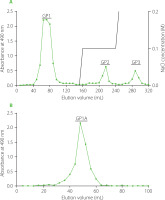
The GP was subsequently fractionated by anion exchange column chromatography according to a previous study with slight modifications [Zhang et al., 2009]. Specifically, 600 mg of GP were dissolved in 20 mL distilled water and centrifuged at 4,200×g for 5 min. The supernatant was passed through a 0.45 μm filter and subsequently loaded onto a pre-treated chromatography column packed with DEAE-52 cellulose (1.6×40 cm). The GP was sequentially eluted from DEAE-52 column with distilled water (160 mL), followed by 80 mL of 0.1 M and 0.2 M NaCl solutions, respectively, at a flow rate of 1 mL/min. The eluate was collected at 8.0 mL per tube using an automatic collector (BSZ-100, Shanghai Jiapeng Technology Co., Ltd, Shanghai, China) and assayed for the distribution of the total sugars with phenol-sulfuric acid method [DuBois et al., 1956]. The appropriate fractions were combined, concentrated, dialyzed against distilled water, and lyophilized to obtain one neutral fraction (132 mg, GP1) and two acidic fractions (GP2 and GP3). A 100-mg portion of GP1 was then dissolved in distilled water, loaded onto a Sephadex G-100 column (1.6×40 cm), and eluted with distilled water with a flow rate of 1.0 mL/min. The eluate (4.0 mL per tube) was collected and assayed for total sugar contents. The appropriate fractions were combined as GP1A, concentrated, and lyophilized for further analysis. The original picture of the GP1A sample was shown in Figure 1.
Chemical composition analysis
The total sugar content was determined by phenol-sulfuric acid assay according to the literature, and the calculation was based on a calibration curve of glucose standard solution in the range of 10–50 μg/mL [DuBois et al., 1956]. The total protein content was determined by Bradford assay, and calculated based on a calibration curve of a bovine serum albumin solution [Compton & Jones, 1985]. The total starch content was determined by measuring the absorbance at 620 nm using I2-KI assay with amylose as a standard [McGrance et al., 1998].
Characterizations of ginseng polysaccharides
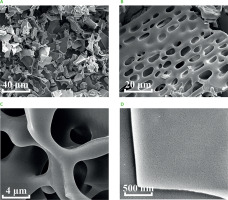
The micro-structure and surface morphology of polysaccharides were observed using a scanning electron microscope (Quanta FEG 250, FEI Company, Hillsboro, OR, USA). Briefly, lyophilized polysaccharides were fixed on a silicon wafer, coated with gold, and then examined at 10 kV accelerating voltage under high vacuum. The micrographs were taken at ×1,000; ×2,000; ×10,000; and ×50,000 magnifications.
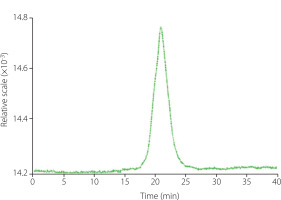
The homogeneity and MW distribution of ginseng polysaccharides were determined by the GPC system (Dawn Helios-II, Wyatt Technology, Santa Barbara, CA, USA). Appropriate amounts of GP1A were dissolved in distilled water and passed through a 0.45 μm filter membrane. An aliquot of 20 μL of the sample was loaded onto the column and then eluted with distilled water at a flow rate of 0.5 mL/min. The chromatogram was recorded with a differential refractive index detector (Shodex SB-806M, Showa Denko K. K, Tokyo, Japan) at 40°C. The MW of the fraction was calculated by comparing it with a calibration curve plotted for different MWs of dextran standards (MW of 1.0, 5.0, 12, 25, 50, 80, 150, 200, 500 kDa).
The crystallinity of ginseng polysaccharides was determined using the D8 Advance X-ray diffractometer (Bruker, Billerica, MA, USA). Under the high voltage of 40 kV, the sample was placed in a dish and scanned in the 2θ angle range of 5° to 60° at room temperature.
The FT-IR spectra were acquired on a Spectrum GX FT-IR spectrometer (PerkinElmer, Inc, Waltham, MA, USA). In detail, 10 mg of the sample powder were dried for 48 h at 50°C in a blast oven (GZX-9070MBE, Boxun Co., Ltd, Shanghai, China) and then mixed with spectroscopic-grade potassium bromide powders. The mixture was pressed into a 1 mm dish and measured using the deuterated triglycine sulfate (DTGS) detector in the range of 4000–400 cm–1.
Monosaccharide composition analysis
GC-MS and GC-FID techniques were used to identify and quantify monosaccharides of GP1A, respectively, after polysaccharide hydrolysis and derivatization of the product of hydrolysis. The hydrolysis of GP1A was performed according to a method reported by Yu et al. [2017] with slight modifications. In detail, 5 mg of the lyophilized sample were dissolved in 4.0 mL of 3 M trifluoroacetic acid (TFA) at 110°C for 4 h. After cooling down to room temperature, the excess reactants were removed by evaporation. The derivatization of degraded ginseng polysaccharides was performed using trimethylsilylation reagents according to a modified method described by Ruiz-Matute et al. [2011]. Briefly, 2 mg of degraded sample were dissolved in 1.0 mL of anhydrous pyridine. Then, 0.6 mL of HMDS and 0.3 mL of TMCS were added, and the mixture was heated at 50°C and kept for 30 min. After cooling down to room temperature, the derivatized sample was centrifuged at 4,200×g for 5 min. Then, 2 mg of each monosaccharide standards (d-Glc, d-Gal, d-Xyl, d-Man, and d-Ara) were derivatized with the same steps, respectively. For both, sample and standards, supernatants were collected and further analyzed by GC-MS and GC-FID under the same protocol.
Agilent 7890A and Agilent 5975C systems (Agilent Technologies, Inc., Santa Clara, CA, USA) were employed for GC-MS and GC-FID analyses, respectively. The injection and detection temperatures were 250°C and 280°C, respectively. The column (DB 5ms Ultra Inert, 30 m × 0.25 mm, film thickness 0.25 μm, Agilent Technologies, Inc.) temperature was programmed to increase from 180°C (maintained for 20 min) to 280°C (maintained for 10 min) at a rate of 20°C/min. Helium was used as the carrier gas and maintained at 1.0 mL/min. The volume of sample injection was 2.0 μL. The identification of monosaccharides was founded by comparing their mass spectra with the National Institute of Standards and Technology (NIST) library databases. Quantification was based on monosaccharide standards by comparing their peak areas with those of the samples (GC-FID separations). The results were shown as the percentage monosaccharide content of GP1A.
Primary structure analysis
All NMR spectra, including 1H NMR, 13C NMR, H–H correlation spectrometry (COSY), heteronuclear single-quantum coherence (HSQC) and heteronuclear multiple bond correlation (HMBC) spectra were recorded on an Avance III HD NMR spectrometer (Bruker), operating at 500 MHz and 25°C. After deuterium exchange in D2O and double lyophilization, 20 mg of the sample were dissolved in 0.5 mL of 99.9% D2O, and the spectra were recorded under 500 MHz. Data collation was implemented using standard MestReNova software (Mestrelab Research SL, Santiago de Compostela, Spain).
RESULTS AND DISCUSSION
Extraction and enzymatic hydrolysis of ginseng polysaccharides
In the preliminary step of ginseng root polysaccharides purification, the ethanol-soluble impurities were removed from root powder by ethanol (80%, v/v) extraction. Then starch, non-starch polysaccharides, and proteins remained in the residues were extracted with hot water (80°C) and precipitated by 95% (v/v) ethanol. After dissolving the precipitation in distilled water, starch and proteins in the solution were hydrolyzed with α-amylase and papain, which led to obvious decrease of starch and protein content from 9.18±0.13% and 1.53±0.04% to less than 0.01% (w/w), respectively. The extraction yield of enzymatically hydrolyzed crude ginseng polysaccharides (GP) reached about 9.32% (w/w).
Fractionation and purification of ginseng polysaccharides
For further fractionation and purification of ginseng polysaccharides, anion exchange chromatography and gel column chromatography were applied. Anion exchange column chromatography is the most commonly applied method for bulky polysaccharides purification at first, because the separation mechanism is not only ion-exchange but also adsorption-desorption. Anion exchange column chromatography is suitable for the separation of neutral and acidic polysaccharides by eluting with different ionic strength buffers [Yu et al., 2017]. Because of the open framework and weak adsorption to polysaccharide, DEAE-cellulose was usually the first choice as an anion exchanger [Wang et al., 2022]. In the present study, GP was fractionated into three fractions, GP1, GP2 and GP3 on a DEAE-52 anion exchange column chromatograph, as shown in Figure 2A. GP1 was eluted out by water, whereas GP2 and GP3 were obtained by elution with 0.1 M and 0.2 M NaCl solutions. GP1, GP2 and GP3 accounted for about 21.95%, 3.91% and 3.22% (w/w) of the total samples loaded, respectively. GP1, the major fraction was then purified using Sepharose G-100 gel column chromatography, which was commonly used to separate polysaccharides according to their size and shape [Kang et al., 2019; Wang et al., 2018]. Finally, GP1A was obtained by water elution, corresponding to a single and narrow peak as shown in Figure 2B, with a yield of 7.3% (w/w).
Characterization of ginseng polysaccharide fraction
Surface morphology
The surface morphology and microstructure of GP1A revealed by SEM were shown in Figure 3. The SEM image magnified at ×1,000 (Figure 3A) revealed that GP1A was intensively concentrated and presented as irregular and lamellar shape. When magnified at ×2,000 (Figure 3B), GP1A showed representative honeycomb-like morphology with some small fragments on the surface, which was similar in the morphology of a neutral fraction of WPS-1 isolated from American ginseng [Yu et al., 2017]. Further enlarged SEM images clearly presented smooth and compact structure, indicating that interactions among multiple molecules in GP1A were close and tight (Figures 3C and 3D). Obviously, the SEM observation demonstrated that the lyophilized GP1A powder was amorphous.
Homogeneity and MW distribution
The homogeneity and MW distribution of GP1A were assessed by GPC analysis. The GPC profile showed a single and sharp peak indicating that GP1A was homogeneous with high purity (Figure 4). The average MW of GP1A was 1.03 kDa, which was similar to a neutral polysaccharide PPQN (3.3 kDa) isolated from American ginseng, but far lower than those of other water-eluted polysaccharide fractions obtained from ginseng [Luo & Fang, 2008; Wang et al., 2015]. In previous studies, low MW polysaccharides were usually discarded during the fractionation process, which is a huge waste of resources [Zheng et al., 2016].
Crystallinity
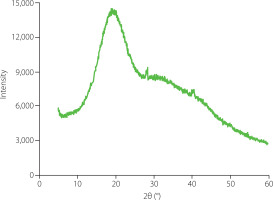
The crystallinity of polysaccharides directly influences their physical properties such as solubility, flexibility and swelling ability [Mazeau & Rinaudo, 2004]. XRD is a powerful technique for crystallinity analysis of polysaccharides [Park et al., 2010]. The XRD pattern of GP1A was recorded between 5° and 60° (Figure 5), which suggested that GP1A was an amorphous polymer with low overall relative crystallinity (28.3%). The crystalline region of GP1A was realized at the angle (2θ) 19.05°, which was similar to that of water-soluble polysaccharides isolated from chickpea flour (19.6°) [Mokni Ghribi et al., 2015]. Moreover, the XRD data was consistent with the SEM observation, both showed that GP1A occurred as amorphous powders.
Identification of molecular structures by FT-IR
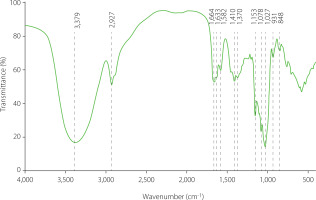
The FT-IR spectrum of GP1A at range of 4,000–400 cm–1 (Figure 6) was recorded for qualitative analysis of functional groups. The spectrum showed no absorption at 1,650 cm–1 and 1,736 cm–1, which corresponded to the stretching vibrations of C–O bonds in the acylamino group and the ester carbonyl group (C=O) in protonated carboxylic acid, indicating the absence of proteins and alduronic acids in GP1A [Jeddou et al., 2016; Wang et al., 2012]. The detected broad and strong absorption band at 3,379 cm–1 and the shoulder absorption band at around 2,927 cm–1 were characteristic as absorption bands of polysaccharides and attributed to stretching vibrations of O–H and C–H, respectively [DuBois et al., 1951]. The spectrum bands at around 1,664 cm–1 were assigned to the bound water [Zhao et al., 2005]. The recorded band at 1410 cm–1 was reported to be the bending vibration of C–H [Romdhane et al., 2017]. The specific bands in the 1,200–1,000 cm–1 region were ascribed to ring vibrations overlapped with the stretching vibrations of C–O–H side groups and the C–O–C glycosidic vibrations [Fan et al., 2009]. The absorption peaks at 1,027 cm–1; 1,078 cm–1; and 1,153 cm–1 indicated a pyranose form of polysaccharides [Luo et al., 2010]. In general, the spectrum over the frequency range 960–730 cm–1 was assigned to either α- or β-d-glucopyranose, disregarding being reducing sugar, methyl glucosides, or polysaccharides. Specifically, α-anomers absorbed at 844±8 cm–1, and β-anomers at 891±7 cm–1. In the FT-IR spectrum of GP1A, no absorption band was observed at around 891 cm–1, while an obvious band at 848 cm–1s occurred, indicating the existence of α-d-glucopyranose. In summary, the FT-IR indicated that GP1A was a neutral polysaccharide without protein contaminants and suggested the existence of α-d-glucopyranose.
Monosaccharide composition
Total ion GC-MS chromatogram of main silyl monosaccharide derivatives identified in the hydrolyzed GP1A is shown in Figure 7. Comparing with NIST library database, the derivatives of d-xylose, d-galactose, d-arabinose, d-mannose, and d-glucose, containing α- and β-anomer were found (Table 1).
Figure 7
Total ion chromatogram of monosaccharides of ginseng polysaccharide GP1A obtained by gas chromatography–mass spectrophotometry (A) and National Institute of Standards and Technology database matching total ion chromatogram of monosaccharides of GP1A (B).
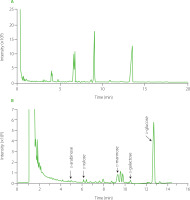
Table 1
Main silyl derivatives of monosaccharides identified in hydrolyzed ginseng root polysaccharide GP1A by gas chromatography–mass spectrometry analysis.
According to the GC-FID separations of standards and GP1A after hydrolysis and silylation (data not shown), GP1A was composed of d-glucose, d-galactose, d-mannose, d-xylose and d-arabinose in a molar ratio of 90.62:2.01:7.14:1.05:0.20. The neural polysaccharide fraction WGPN, isolated from ginseng by Zhang et al. [2009] was composed of glucose, galactose, arabinose with a molar ratio of 73.31:2.54:1.8 Another neutral ginseng polysaccharide WGPE-N isolated from hot water-extracted ginseng residues with the assistance of α-amylase was revealed to be composed of glucose, arabinose and galactose with a molar ratio of 94.8:2.9:2.3 [Sun et al., 2015]. The homogeneous neutral polysaccharides PGPW with high MW of 350 kDa, isolated from ginseng roots, was reported to be composed of glucose, galactose, mannose, and arabinose with a molar ratio of 3.3:1.2:0.5:3.3 [Li et al., 2012]. By comparing our results with those of ginseng polysaccharides reported previously, the present non-starch neutral polysaccharide was distinguished in monosaccharide composition.
The primary structure analysis
The 1H NMR spectrum of GP1A is shown in Figure 8A. The 1H signals at δ 5.0–5.4 ppm were assigned as anomeric protons of the α-glycosidic configuration and δ 4.4–5.0 ppm were the β-glycosidic configuration [Wang et al., 2017]. The 1H signal at around δ 4.70 ppm was the solvent peak of D2O. Five anomeric proton signals at δ 5.31, 5.14, 4.88, 4.58 and 4.56 ppm were present in the 1H-NMR spectrum, indicating that GP1A was generally composed of five types of sugar residues. These results are consistent with that obtained from GC-MS analysis. The 13C-NMR spectrum contained signals for five anomeric signals at δ 100.38, 99.60, 98.25, 95.76 and 95.75 ppm (Figure 8B). Combined with the HSQC (Figure 8C) and H-H COSY (Figure 8D) spectrum data and data in references, the anomeric proton and carbon signals at δ 5.31/99.60 ppm, 5.14/100.38 ppm, 4.88/98.25 ppm, 4.58/95.76 ppm and 4.56/95.76 ppm were assigned to α-d-Glc, α-d-Gal, β-d-Xyl, β-d-Man and β-d-Ara, respectively [Li et al., 2012; Guo et al., 2015; Meng et al., 2017]. The signals of other sugar ring protons existed in the region of δ 3.40–4.40 ppm, whose corresponding carbons existed in the region of δ 60–80 ppm. The lack of carbon signals in the region δ 82–84 ppm was evident of the absence of furanosidic residues [Guo et al., 2015]. The proton and carbon chemical shifts of sugar resides derived from the 1D and 2D NMR spectra were assigned in detail and summarized in Table 2.
Figure 8
Proton nuclear magnetic resonance (1H NMR) (A), carbon-13 nuclear magnetic resonance (13C NMR) (B), heteronuclear single-quantum coherence (HSQC) (C), H–H correlation spectrometry (COSY) (D), heteronuclear multiple bond correlation (HMBC), (E) spectra (D2O) of ginseng polysaccharide GP1A.
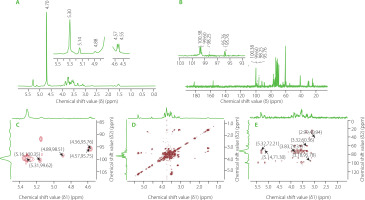
Table 2
1H and 13C nuclear magnetic resonance chemical shifts (ppm) for signals of ginseng root polysaccharide GP1A.
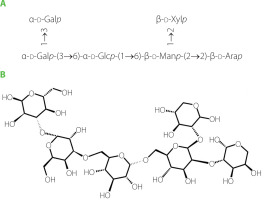
The glycosyl sequence and linkage sites among residues were confirmed by the long-range 1H-13C correlations obtained from the HMBC spectrum (Figure 8E). Cross-peaks were found between α-d-Glc H1 (δ 5.31 ppm) and β-d-Man C6 (δ 72.29 ppm), α-d-Gal H3(δ 3.32 ppm) and α-d-Glc C6(δ 60.5 ppm), α-d-Gal H1(δ 5.14 ppm) and α-d-Glc C3(δ 71.90 ppm), β-d-Xyl H2 (δ 3.18 ppm) and β-d-Man C1 (δ 95.78 ppm), β-d-Man H2 (δ 3.83 ppm) and β-d-Ara C2 (δ 74.31 ppm) [He et al., 2017; Yao et al., 2021]. Above all, the GP1A ginseng polysaccharides were composed of five types of monosaccharides, and the main sequence was: α-d-Glcp-(6→3)-α-d-Galp-(1→1)-α-d-Glcp-(3→4)-β-d-Manp-(2→2)-β-d-Arap, with the branch chains of α-d-Glcp substituted at α-d-Galp and β-d-Xylp substituted at β-d-Manp. The deduced primary structure and the chemical structure of GP1A are shown in Figure 9.
CONCLUSION
By a combination of removal of ethanol-soluble compounds, hot water extraction, ethanol precipitation, α-amylase and papain enzymatic hydrolysis, ion-exchange and gel permeation chromatography fractionation, a polysaccharide fraction GP1A was obtained from ginseng roots. GPC analysis revealed that GP1A was a homogenous polymer, with an average MW of 1.03 kDa, which was significantly lower than those of various polysaccharides reported previously. SEM and XRD analyses indicated that lyophilized GP1A was an amorphous powder with very low crystallinity. FT-IR analysis demonstrated that GP1A was a protein-free neutral polysaccharide, containing α-d-glucopyranose. GC-MS and GC-FID of the hydrolyzed GP1A revealed that major released monosaccharides were glucose, galactose, mannose, xylose and arabinose in a molar ratio of 90.62:2.01:7.14:1.05:0.20. The chemical structure was deduced by the one-dimensional and two-dimensional NMR. Therefore, the obtained GP1A polysaccharide was a novel neutral non-starch polysaccharide, which was distinguished from previously reported ones in both MW and monosaccharide composition.

