INTRODUCTION
Tea, which originated in China, is widely favored by consumers due to its distinct flavor and potential health benefits [Pan et al., 2022]. The health benefits of tea are primarily attributed to its secondary metabolites, such as phenolics, caffeine, and other bioactive compounds. Green tea is classified as an unfermented tea because the processing method includes a fixed degreening step to prevent the tea from fermenting [Parvez & Wani, 2024]. The phenolic compounds in green tea remain unoxidized during processing, which effectively preserves the natural green coloration and fresh flavor characteristics of this tea variety. The quality of green tea is principally determined through the comprehensive evaluation of visual appearance, leaf base characteristics, aromatic profile, color of the tea infusion, and infusion taste characteristics [Yu et al., 2020]. The aromatic complexity of green tea arises from its diverse composition of volatile organic compounds (VOCs) with specific chemical classes imparting distinct olfactory notes [Kun et al., 2025]. Aldehydes contribute fresh herbaceous and floral aromas, while terpenes deliver floralcitrus and fruity nuances. Pyrazines introduce nutty and roasted scent dimensions, complemented by esters and ketones that provide fruity-sweet and minty aromatic layers [Yin et al., 2022]. While non-volatile compounds play a crucial role in shaping the flavor and the taste profile of green tea [Deng et al., 2022; Yu et al., 2014]. The principal bitter and astringent compounds in green tea can broadly be categorized into phenolics and alkaloids, exemplified by catechins, gallic acid, and caffeine [Yu et al., 2014]. According to Zhang et al. [2020] and the references therein, caffeine, epicatechin gallate (ECG), and epigallocatechin gallate (EGCG) contribute to the bitterness of green tea, while amino acids, particularly glutamic acid (Glu), glutamine, and l-theanine, are primarily responsible for the umami taste. The sweet-tasting amino acids, such as l-alanine, l-glycine, l-serine, l-proline, l-threonine, and carbohydrates including glucose, saccharose and fructose, are also presented in green tea and tea infusions. These compounds typically impart a sweet aftertaste following the perception of bitterness or astringency. Additionally, compounds like epigallocatechin (EGC) and epicatechin (EC) can enhance the persistence of this sweet aftertaste [Zhang et al., 2020].
Principal component analysis (PCA) reduces dimensions by transforming multiple indicators into several composite indicators [Shi et al., 2021]. Based on this characteristic, PCA can be used to identify the key quality indicators of green tea samples so as to provide a clear understanding of how different factors contribute to overall tea quality.
Ion mobility spectrometry (IMS) represents a novel analytical technique that detects gas-phase molecules and characterizes ionic species based on their differential migration velocities through electric fields in gaseous phases [Wang et al., 2020]. Requiring no sample preparation, this method operates at standard atmospheric pressure. By merging high separation capabilities of gas chromatography (GC) with the fast detection strengths of IMS, this integrated technique offers excellent resolution and sensitivity, providing a robust foundation for both qualitative and quantitative analyses of trace VOCs, particularly in the discrimination of structurally similar isomers [Vautz et al., 2018]. Applications of this GC-IMS technique have expanded to various food science domains, which include quality assessment [Zheng et al., 2024], production process monitoring [Chen et al., 2024], VOCs differentiation [Zhu et al., 2024], flavor characterization [Li et al., 2024], and adulteration identification [Wu et al., 2024].
Longnan is located in the southeastern part of Gansu Province, China, and is the only tea-producing region in Gansu. However, current research on the quality assessment of Longnan green tea is still limited, and its specific quality attributes and competitive advantages remain inadequately characterized. Therefore, the aim of this study was to analyze the chemical composition and identify the key VOCs of green tea from Wenxian, Wudu, and Kangxian in Longnan to establish a reference framework for optimizing and identifying the characteristic traits of Longnan green tea and fostering the development of regional specialty products. This study provides valuable information for understanding the quality variations and characteristics of green tea among these counties.
MATERIALS AND METHODS
Plant material
A total of 24 commercial green tea products of different brands and manufacturers were randomly collected from Wenxian (WX), Wudu (WD), and Kangxian (KX) in Longnan (China), including 8 samples from WX, 7 samples from WD, and 9 samples from KX. All these green tea products are listed in Table S1 in Supplementary Materials. The products were stored at 4°C in the dark until they were analyzed.
Determination of water extract content and chemical composition of green tea
Determination of water extract content and chemical composition of Longnan green tea was conducted by Gansu Digital Herbal Inspection Center Co., Ltd (Dingxi, China). The results of these analyses were expressed in g of the determined extract/ -compound per 100 g of tea leaves.
The water extract content was determined using the International Organization for Standardization (ISO) standard [ISO 9768: 1994]. Namely, the water-soluble substances were extracted from the tea leaves by refluxing with boiling water. Then, the content of water-soluble substances was calculated after filtration, rinsing, drying, and weighing the tea residue.
The content of tea polysaccharides (TPS) was analyzed according to an occupation standard established by the General Administration of Quality Supervision, Inspection and Quarantine of China [SN/T 4260-2015]. Weighed tea (0.5 g) was soaked with water, and anhydrous ethanol was added. After centrifugation, the residue was subjected to ultrasound-assisted extraction with boiling water. The extraction was repeated, and the combined supernatants were cooled and filtered. Then, the reaction of the extract with the phenol-sulfur reagent was performed, and absorbance was measured at 490 nm. The TPS content was calculated based on a glucose standard curve.
Gallocatechin gallate (GCG) was analyzed according to a method previously used by Wang et al. [2019]. The extract of green tea obtained by ultrasound-assisted extraction with 80% (v/v) methanol solution was separated by a Waters Alliance e2695-2998 high-performance liquid chromatography (HPLC) system with a diode array detector and an Empower 3 data workstation (Waters Corporation, Milford, MA, USA). Elution of compounds from Waters SunFire C18 column (4.6×250 mm, 5 µm) was carried out in a gradient system using acetonitrile and 0.5% (v/v) acetic acid as the mobile phase with a flow rate of 0.7 mL/min. The target compound was detected at 270 nm and 360 nm dual wavelength and quantified using GCG standard.
The content of EC, EGC, ECG, catechin (C), and EGCG were measured by the HPLC method according to the ISO standard [ISO 14502-2:2005]. Catechins were extracted from ground tea samples using 70% (v/v) aqueous methanol in a 70°C water bath. Separation was achieved using a Waters Alliance e2695-2998 HPLC system equipped with a Waters SunFire C18 column (4.6×250 mm, 5 µm) under gradient elution, and the target compound was detected at 278 nm. Quantification was performed directly by external standard calibration.
The l-theanine content was quantified based on the ISO standard [ISO 19563:2017]. Tea samples were extracted with boiling water. The extract was purified by polyamide column chromatography, and HPLC analysis was carried out using the same HPLC system with the same C18 column as during GCG content determination. Water and acetonitrile were used as a mobile phase, and a UV detection wavelength was 210 nm. The l-theanine identification and quantification were based on comparative data obtained from the standard.
The contents of Glu and arginine (Arg) were determined using the GB standard [GB/T 30987-2020] issued by the State Administration for Market Regulation of China and the National Standardization Administration of China. A fully automatic amino acid analyzer (L-8900, Hitachi Ltd., Tokyo, Japan) was used in our study. Tea water extract obtained at boiling temperature, was separated by the sulfonic acid type cation exchange column of the amino acid analyzer. The eluted amino acids were derivatized with ninhydrin at 135°C. The primary and secondary amine derivatization products were detected at wavelengths of 570 nm and 440 nm, respectively, through the visible light detector. The retention time was used for qualitative analysis, and the external standard working curves of Glu and Arg were used for quantitative determination.
The total content of free amino acids (FAA) was determined according to a GB standard [GB/T 8314-2013] by reaction of α-amino group of amino acids with ninhydrin at pH 8.0 and detection of a formed purple complex at 570 nm. Quantification was performed by external standard calibration using glutamic acid standards.
The content of caffeine was measured using the ISO standard [ISO 10727:2002]. Namely, the caffeine in tea was extracted with boiling water in the presence of magnesium oxide. HPLC analysis of the extract was performed using a Waters SunFire C18 column (4.6×250 mm, 5 µm), 30% (v/v) methanol as a mobile phase, and an ultraviolet detector set to 280 nm. The retention time was used for qualitative analysis, and the external standard working curves of caffeine were used for quantitative determination.
The crude fiber content was analyzed following the ISO standard [ISO 15598:1999]. Namely, the sample was digested with 1.25% NaOH, and the residue was then subjected to incineration and weighed. The crude fiber content was calculated based on the mass loss during the incineration process.
Analysis of volatile organic compounds
The headspace-gas chromatography-ion mobility spectrometry (HS-GC-IMS) analysis of representative tea samples was performed using an HS-10 autosampler (Shimadzu, Kyoto, Japan) coupled with a GC-2010 Pro chromatograph (Shimadzu) and an IMS module (Hanon Advanced Technology Group Co., Ltd, Shandong, China). The system was equipped with a DB-5 capillary column (30 m×0.25 mm×0.25 μm, Shimadzu). The tea samples were first crushed and then passed through 50-mesh and 10-mesh sieves, after which the intermediate particles were accurately weighed (2.000±0.005 g) and transferred into headspace bottles. These samples were incubated at 90°C for 25 min and shaken for 10 min. A pressure of 100 kPa was then applied for 1 min, followed by equilibration for another 1 min. Subsequently, 0.5 mL of the headspace gas was sampled using a 95°C heated syringe and injected into the GC injector at 105°C with a split ratio of 10:1. High-purity nitrogen (>99.999%) served as the carrier gas at a flow rate of 1.0 mL/min. The analytes were ionized in the IMS ionization chamber using a 3H ionization source in a positive ion mode. The resulting ions were introduced into a drift tube with a 100 μs injection pulse width, operated at a drift voltage of 180 V and a temperature of 45°C. Each spectrum was generated from the mean of 12 scans. n-Ketones of C4–C9 (Shanghai Aladdin Scientific Corp, Shanghai, China) were used as external reference standards to determine the retention index (RI) of each compound. All VOCs were identified by comparing their RIs and drift times (DT) with those of the reference compounds listed in the proprietary GAS 3H_IMS library (Hanon Advanced Technology Group Co., Ltd; version 1.4.2, updated annually) and the NIST 2020 Mass Spectral Library (National Institute of Standards and Technology, Gaithersburg, MD, USA) accessed through the VOCal software (0.4.03, Hanon Advanced Technology Group Co., Ltd). The quantification of VOCs was performed by calculating peak volumes by integrating signals across both chromatographic and ion mobility dimensions. Relative content was expressed as the percentage of each compound’s peak volume relative to the total ion current of all VOCs detected in the sample.
Statistical analysis
Measurements were conducted in triplicate for water extract, chemical composition, and VOC analyses, and the results were expressed as means and standard deviations. The analysis of variance (ANOVA) with Tukey’s post hoc test for normally distributed variables, and the Kruskal-Wallis test with Holm-Bonferroni correction for non-normally distributed variables were used to evaluate the differences in physicochemical parameters and VOCs among Longnan green teas from three different counties. Differences were considered statistically significant at p<0.05.
The 14 quality indicators of Longnan green tea were subjected to PCA to obtain the eigenvalue, variance contribution rate, and cumulative contribution rate of each component. Only components with eigenvalues greater than 1 were selected for further analysis. The score function expressions (Yn) for principal components 1 to 5 were calculated using Equation (1):
where: PCn denotes the feature vector of the corresponding matrix, zn represents the standardized index for evaluating tea quality.
Subsequently, the comprehensive quality score (Y) of green tea was calculated using Equation (2):
(2)
where: E1, E2, E3, E4, and E5 are the eigenvalues of PC1, PC2, PC3, PC4, and PC5, respectively. The calculation steps for the comprehensive evaluation score were based on methods referenced from previous studies [Shi et al., 2021].
ANOVA and PCA were carried out using SPSS (version 24.0, IBM, Armonk, NY, USA). SIMCA 14.1 (Sartorius Stedim Data Analytics AB, Umeå, Sweden) software was used to conduct orthogonal partial least squares-discriminant analysis (OPLS-DA) for determining variable importance in projection (VIP) scores. Heat map was subsequently created using Origin 2021 (Origin Lab, Northampton, MA, USA).
RESULTS AND DISCUSSION
Physicochemical parameters of green tea
Multiple components, which influence the quality of green tea, are essential to the scientific evaluation of tea taste quality. This study analyzed the variations in the contents of C, EC, ECG, EGC, EGCG, GCG, l-theanine, Glu, Arg, FAA, TPS, crude fiber, caffeine, and tea water extract among Longnan green tea samples from different counties (Table 1). The green tea samples from the three counties in Longnan exhibited similar contents of individual catechins and l-theanine (p≥0.05), but differed significantly in key indices such as tea water extract, Glu, TPS, FAA, and caffeine (p<0.05). The mean tea water extract was significantly higher in the green tea from KX compared to WX and WD samples. The mean TPS content was markedly higher in the KX green tea than in the WX samples. Conversely, the mean content of Glu was considerably higher in the WX green tea than in WD and KX samples. Moreover, the WD green tea had significantly higher mean levels of caffeine and FAA average compared to the KX samples.
Table 1
Water extract content and chemical composition (g/100 g) of Longnan green tea samples from different counties: Wenxian (WX), Wudu (WD), and Kangxian (KX).
[i] The values are pooled from Longnan green tea samples in three different counties. Values in the same row with different superscript letters (a, b) indicate significant differences (p<0.05) TPS, tea polysaccharides; C, catechin; GCG, gallocatechin gallate; EC, epicatechin; ECG, epicatechin gallate; EGC, epigallocatechin; EGCG, epigallocatechin gallate; FAA, free amino acids; Glu, glutamic acid; Arg, arginine.
Water extracts
The tea water extracts of all green tea samples ranged from 41.88 to 46.48 g/100 g (Table 1). The lower means for WD and WX green tea (43.17 and 43.57 g/100 g, respectively) compared to the mean for the KX sample (45.10 g/100 g) may suggest differences in plucking or drying processes, or variations in leaf maturity at harvest, potentially leading to a lower yield of extractable compounds [Aaqil et al., 2023]. In turn, the higher extractability indicating a higher content of soluble solids may suggest a potentially richer flavor and aroma profile.
Tea polysaccharides
Polysaccharides in tea are known to contribute to mouthfeel, potential bioactivities, and health benefits such as antioxidant and immunomodulatory effects [Wang et al., 2022]. In our study, the TPS content of the WX green tea ranged from 0.53 to 1.02 g/100 g with a mean of 0.78 g/100 g. In turn, the WD green tea contained TPS in the range of 0.68–1.15 g/100 g with a mean of 0.88 g/100 g, while the KX green tea had 0.95–1.20 g/100 g with a mean of 1.02 g/100 g (Table 1). The TPS content in Longnan green tea was higher compared to literature data for Luzhou high-mountain green tea, for which it ranged from 0.43 to 0.53 g/100 g [Zheng et al., 2021]. These differences in TPS content may be influenced by raw materials and post-harvest processing techniques [Xiao et al., 2023]. The relatively higher TPS content in the KX green tea may enhance both its functional value and sensory attributes.
Catechins
The primary catechins in green tea include EGCG, EGC, ECG, EC and C. EGCG is usually the most abundant, followed by ECG, EGC, EC, and C in a descending order [Koch et al., 2018]. Similar findings were observed in this study, where EGCG was the most abundant catechin with the content ranging from 5.24 g/100 g to 11.22 g/100 g (Table 1). The second with a high content was ECG (1.95–3.89 mg/100 g). The content of EGC was in a broad range from 0.02 to 3.03 g/100 g. In turn, lower contents were found for EC (0.37–0.86 mg/100 g) and C (0.12–0.48 mg/100 g). The contents of catechins in tea are influenced by multiple factors, such as the variety of tea, environmental conditions during growth, the timing of plucking, and the method of processing [Donlao & Ogawa, 2019; Tan et al., 2017; Wei et al., 2011; Ye et al., 2018]. Additionally, the maturity of fresh tea leaves also influences catechin levels, and the tender tea leaves often contain higher concentrations of catechins [Xu et al., 2021]. Higher levels of catechins not only contribute to the health benefits of the tea but also influence its flavor and overall sensory profile [Zhang et al., 2020]. Notably, the EGCG (5.24–11.22 g/100 g) and ECG (1.95–3.87 g/100 g) levels quantified in Longnan green tea products substantially exceed those reported for Japanese green tea (EGCG content in the range of 0.09–6.75 g/100 g, ECG content in the range of 0.29–1.59 g/100 g) [Unno et al., 2025].
Amino acids
The mean content of FAA in WX, WD, and KX green tea samples was 6.87, 7.07, and 5.81 g/100 g, respectively (Table 1). The quality of green tea is closely associated with its amino acid content, with higher amino acid levels typically indicating higher tea quality, as they contribute to a fresher and more umami-rich taste [Kazan et al., 2019]. The relatively higher FAA content of the WX and WD green tea samples suggests that these products may possess superior sensory quality. The mean content of Glu was 0.43 g/100 g in WX, 0.38 g/100 g in WD, and 0.30 g/100 g in KX green tea. The content of Arg in all Longnan green teas ranged from 0.05 to 0.59 g/100 g. Such variations in amino acid content may result from differences in protein hydrolysis under distinct processing conditions [Ye et al., 2018; Zhu et al., 2021]. l-Theanine is known for its contribution to the umami flavor and broad spectrum of health benefits, such as regulating inflammation, protecting nerves, aiding gastrointestinal health, and potentially inhibiting tumors [Chen et al., 2023]. Additionally, certain studies suggested that l-theanine might influence the aroma of tea [Guo et al., 2019]. This compound was detected in all the studied samples with content ranging from 0.48 to 2.65 g/100 g (Table 1). In comparison, this range of l-theanine content, as well as the range of Arg content in Longnan green tea were within the ranges reported in the literature for Japanese green tea (0.03–3.06 and 0.03–0.97 g/100 g, respectively), although the Glu content (0.007–0.44 g/100 g) was lower in the cited study [Unno et al., 2025]. These inter-regional differences likely reflect variations in tea cultivars, growing conditions, and processing techniques. It is important to note that processing techniques have a substantial influence on l-theanine content. For instance, the highest loss of l-theanine (nearly 50%) occurs during the withering stage, followed by the drying process [Sari & Velioglu, 2013]. This highlights the critical role of processing parameters in preserving l-theanine in green tea, which in turn reinforces the importance of l-theanine as a key determinant of tea quality.
Caffeine
WD green tea had the highest caffeine content among the three counties ranging from 3.68 to 4.62 g/100 g (Table 1). Given that the stimulating and invigorating effects of caffeine are positively correlated with its dosage [Choi et al., 2025], this suggests that WD green tea may possess a stronger stimulatory potential. The mean caffeine content in the WX green tea was of 3.84 g/100 g (ranging from 3.28–4.31 g/100 g), whereas KX had a mean value of 3.76 g/100 g (ranging from 3.30–4.44 g/100 g). Caffeine, as the major alkaloid in tea, constitutes 3–5 g/100 g of the dry weight and is crucial for the bitterness of tea [Yu et al., 2014]. Its content in tea is influenced by the age of the tea leaves, with younger, tender leaves generally having more caffeine [Xu et al., 2021]. Deka et al. [2021] reported that the caffeine content of popular tea varieties from northeastern India ranged from 2.71 to 4.87 g/100 g, which is similar to the results achieved in this study.
Crude fiber
Longnan green tea showed a crude fiber content ranging from 6.42 to 9.94 g/100 g (Table 1). The crude fiber content tends to lower when younger tea leaves are used during processing [Aroyeun, 2013] and may serve as an indirect indicator of tea quality [Śmiechowska & Dmowski, 2006]. In contrast to our study, the crude fiber content of commercial green tea from Pakistan has been reported to be as high as 16.16 g/100 g [Adnan et al., 2013], pointing to substantial differences in plucking standards and raw material selection criteria, with Longnan green tea being more tender compared to Pakistani commercial green tea.
Comprehensive evaluation of green tea quality using principal component analysis
PCA enabled the evaluation of the relative importance of each of the 14 indicators, thereby facilitating a comprehensive assessment of the quality of Longnan green tea. Results in Table 2 show that 5 principal components with eigenvalues greater than 1 were identified, contributing to a cumulative explained variance of 82.25%. The individual contribution rates for these components were 38.31%, 16.65%, 10.45%, 8.63%, and 8.22%, respectively. A cumulative contribution rate between 70% and 85% (or higher) is typically regarded as adequate in PCA for capturing the majority of the information presented in the original dataset [Shlens, 2014]. Therefore, the five principal components identified in this study could effectively capture the major intrinsic quality information of Longnan green tea, and can be considered as the representative of the essential features and internal variability of the dataset. The Kaiser-Meyer-Olkin (KMO) index of 0.607 and the significance level of 0.001 indicated that it was possible to conduct PCA on the data set. The closer the KMO value to 1, the smaller the partial correlation among variables, and the more suitable the data for factor analysis. Generally, it is considered that when the KMO value is greater than 0.6, the data is moderately suitable for factor analysis. Although the KMO value was slightly lower (0.607) in the test, the significance level was highly significant (p=0.001, much less than 0.05), indicating that the data were still suitable for PCA analysis [Shi et al., 2021].
Table 2
Loading coefficients of physicochemical indicators of Longnan green tea from three counties on the five principal components (PC1– PC5) and parameters including eigenvalue, variance contribution rate, and cumulative contribution rate for each component.
From the perspective of comprehensive score, it is known that PC1 and PC2 had the main role in the comprehensive quality evaluation, while PC3, PC4, and PC5 did not account for a large proportion. As shown in Table 2, variables such as C (−0.704), GCG (0.879), ECG (0.802), and FAA (0.635), along with EGC (−0.951) and EC (−0.809), exhibited relatively large loadings on PC1, which indicates that these variables contributed substantially to PC1. Meanwhile, TPS (−0.628) and Arg (0.750) displayed large loadings on PC2. The loading values reflected the degree to which each original variable influenced the principal component: the larger the absolute value of the loading, the greater the impact of the variable on the principal component. A positive loading signified a positive influence on the principal component, while a negative loading denoted a negative influence.
As shown in Table 3, the green tea samples with higher Y1 values, such as WD-3 (2.84) and WD-6 (3.03), had notably elevated levels of GCG, ECG and FAA. In contrast, the green tea samples with lower Y1 values, such as WX-2 (−5.09) and KX-4 (−3.77), tended to have higher EGC and EC contents. Moreover, higher Y2 values, such as in WX-5 (2.58), WX-6 (2.58), and WD-5 (3.46), suggested an elevated Arg content. The magnitude and sign of Y scores reflected the comprehensive characteristics of each tea sample. If certain indicators exhibited a strong negative correlation with a principal component, this might have resulted in a negative weighted composite Y value.
Table 3
Principal component analysis scores (Y1–Y5) and comprehensive score (Y) of Longnan green tea from different counties: Wenxian (WX), Wudu (WD), and Kangxian (KX).
Volatile organic compound composition of green tea
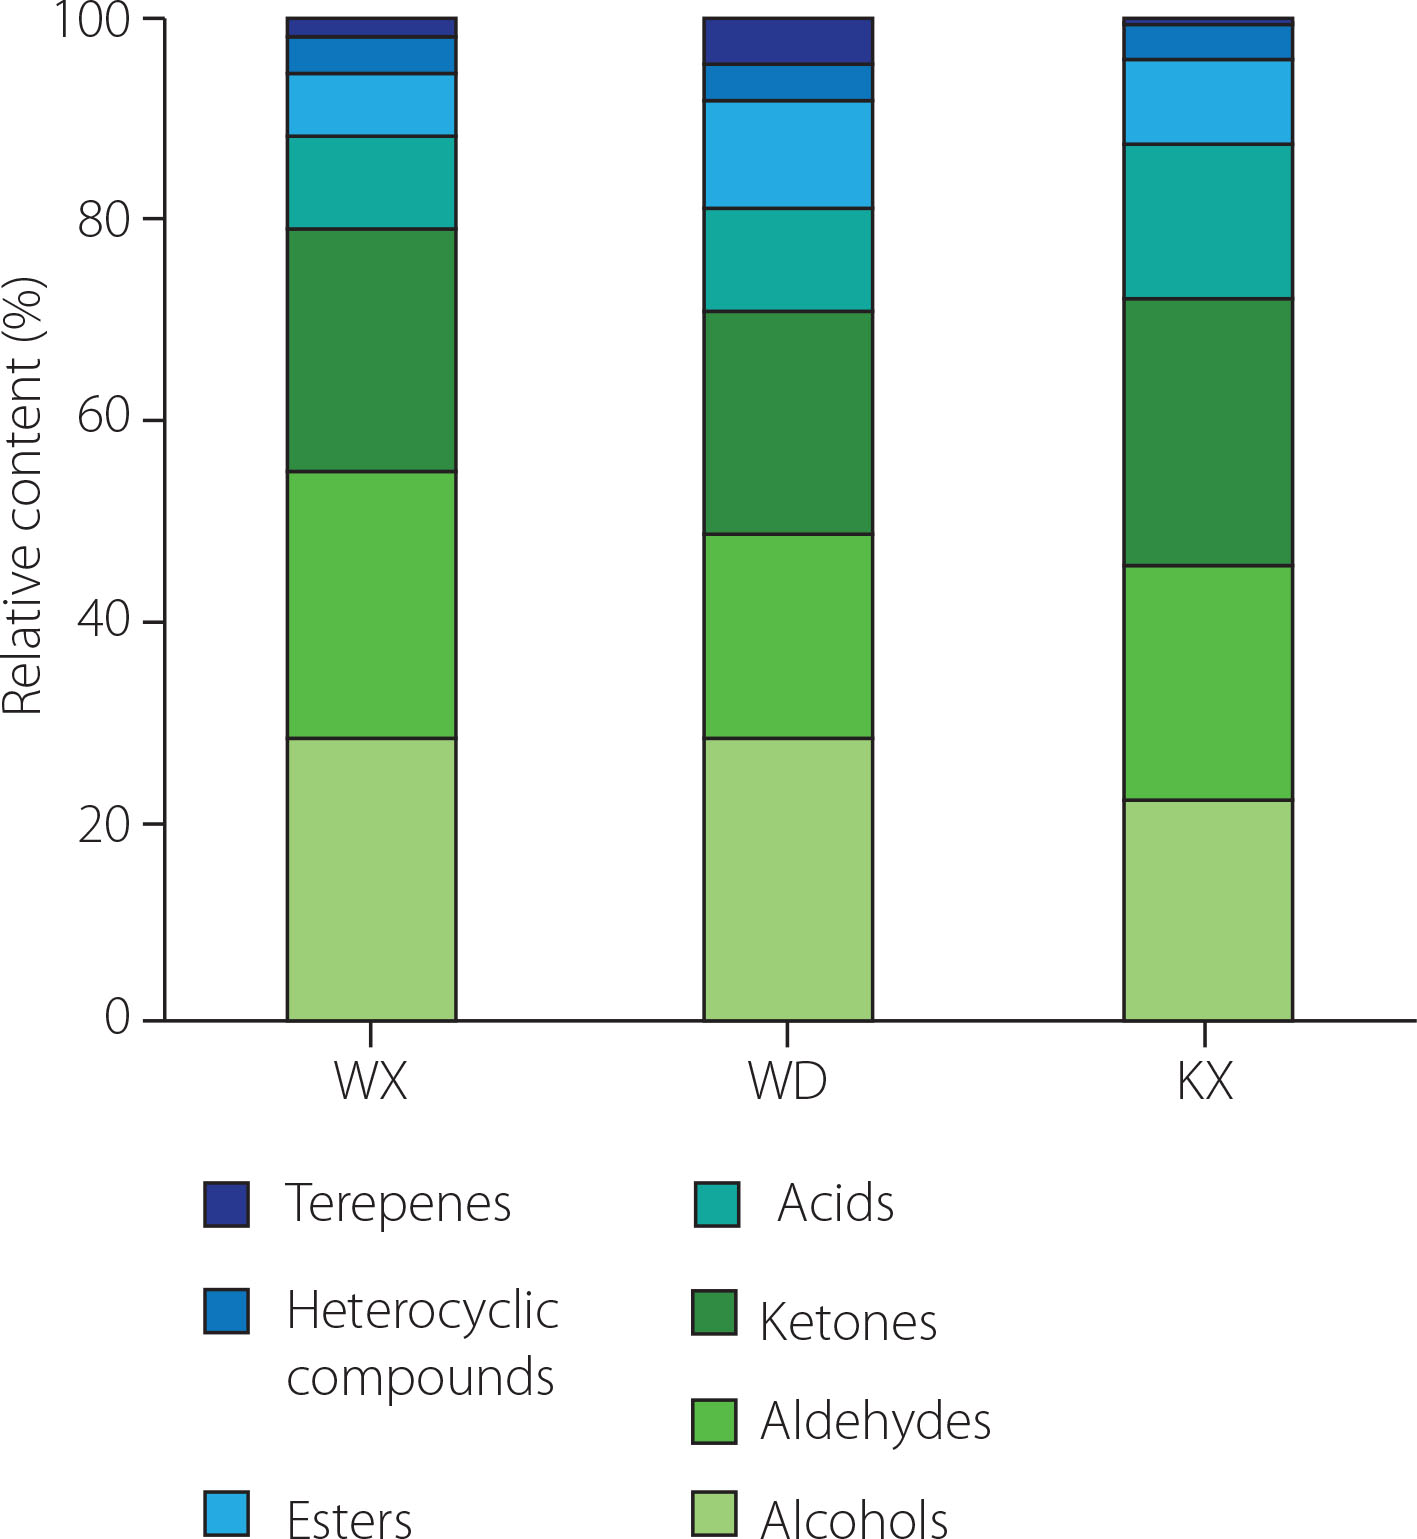
The VOCs were analyzed by HS-GC-IMS to reveal the differences in Longnan green teas. A total of 121 signal peaks were detected across the 24 samples (Table S2 in Supplementary Materials). Among these, 109 peaks were identified as corresponding to 72 different VOCs, comprising of 17 aldehydes, 17 alcohols, 18 ketones, 5 terpenes, 7 esters, 6 heterocyclic compounds, and 2 acids. The remaining 12 peaks could not be identified due to the limitations in the current commercial database.
As shown in Table S2, (Z)-2-penten-1-ol, 1-butanol, 1-propanol, ethanol, 1-penten-3-ol, and pentan-1-ol predominated among the 17 alcohols detected in green tea from three counties of Longnan. Ethanol, a key by-product of plant anaerobic respiration, is seldom regarded as an odor-active compound in tea. However, its presence in the tea infusion matrix might still affect the overall aroma profile of green tea [Huang et al., 2023]. The relative contents of (Z)-2-penten-1-ol and its adduct (D), 2-hexen-1-ol and its adduct (D), and 1-butanol D in green tea from WX were significantly higher than those determined in the green tea from the other two counties. The relative contents of 1,8-cineole and its adduct (D), 1-propanol D, and linalool were notably higher in the WD green tea compared to WX and KX green teas. Linalool is a key volatile contributing to floral and citrus aroma [Liu et al., 2023]. 1,8-Cineole has a camphoraceous scent and a cool herbal flavor, it is recognized as the major aromatic compound in ginger [Schaller & Schieberle, 2020], and has also been reported in tea aroma studies [Huang et al., 2023]. 2-Methylbutanal, hexanal, pentanal, heptanal, and propanal exhibited a high content among the 17 aldehydes detected in green tea from the three counties. 2-Methylbutanal, which is an important aroma compound of green tea, was recognized as one of the primary compounds responsible for the malt flavor [Tatsu et al., 2020]. 2,4-Heptadienal was significantly more abundant in the WX green tea compared to WD and KX green teas. It has a fatty floral aroma, while nonanal and heptanal are responsible for the green and fresh aroma of the tea infusion [Xiao et al., 2022]. The main ketones identified in all of the tea samples analyzed were 2,3-butanedione, 1-hydroxy-2-propanone, 1-penten-3-one, 2-butanone, cyclopentanone, acetone, and 3-hydroxybutan-2-one. The relative contents of 2,3-butanedione, 1-hydroxy-2-propanone, 3-hydroxybutan-2-one, and acetone were significantly lower in WD and WX green teas compared to the KX green tea. 2,3-Butanedione significantly affects the aroma quality of green tea and can sometimes result in a ‘cooked’ flavor [Tao et al., 2025; Yin et al., 2022]. The relative contents of α-pinene, 3-carene, β-pinene, and limonene were higher in the WD green tea than in WX and KX green teas. Limonene in tea products may contribute to the formation of fruity aromas, and as an intermediate in the synthesis of many monoterpenes, plays a significant role in the formation of these compounds [Zhou et al., 2024].
Figure 1 clearly illustrates significant differences in VOCs among green teas from different counties. Alcohols, aldehydes, and ketones accounted for the largest proportion of the total VOCs, corroborating the findings from studies on Guizhou green tea [Ge et al., 2024]. Specifically, the WX green tea exhibited the highest alcohol content (28.30%), closely followed by WD samples (27.92%), whereas the KX green tea recorded the lowest alcohol level (22.21%). In terms of aldehydes, the levels in WX (26.81%) and KX (23.67%) samples were both higher than that in the WD green tea (20.85%). The KX green tea had the highest ketone content (26.22%), exceeding that of WX (24.06%) and WD (22.15%) samples. For acids, the KX green tea presented a significantly higher content (15.36%) compared to WX (9.07%) and WD (10.29%) samples. Regarding esters, the WD green tea contained the greatest amount (10.50%), followed by KX (8.13%) and WX (6.30%) samples. Meanwhile, the content of heterocyclic compounds was relatively consistent across teas from all three counties, ranging from 3.5% to 3.9% and indicating limited variation in this category. Previous research has shown that volatile terpenes in tea could safely and effectively enhance its aroma [Zeng et al., 2019]. This study found that the WD green tea had the highest relative content of volatile terpenes at 4.43%, followed by the WX green tea at 1.94% and the KX green tea at 0.68%.
Results of multivariate statistical analysis
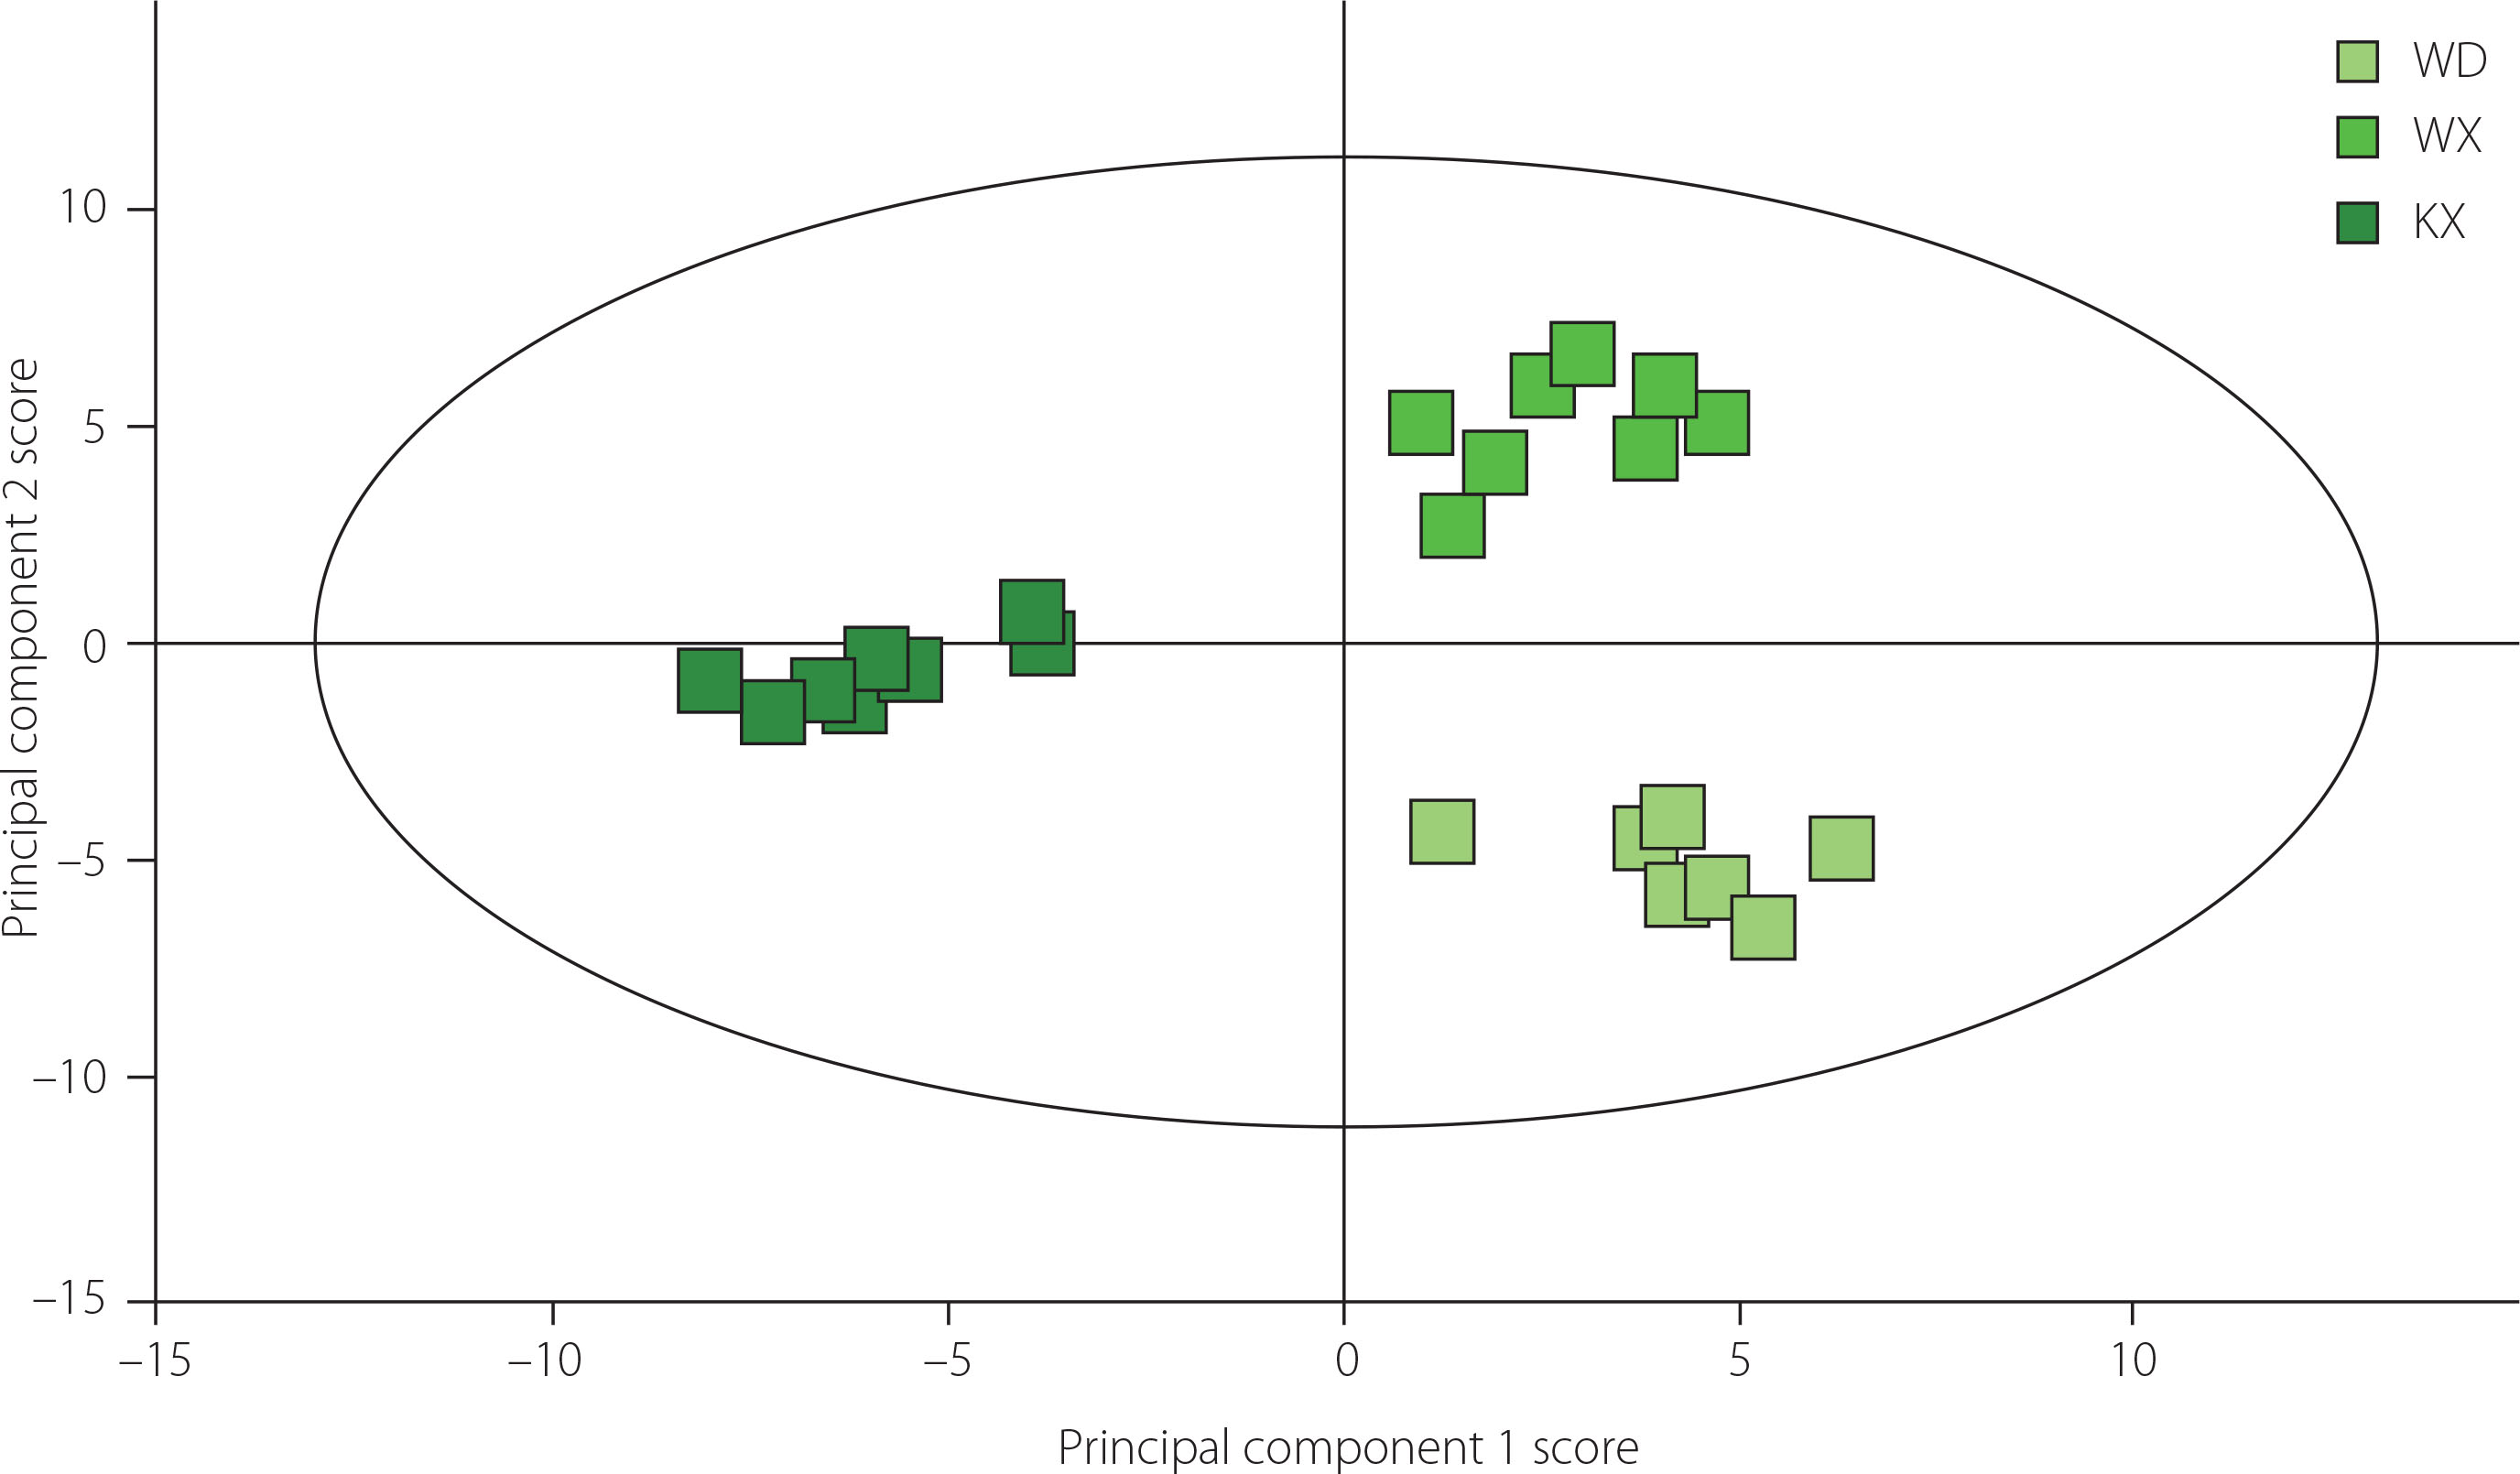
The differences in VOCs among Longnan green teas were analyzed using OPLS-DA based on the qualitative and quantitative results obtained from HS-GC-IMS. As shown in Figure 2, the KX green tea was distinctly located on the left side of the score plot, whereas WX and WD green tea samples were mainly clustered on the right, with WX samples positioned above and WD samples concentrated below. The dependent variable’s fit index (R2Y) was 0.937, the independent variable’s fit index (R2X) was 0.719, and the model’s predictive ability index (Q2) was 0.710. The R2 and Q2 values above 0.5 suggested that the model fitting results were acceptable.
Figure 2
Orthogonal partial least squares-discriminant analysis plot of Longnan green teas from different counties: Wenxian (WX), Wudu (WD), and Kangxian (KX).
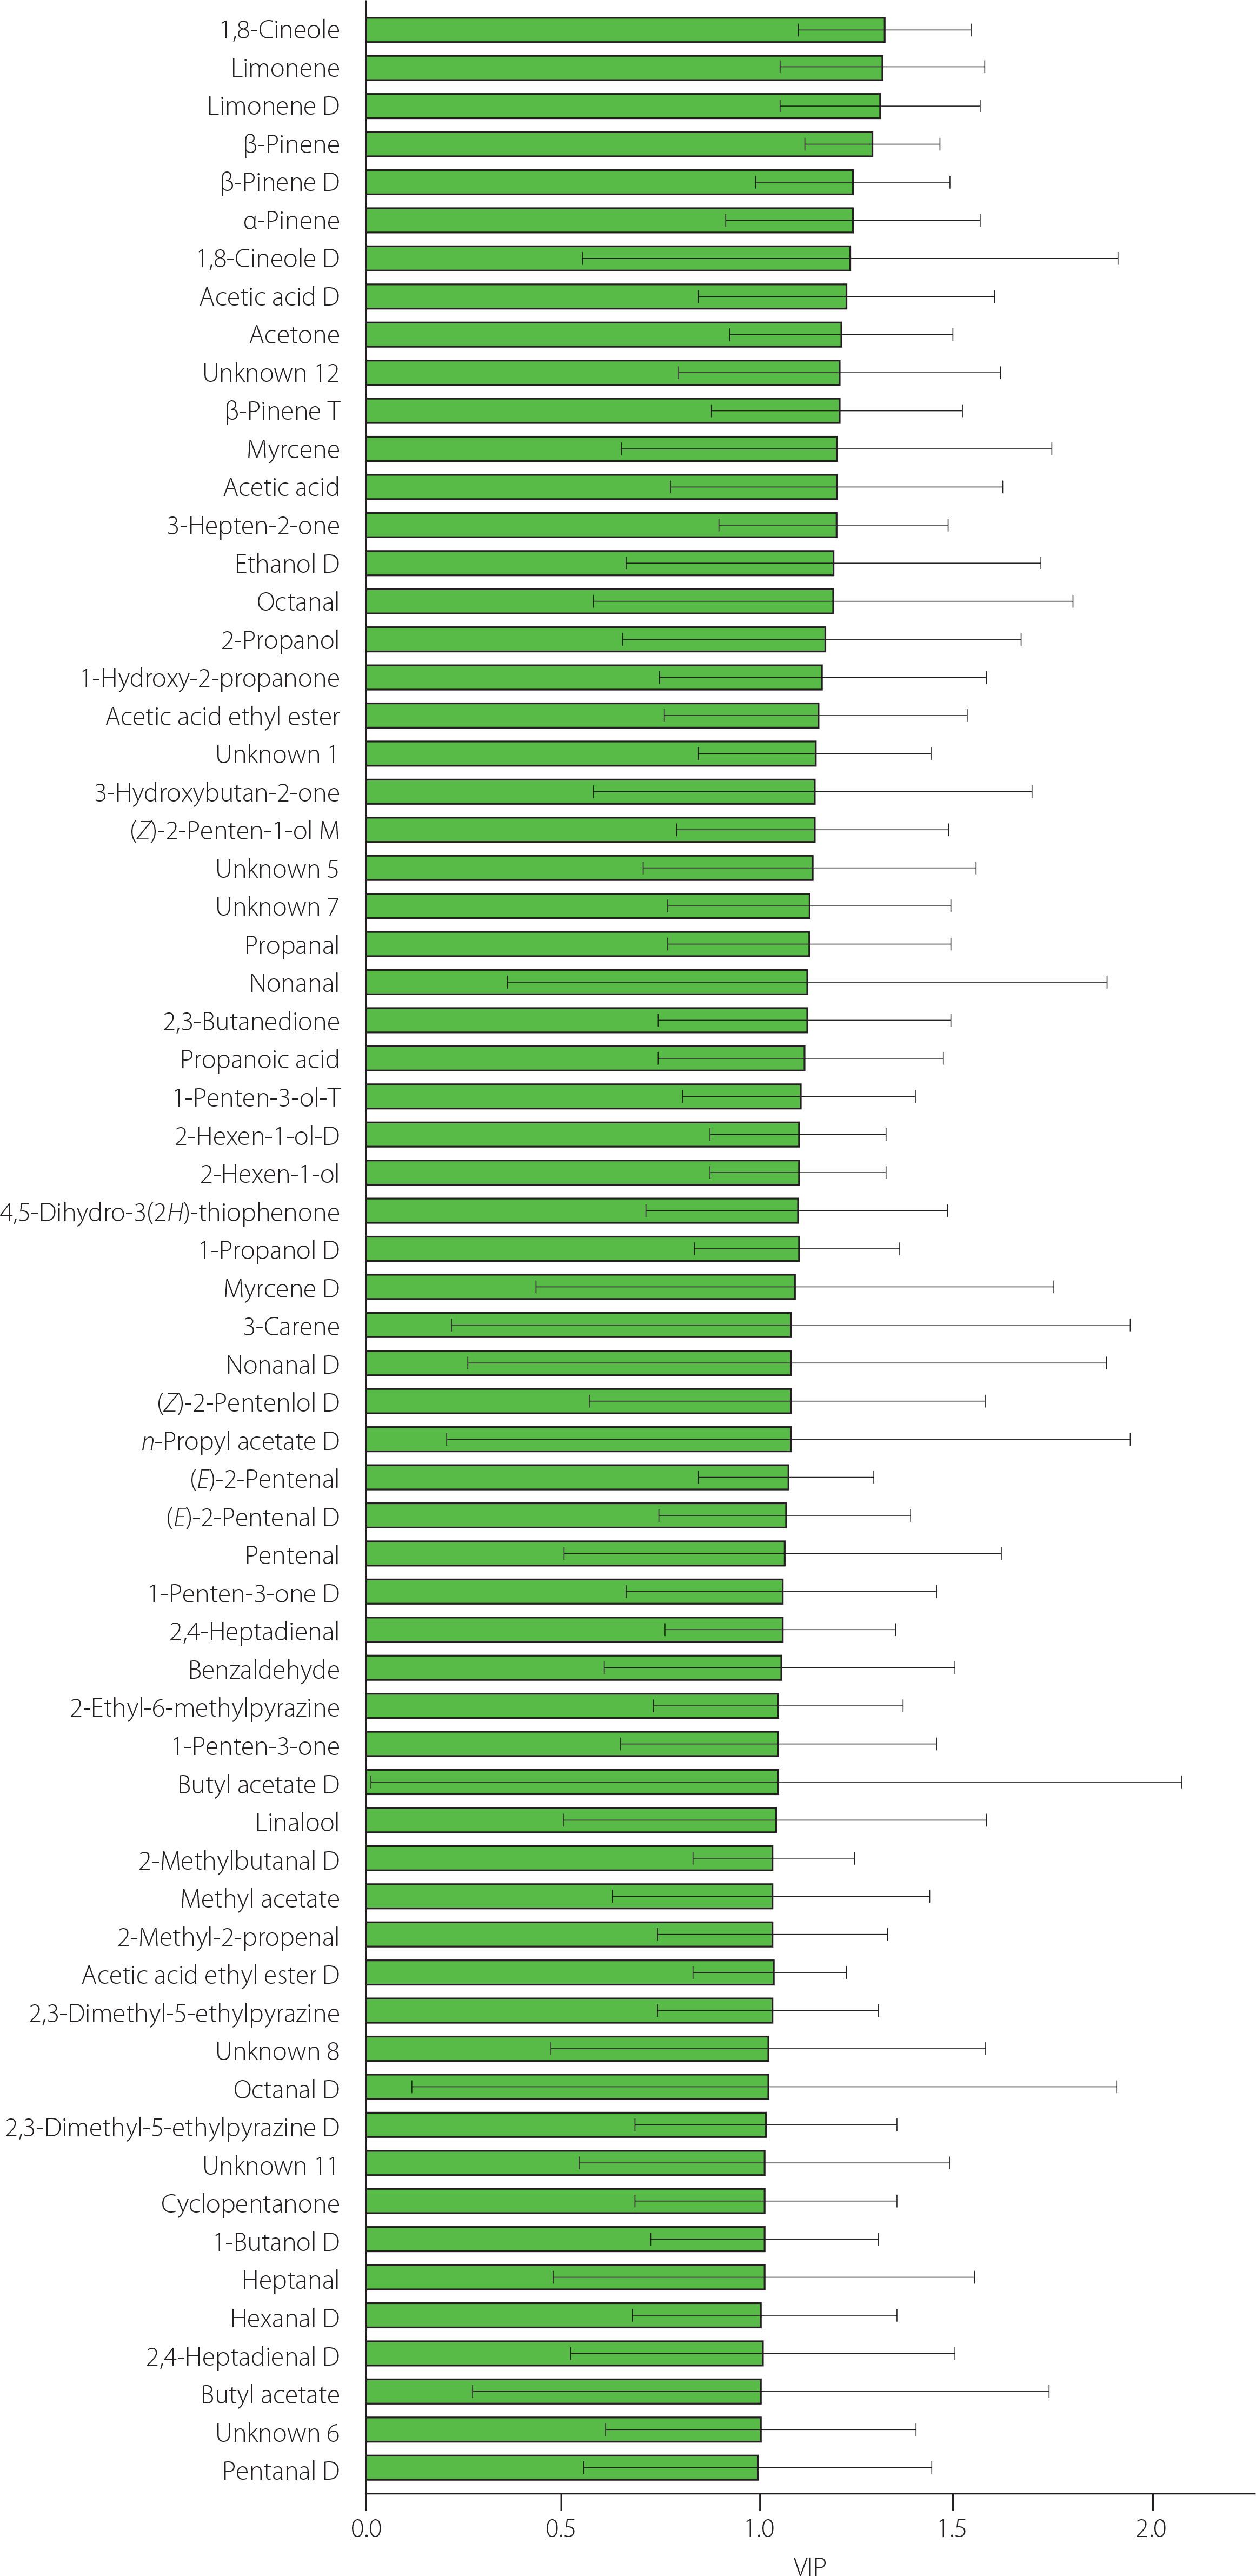
The validated OPLS-DA model was suitable for distinguishing the geographical origins of green tea VOCs. VIP scores were used to evaluate the contribution of each VOC to the classification. Variables with a VIP score greater than 1 were deemed critical. A total of 65 key VOCs with VIP>1 were identified (Figure 3).
Figure 3
Variable importance in the projection (VIP) scores for volatile organic compounds (VOCs) of Longnan green tea, analyzed by orthogonal partial least squares-discriminant analysis VOCs with VIP>1 are shown. D and T in the compound names indicate ion mobility spectrometry (IMS)-formed adducts, dimers and trimers, respectively.
To systematically differentiate the VOCs in green tea from three counties in Longnan, stringent statistical criteria (p<0.05 and VIP>1) were used and ultimately enabled identifying 52 key VOCs. These identified VOCs included 9 alcohols, 9 aldehydes, 7 ketones, 5 terpenes, 2 acids, 2 esters, and 1 pyrazine. The distribution of these differential VOCs was visualized through a clustered heatmap (Figure 4) to facilitate a better understanding of the aroma variations among the three counties. The graphical representation effectively illustrated the quantitative and qualitative VOC variations across geographical origins, providing an intuitive framework for interpreting regional flavor characteristics.
Figure 4
Cluster heatmap of key volatile organic compounds of Longnan green tea from different counties: Wenxian (WX), Wudu (WD), and Kangxian (KX). D and T in the compound names indicate ion mobility spectrometry (IMS)-formed adducts, dimers and trimers, respectively.
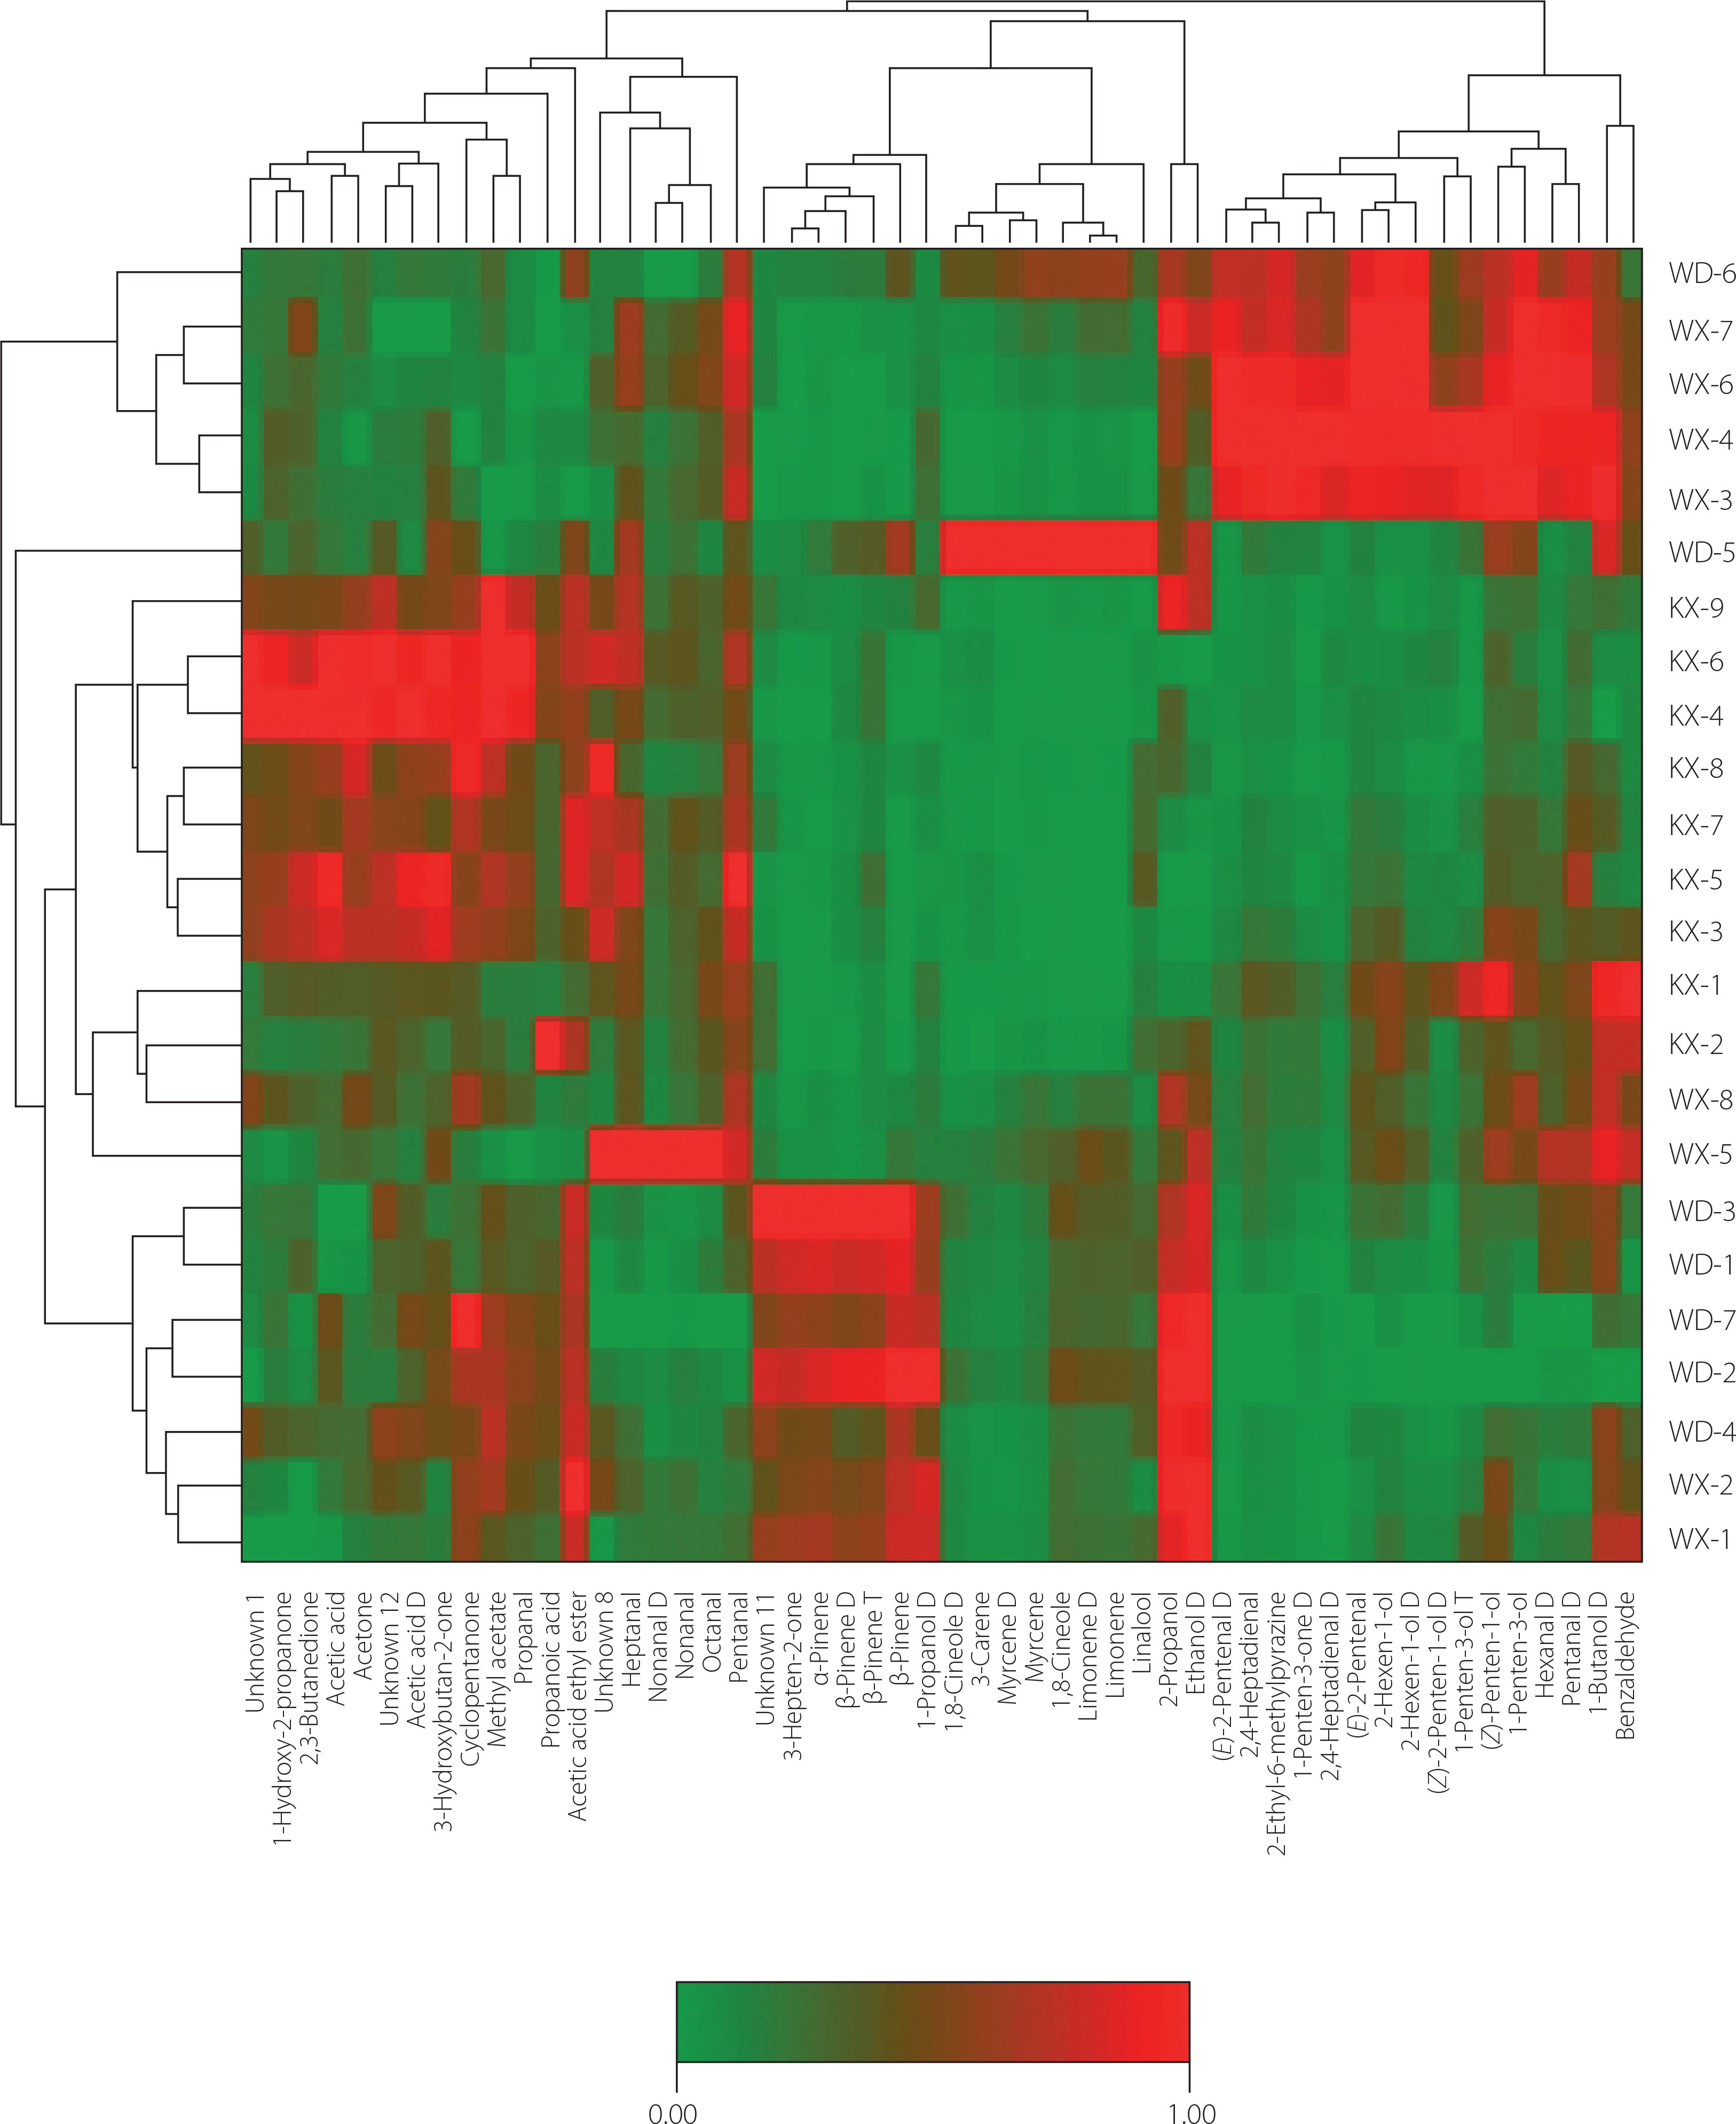
As shown in Figure 4, Longnan green tea samples exhibited significant differences in the relative content of these VOCs. In the heatmap, red indicated a higher content, whereas green indicated a lower content. Although green tea samples from the same county were not entirely clustered together, this did not negate the presence of county-specific aroma patterns. Specifically, the WX green tea samples contained higher levels of (E)-2-pentenal D, 2,4-heptadienal D, 2-ethyl-6-methylpyrazine, 1-penten-3-one D, 2-hexen-1-ol and its adduct (D), (Z)-2-penten-1-ol and its adduct (D), hexanal D, pentanal D, and 1-butanol D, which are mainly aldehydes, alcohols, and ketones. These compounds are primarily associated with fruity, green, nutty, vegetable, fatty, almond, and bitter almond aroma notes (Table S2). In contrast, the WD green teas exhibited higher contents of 3-hepten-2-one, α-pinene, β-pinene and its adducts (D and T), 1,8-cineole and its adduct (D), limonene and its adduct (D), myrcene and its adduct (D), 3-carene, 1-propanol D, and linalool, these compounds are predominantly terpenoids and mainly imparted fruity, lemony, floral, pine-like, and minty aromas, resulting in a richer aromatic profile of the WD tea samples (Table S2). Meanwhile, the KX green tea samples had elevated levels of acetic acid and its adduct (D), 2,3-butanedione, acetone, 3-hydroxybutan-2-one, cyclopentanone, methyl acetate, and propanal, which belong mainly to ketones, acids, aldehydes, and esters. These compounds are mainly associated with sour, creamy, pungent, green, floral, minty, and nutty flavor attributes (Table S2).
CONCLUSIONS
This study comprehensively analyzed the physicochemical qualities and profile of VOCs of green tea samples from three counties in Longnan (Wenxian, Wudu, and Kangxian). The findings provide valuable insights into the quality differences and characteristic profiles of green tea from these counties.
The analysis of 14 physicochemical quality indices revealed significant differences in 5 key parameters of Glu, TPS, water extract, caffeine, and FAA among the three counties. Comprehensive evaluation analysis indicated that the primary distinctions among green tea samples from different counties are manifested in their catechin composition and amino acid characteristics. The majority of green tea samples from WX and WD exhibited higher contents of GCG, ECG, and FAA, whereas most KX green tea samples demonstrated higher levels of EGC, C, and EC.
The HS-GC-IMS analysis identified 72 VOCs in Longnan green tea samples, predominantly consisting of aldehydes, ketones, and alcohols. Significant differences in VOC profiles were observed among the three counties. The WX green tea exhibited higher proportions of alcohols and aldehydes, such as (Z)-2-penten-1-ol, 1-butanol, and 2,4-heptadienal. The WD green tea contained a greater abundance of terpene compounds, such as α-pinene, β-pinene, and linalool. Comparatively, the KX green tea demonstrated a higher relative content of ketones than the teas from the other two counties.
Our research provides valuable objective data and characterizes the physicochemical and volatile profiles of Longnan green tea from three counties. Future studies should expand upon these findings by incorporating larger sample sizes and adopting more comprehensive analytical strategies including sensory evaluation, metabolomics, and advanced chemometric modeling. Such a multidimensional analytical framework would enable a more holistic understanding of the tea quality determinants and regional characteristics of Longnan green tea, ultimately facilitating the development of geographic indication protection systems and quality standards tailored to this important tea-producing region.