INTRODUCTION
The development of functional food products has been a recent trend aimed at minimizing the risk of non-communicable diseases (NCD), including osteoporosis and calcium deficiency. It was previously observed that consumers aged 36–50 years consider functional foods as an essential means to prevent osteoporosis and other NCD [Plasek et al., 2020]. Among many bioactive compounds, calcium and antioxidants (e.g., carotenoids and phenolics) are the key ones in preventing those issues [Kulczyński et al., 2024; Martiniakova et al., 2022]. In addition, the manufacture of functional food products utilizing locally sourced raw materials is encouraged to support sustainability, particularly by minimizing the carbon footprint.
Apple is known as a fruit with high productivity in Europe and across the world. According to the Food and Agriculture Organization (FAO), 18% of worldwide apple production was accounted for by Europe in 2023, amounting to more than 17.5 million tons [FAO, 2025]. Apple is widely consumed, either fresh (60–75%) or processed (20–40%) into various products including juice, cider, jam, and dried products, etc. [De la Peña-Armada & Mateos-Aparicio, 2022]. Furthermore, consuming dried fruit instead of unhealthy snacks may be a viable way to meet the World Health Organization’s (WHO) daily fruit intake recommendations and promote the adoption of a sustainable diet [Testa et al., 2023]. In our preliminary study, we developed a locally sourced apple-based healthy snack conventionally impregnated (at an atmospheric pressure) using local sea buckthorn (SB) juice. The optimized impregnation conditions were as follows: 93.8% (w/w) SB juice in water, 4% (w/w) calcium lactate (CaL) addition, 120 min, and 30°C [Arnold et al., 2025]. The application of these conditions resulted in freeze-dried products with improved calcium content and minimal loss of antioxidant activities, compared to those impregnated with inulin only and the untreated samples.
Non-conventional technologies, particularly vacuum impregnation (VI) and ultrasound-assisted impregnation (US), were studied to promote mass transfer during the impregnation process to a greater extent than the conventional (CON) or atmospheric impregnation, thus improving the functional properties of plant-based products, including apples [Panayampadan et al., 2022; Santarelli et al., 2020; Vasile et al., 2022]. The VI can promote the mass transfer process between the impregnating solution and solid porous food by intensifying the capillary flow in the cells due to the pressure gradients during the process. When vacuum pressure is applied, the internal cell pore volume becomes larger than under atmospheric pressure and thereby increases internal volume. The hydrodynamic mechanism (HDM) is initiated simultaneously, and the impregnating solution starts flowing into the capillaries until mass transfer equilibrium is reached. Subsequent restoration to atmospheric pressure is then applied, and the food is allowed to remain immersed during the relaxation time. During this phase, HDM and compression-induced deformation of the solid matrix take place, with external pressure acting as the driving forces. The cell pores of food eventually become filled with the impregnating solution, altering the physicochemical and functional properties of the product [Panayampadan et al., 2022]. Following the application of high-power US (high intensity, >1 W/cm2; low frequency, 18–100 kHz), the phenomena, such as sponge effect and cavitation, occur in liquids or solids containing moisture [Nowacka et al., 2021]. These phenomena cause the formation of microbubbles in the material and improve mass transfer during the impregnation process.
The application of VI to improve the functional properties of apple-based products has been recently reported using blueberry juice and CaL at 200 mbar [Castagnini et al., 2021], apple-peer juice at 40–80 mbar [Pasławska et al., 2019], grape juice concentrate at 133–667 mbar [González-Pérez et al., 2022], and lemon juice at 738 mbar [Santarelli et al., 2020]. In turn, applications in apple-based products using vitamin B12 (24 kHz, 400 W) [Vasile et al., 2022] and chokeberry juice concentrate (40 kHz, 0.1 W/g) [Masztalerz et al., 2021] have been reported for the US treatment. Some studies also demonstrated synergistic effects of US and VI using a hibiscus extract solution [Dinçer, 2022], a mixture of black carrot phenolics and CaL [Yılmaz & Ersus Bilek, 2018], aloe vera juice [Trusinska et al., 2024], and chokeberry juice concentrate [Masztalerz et al., 2021].
To the best of our knowledge, to date, the application of VI and US to improve the functional properties of plant matrices has not been carried out using SB juice, without or with CaL. It is worth noting that SB is abundant in Europe and Asia, and is rich in lipo- and hydrophilic antioxidants, as well as other health-promoting compounds, such as vitamins and minerals, that can promote the general health of consumers [Ciesarová et al., 2020]. Therefore, this study aimed to investigate the antioxidant activities and calcium content of freeze-dried Gala apples after the application of VI and US using SB juice without and with CaL, in comparison to CON treatment, highlighting the novelty of VI and US with SB juice to enhance the functional properties of apples based on our previous study [Arnold et al., 2025]. The mass-transfer phenomena after impregnation (before freeze-drying), color, enzyme activities (including polyphenol oxidase (PPO) and peroxidase (POD)), and composition of antioxidants of freeze-dried products were analyzed as well.
MATERIALS AND METHODS
Raw materials and chemicals
Apples (Malus domestica Borkh. cv. Gala) were purchased from a local market in Cesena, originating from VOG s.a.c. in Terlan, South Tyrol, Italy. A homogeneous batch of apples (20 kg) was transported to the laboratory of the Department of Agricultural and Food Sciences (DISTAL) of the University of Bologna in Cesena, and randomly divided into 16 treatment groups: 2 controls – FA and FA+AA; and 14 impregnated samples – CON, VI (200, 400, 600 mbar), US (10, 20, 30 min), each prepared without and with CaL. An equal weight of apples was allocated to each group. All the samples were stored at 4°C and processed within a week. The apples were washed, peeled, cored, and sliced to a thickness of 5 mm to obtain the C-shaped slices. The slices were then dipped for 2 min in a 1% (w/v) ascorbic acid (Sigma Aldrich, St. Louis, MO, USA) solution, at a sample to solution ratio of 1:4 (w/v) to delay enzymatic browning. The raw fresh apple flesh (FA) and those dipped in a 1% (w/v) ascorbic acid solution (FA+AA) were used as the controls, each in triplicate. The organic sea buckthorn (SB) (Hippophae rhamnoides L.) juice was purchased from KoRo (Berlin, Germany), with SB fruits grown in an organic farm in Brandenburg, Germany. The calcium l-lactate hydrate was purchased from Sigma Aldrich. Prior to impregnation treatment, the total soluble solid content of raw FA, raw FA+AA, SB juice, and the final impregnating solution was measured using a DBR 95 digital refractometer (XS Instruments, Carpi, Italy).
All chemicals were purchased from Sigma Aldrich, including 2,2′-azino-bis(3-ethylbenzothiazoline-6-sulfonic acid) diammonium salt (ABTS), 2,2-diphenyl-1-picrylhydrazyl (DPPH), 2,2ʹ-azobis(2-methylpropionamidine) dihydrochloride (AAPH), fluorescein sodium salt, sodium acetate trihydrate, 2,4,6-tris(2-pyridyl)-s-triazine (TPTZ), iron(III) chloride hexahydrate, iron(II) sulfate heptahydrate, (±)-6-hydroxy-2,5,7,8-tetramethylchromane-2-carboxylic acid (Trolox), Folin-Ciocalteu’s phenol reagent, acetic acid, gallic acid, hydrochloric acid, 65% nitric acid, methanol, potassium persulfate, sodium carbonate, lanthanum(III) chloride, monopotassium phosphate, disodium phosphate, polyvinylpolypyrrolidone (PVPP), catechol, and guaiacol. ACL (lipid-soluble substances) and ACW (water-soluble substances) reagent kits were purchased from Analytik Jena (Jena, Germany). The solvents for ultra-performance liquid chromatography (UPLC) method were bought from Sigma Aldrich. The standards of phenolic compounds included phenolic acids (chlorogenic acid), flavan-3-ols ((±)-(epi)catechin, procyanidin B1), dihydrochalcones (phloretin 2-O-xyloglucoside), flavonols (quercetin 3-O-glucoside and isorhamnetin 3-O-glucoside) and carotenoids (lutein, zeaxanthin, β-carotene) were obtained from Extrasynthese (Genay, France).
Impregnation of apples using sea buckthorn juice and calcium lactate
The impregnation process was divided into three types: conventional (CON) and non-conventional which included vacuum (VI) and ultrasound-assisted impregnation (US). The impregnating solution and process were designed based on the optimization from a preliminary study [Arnold et al., 2025]. The impregnating solution consisted of 93.8% (w/w) SB juice in water, with 0 and 4% (w/w) calcium lactate (CaL); these conditions were chosen as they ensured the optimum antioxidant capacity and calcium content of freeze-dried Gala slices when impregnated under CON conditions at 30°C for 120 min. The sample to solution ratio of 1:5 (w/w) was chosen to prevent concentration changes during the treatment. Each CON, VI, and US treatment was carried out in triplicate using independent samples of Gala apples (raw FA+AA) before freeze-drying, and the samples were analyzed accordingly.
In the CON treatment, the raw FA+AA was impregnated in the solution in a parafilm-wrapped beaker at an atmospheric pressure. The samples were continuously shaken at 100 rpm, 30°C, for 120 min (Shaker 709, ASAL, Milan, Italy). For the VI treatment, the solution was conditioned at 30°C for 5 min prior to the treatment. The raw FA+AA was then immersed in the beaker containing the solution and the VI was carried out in a closed chamber connected to a vacuum pump and an automatic controller system (AVCS, S.I.A., Bologna, Italy). The VI treatments were performed at three different absolute pressures 200, 400, and 600 mbar. The total duration of each VI treatment was 28 min, consisting of 4 min to decrease the pressure to 200, 400, or 600 mbar; 10 min of holding time at those pressures; 4 min to recover the pressure to the atmospheric pressure; and 10 min of relaxation at the atmospheric pressure at 30°C [Kidoń et al., 2023]. For the US treatment, the raw FA+AA was immersed in the beaker containing the solution, and the US treatment was conducted for 10, 20, and 30 min (25 kHz, 1,000 W, 30°C) in an ultrasonic bath (Xtra ST 600H, Elmasonic, Singen, Germany). During the US treatment, the temperature was kept constant at 30°C by a recirculating cooler (FL601, Julabo, Seelbach, Germany) with a coil exchanger inserted in the treatment tank. The water temperature was controlled by a probe thermometer throughout the treatment. A negligible increase in temperature (up to 1°C depending on the treatment time) was observed during the treatment. Afterwards, the conventional impregnation process was conducted for additional 110, 100, and 90 min for US treatments of 10, 20, and 30 min, respectively to reach the total impregnation time of 120 min.
After the CON, VI, and US treatments, the samples were removed from the solutions, drained, and blotted using absorbing paper, and their weight was recorded for mass transfer analysis. Moreover, water activity was also measured on the whole samples, while color and chemical analyses were performed on freeze-dried samples. For the freeze-dried samples, the control and treated samples were frozen at −40°C for 24 h, and freeze-dried for 48 h (Lio2000, CinquePascal S.r.l., Milan, Italy). All samples with related abbreviations are described in Table 1.
Table 1
Codes of apple flesh control samples without (FA) and with dipping in an ascorbic acid solution (FA+AA), and apple flesh samples subjected to conventional (CON), and non-conventional impregnation (vacuum impregnation, VI, and ultrasound-assisted impregnation, US).
| Sample codes | Dipping time (min) | VI pressure (mbar) | US time (min) | CON time (min) |
|---|---|---|---|---|
| FA | – | – | – | – |
| FA+AA | 2 | – | – | – |
| CON | 2 | – | – | 120 |
| VI_200 | 2 | 200 | – | 10* |
| VI_400 | 2 | 400 | – | 10* |
| VI_600 | 2 | 600 | – | 10* |
| US_10 | 2 | – | 10 | 110** |
| US_20 | 2 | – | 20 | 100** |
| US_30 | 2 | – | 30 | 90** |
Analysis of mass transfer phenomena and water activity
After the impregnation treatment, the weight gain/loss, water gain/loss, and solid gain/loss of the samples were calculated according to Equations (1), (2) and (3), respectively, with the note that positive and negative calculated values refer to the gain and loss, respectively:
where: m0 is initial weight before the impregnation process (kg), mt is weight after impregnation process at time t (kg), xw0 is initial water mass fraction (kg/kg), xwt is water mass fraction after the impregnation process at time t (kg/kg), xST0 is initial total solids (dry matter) mass fraction (kg/kg), and xSTt is total solids (dry matter) mass fraction after the impregnation process at time t (kg/kg).
The moisture and dry matter contents were determined by drying the samples at 70°C until the weight was constant [AOAC, 2002]. The water activity (aw) was measured by an aWLife meter (WaterLab, Steroglass S.r.l., Perugia, Italy) at 25°C. All analyses were conducted in triplicate.
Color analysis
The color measurement of SB juice and the surface of freezedried samples before grinding was performed in ten repetitions using a ColorFlex EZ colorimeter (HunterLab, Reston, VA, USA) in the CIE L*a*b* scale. Prior to measurement, the colorimeter was calibrated using a black and white tile (L* 93.47, a* 0.83, b* 1.33). The L* (lightness), a* (greenness/redness), and b* (blueness/yellowness) of the sample were measured, and total color difference (ΔE), browning index (BI) [Buera et al., 1985], whiteness index (WI) [Judd & Wyszecki, 1963], and yellowness index (YI) [Francis & Clydesdale, 1975] were calculated using Equations (4), (5), (6), and (7), respectively:
where: ΔL*, Δa*, and Δb* are the differences of L*, a*, and b*, respectively, between FA+AA and other analyzed samples. where:Determination of total phenolic content and antioxidant capacity
The freeze-dried powder was extracted using 80% methanol (v/v) at a sample-to-solvent ratio of 1:20 (w/v). The SB juice (filtered through a 0.45 µm membrane, Membrane Solutions, Auburn, WA, USA) was diluted in 80% methanol (v/v) at a sample-to-solvent ratio of 1:10 (w/v). The samples were shaken in a water bath at 150 rpm, and 50°C for 120 min. After cooling to room temperature, the samples were centrifuged (4°C, 12,000×g, 10 min) and filtered to obtain the supernatant. The extraction was conducted in duplicate, and the obtained extracts were used to determine the total phenolic content and antioxidant capacity.
The total phenolic content (TPC) was determined in triplicate by the Folin-Ciocalteu assay following a previous report [Singleton & Rossi, 1965], in which the absorbance of the extracts was measured at λ=725 nm using an SP-880 spectrophotometer (Metertech, Taipei, Taiwan). The TPC was expressed as mg gallic acid equivalent (GAE) per 100 g of product.
The ABTS, DPPH, ferric-reducing antioxidant power (FRAP), oxygen radical absorbance capacity (ORAC), and photochemiluminescence (PCL) assays were carried out in triplicate to determine the antioxidant capacity of the products. The ability of the samples to reduce the ABTS cation radical was measured spectrophotometrically using an SP-880 spectrophotometer (Metertech) set at λ=734 nm after 6 min of incubation of the reaction mixture containing the extract and ABTS cation radicals generated with potassium persulfate, according to a previous report [Re et al., 1999]. The results were expressed as mg Trolox equivalent (TE) per 100 g of product.
The DPPH radical scavenging activity was determined as described previously [Sánchez-Moreno et al., 1998]. The absorbance of the reaction mixture containing the extract and DPPH radicals was measured at λ=515 nm after incubation in the dark for 20 min. The results were expressed as mg TE per 100 g of product.
FRAP of the samples was determined according to the Benzie & Strain [1999] method. The FRAP reagent was prepared by mixing the acetate buffer (pH 3.6), 10 mM TPTZ solution in 40 mM HCl, and 20 mM of FeCl3×H2O solution at the ratio of 10:1:1 (v/v/v). The extract was added to the prepared reagent and incubated at 37°C for 4 min. The reduction of TPTZ-Fe3+ to TPTZ-Fe2+ with the presence of antioxidants was assessed at λ=593 nm. The results were presented as mmol Fe(II) per 100 g of product.
The ORAC assay measured the AAPH-generated peroxyl radicals scavenging ability of the antioxidants in the sample extracts, using a fluorescein solution [Ou et al., 2001]. The readings were taken at a given excitation (λ=493 nm) and emission wavelength (λ=515 nm) on an F-2700 fluorescence spectrophotometer (Hitachi, Kyoto, Japan). The results were presented as mg TE/100 g of product.
The PCL assay was performed using a Photochem apparatus (Analytik Jena, Germany). In this assay, the superoxide anion radicals (O2•–) were produced by optical excitation of a photosensitizer. The antioxidant capacity of the samples against the radicals was detected with the presence of chemiluminogenous compound – luminol. The antioxidant capacity of lipid-soluble (ACL) and water-soluble (ACW) substances of the extract was measured according to the protocol and using the reagent kits from the manufacturer. Additionally, the integral antioxidant capacity (IAC) was calculated as the sum of ACL and ACW [Besco et al., 2007]. The results were presented as mg TE per 100 g of product.
Determination of calcium content
The calcium content of SB juice, raw FA, raw FA+AA, and freezedried samples was determined in triplicate by atomic absorption spectrometry (Hitachi Z2000, Tokyo, Japan) using the air-acetylene flame, following a previous study [Suliburska & Krejpcio, 2014]. The complete mineralization of 1 g of the sample was performed in a muffle furnace at 450°C for 72 h. The obtained ash was then dissolved in 1 M nitric acid and diluted in 0.5% LaCl3 solution. The methods were validated by simultaneous analysis of the reference material (Soya Bean Flour, INCT-SBF-4) with 95.7% accuracy for calcium. Deionized water and acid-washed glassware were used in this study. The results were presented as mg Ca per 100 g of product.
Quantification of phenolics and carotenoids
The extraction of phenolics and carotenoids of the selected freeze-dried samples, followed by their quantification using ultra-performance liquid chromatography with photodiode array detection (UPLC-PDA; ACQUITY UPLC system, Waters Corporation, Milford, MA, USA) was performed following a previous study [Tkacz et al., 2020]. To extract phenolics, 0.5 g of powdered samples was mixed with 5 mL of 70% methanol (v/v, in water) with 2% (w/v) ascorbic acid and 1% (v/v) acetic acid, followed by 15 min of sonication (35 kHz; Sonorex RK514H, Bandelin, Berlin, Germany). The mixtures were stored at 4° for 24 h C, and sonication was repeated once afterwards. The supernatants from centrifugation at 14,000×g, 4°C for 10 min performed using an MPW-352R centrifuge (MPW MED. Instruments, Warsaw, Poland) were collected and filtered through a syringe filter with a polytetrafluoroethylene (PTFE) membrane, 0.20 µm (Millex Samplicity Filter, Merck, Darmstadt, Germany). The filtrate phenolic compound separation was carried out using an ACQUITY UPLC BEH C18 column (1.7 µm, 2.1×100 mm, Waters Corporation), which temperature was maintained at 30°C. The injection volume was 5 µL and the elution, using a mobile phase consisting of 2% (v/v) formic acid (solvent A) and 100% acetonitrile (solvent B) applied in a gradient system, was completed in 15 min with a flow rate of 0.42 mL/min. The gradient program started with 98–65% solvent A (to 12 min), and then to 0% (to 14 min), the gradient returned to the initial composition (98% A) until 15 min for held constant to re-equilibrate the column. Identification of compounds was conducted based on retention times and PDA spectra of standards and using literature data [Tkacz et al., 2020]. For quantification, the absorbance was measured at 280 nm for flavan-3-ols expressed as (±)-(epi)catechin equivalents (calibration curve in a concentration range of 5–10 mg/L; R2=0.9978), procyanidin B1 (5–10 mg/L; R2=0.9995) and dihydrochalcones expressed as phloretin 2-O-xyloglucoside equivalents (10–20 mg/L; R2=0.9992); at 320 nm for phenolic acids expressed as chlorogenic acid equivalents (10–25 mg/L; R2=0.9989); and at 360 nm for flavonols expressed as quercetin 3-O-glucoside and isorhamnetin 3-O-glucoside equivalents (10–25 mg/L; R2=0.9995 and 0.9957, respectively).
For carotenoid extraction, in dark conditions, 0.4 g of the powdered samples and 10% MgCO3 solution were shaken with 4 mL of a mixture of hexane, acetone and methanol (2:1:1, v/v/v) with 1% butylated hydroxytoluene (w/v) (300 rpm, 15 min; DOS-10L Digital Orbital Shaker, ELMI, Riga, Latvia). Supernatants were collected after centrifugation (same as phenolics extraction). The extraction was repeated two (for FA and FA+AA) to three times (for CON, VI, and US). The combined supernatants underwent evaporation (XcelVap, Biotage, Uppsala, Sweden), and the residues were diluted in a mixture of methanol and tetrahydrofuran (4:1, v/v). Solutions were filtered through PTFE syringe filters before injection. UPLC-PDA separation of carotenoids was performed at 32°C using the ACQUITY UPLC BEH Shield RP C18 column (2.1×100 mm, 1.7 μm; Waters Corporation) with a C18 guard column. A volume of 10 µL was injected, and the flow rate of the mobile phase was 0.5 mL/min. The mobile phase was used in a gradient system of 0.1% (v/v) formic acid, (solvent A) and a mixture of acetonitrile and methanol (7:3, v/v) (solvent B). The elution started with 25% A (to 0.60 min); 4.9% A (to 6.50 min); 0% A (to 13.60 min); 25% A (to 16.60 min). The analysis was monitored at wavelength of 450 nm, and the spectra were measured. Carotenoids were identified by comparing their retention times and spectra with those of standards and using literature data [Tkacz et al., 2020]. Quantification was performed based on standard curves for lutein (5–10 mg/L; R2= 0.9994), zeaxhantin (5–15 mg/L; R2= 0.9979), and β-carotene (10–25 mg/L; R2= 0.9999).
The results of UPLC-PDA analyses were calculated as the mean of two replicates and expressed as mg per 100 g of freeze-dried product.
Determination of polyphenol oxidase and peroxidase activity
Polyphenol oxidase (PPO) and peroxidase (POD) activities in selected freeze-dried samples were measured according to the method described previously [Sikora et al., 2020]. The product extraction for enzyme activity measurements was performed at 4°C. About 0.3 g of the powdered freeze-dried sample was mixed vigorously with 2 mL of 0.067 M Sorensen’s phosphate buffer solution (SPBS, pH 7.0, determined previously as the optimal pH in freeze-dried apple for both PPO and POD activities) and 0.02 g of PVPP. The mixtures were shaken at 1,400 rpm for 30 min (thermo-shaker TS-100C, Biosan, Riga, Latvia). The supernatant was collected for further analysis, after centrifugation at 12,000×g.
The final reaction mixture for PPO activity measurement consisted of 50 µL of extract, 900 µL of 0.067 M SPBS (pH 7.0), and 50 µL of 0.5 M catechol as the substrate. For the POD activity measurement, the final reaction mixture contained 100 µL of extract, 800 µL of 0.067 M SPBS (pH 7.0), 50 µL of 0.04 M H2O2, and 50 µL of 0.04 M guaiacol as the substrate. The absorbance changes (∆A) with the time at 420 and 470 nm for PPO and POD activity, respectively, were monitored at 25°C using a UV-Vis spectrophotometer (UV-1280, Shimadzu, Kyoto, Japan). The absorbance was linear with the time at the first 3 min. The amount of enzyme that changes an absorbance 0.001 per min under the specified conditions was defined as one unit (U) of enzyme activity. The PPO and POD activities were determined in triplicate for each product, and results were expressed in unit of enzyme activity per g of product (U/g product).
Statistical analysis
The differences between treatments with 0 and 4% CaL were analyzed by a T-test. One-way analysis of variance (ANOVA) followed by Tukey’s post hoc test was used to compare FA, FA+AA, CON, US, and VI at the same CaL concentration (before and after freeze-drying) and also to compare SB juice, raw FA, and raw FA+AA. Analyses ware performed using the Statistica 13.1 software (StatSoft Inc., Krakow, Poland). Principal component analysis (PCA) was carried out to explore the distribution of antioxidant capacity, calcium, dry matter, and ash content, as impacted by impregnation processes. Visualization of PCA was conducted using OriginPro 10.1 (OriginLab Corporation, Northampton, MA, USA). The significance level of 95% was considered in this study.
RESULTS AND DISCUSSION
Physicochemical and functional properties of raw materials
This research used SB juice as the main ingredient of the impregnating solution of Gala apple flesh. The physicochemical parameters and antioxidant capacity of the SB juice, as well as raw apple flesh (FA), and FA after dipping in 1% (w/v) ascorbic acid solution (raw FA+AA) are shown in Table 2. The content of total soluble solids of SB juice reached 5.03°Brix, and was lower than those of the raw FA and FA+AA. This SB juice from fruits grown in an organic farm in Germany had a slightly lower content of total soluble solids than Polish (5.7–7.2°Brix) [Tkacz et al., 2019] or Chinese (6.97–13.50°Brix) SB juice [Zhang et al., 2024]. The impregnating solution consisting of 93.8% (w/w) SB juice in water with 0% CaL had 4.53±0.15°Brix, and that with 4% CaL had 7.47±0.06°Brix of total soluble solids, which was slightly hypotonic compared to raw FA+AA (8.80°Brix).
Table 2
Physicochemical properties and antioxidant capacity of sea buckthorn (SB) juice, raw fresh apple flesh, without (FA) and with dipping process in an ascorbic acid solution (FA+AA).
[i] The results are presented as mean ± standard deviation. Different lowercases mean significant differences (p<0.05) between samples within the same row. TPC, total phenolic content; ABTS, ABTS radical cation scavenging activity; DPPH, DPPH radical scavenging activity; FRAP, ferric-reducing antioxidant power; ORAC, oxygen radical absorbance capacity; PCL-ACL and PCL-ACW, photochemiluminescence assay – antioxidant capacity of lipid- and water-soluble substances, respectively; PCL-IAC, integral antioxidant capacity in PCL assay; GAE, gallic acid equivalent; TE, Trolox equivalent.
SB juice contained 11.83 mg Ca/100 g, which was more than twice the amount found in apples (Table 2). This value was comparable to the calcium content of SB juice from Poland (12.7 mg Ca/100 g) or other countries (2.1–10.9 mg Ca/100 g) [Ciesarová et al., 2020]. In terms of TPC and antioxidant capacity, SB juice generally showed significantly higher values than raw FA and FA+AA. We hypothesize that, with better chemical composition than apple, SB juice, with or without 4% CaL, could be beneficial in improving the functional properties of apple in the form of freeze-dried chips through conventional and nonconventional impregnation processes.
Mass transfer phenomena and water activity
The mass transfer results of the impregnated FA+AA prior to freeze-drying are presented in Table 3. Regardless of the pressure and the CaL concentration used, the VI caused a significant weight and water gain of ascorbic acid-treated apple flesh. The lower the VI absolute pressure, the higher the weight and water gain. The highest (p<0.05) weight gain and water gain were determined in VI_200 with 0% CaL and reached 18.72% and 17.49%, respectively. The weight and water gain in fresh-cut apples after VI were reported in a previous study. Various Polish cultivars of apple cubes showed weight gain of 15–32% after the VI treatment (150 mbar) using a solution containing 0.5% ascorbic acid, 0.5% citric acid, and 10% sucrose (w/w) [Kidoń et al., 2023]. The authors also found that the weight gain was negatively correlated (r=−0.85) with firmness of apples before VI. In another study, VI performed at 738 mbar on Golden Delicious cubes (13.25–13.50°Brix) using hypotonic lemon juice (6.25°Brix) showed significantly higher weight and water gain compared to those prepared by the dipping process [Neri et al., 2019].
Table 3
Mass transfer results and water activity of raw fresh apple flesh (FA), FA dipped in ascorbic acid solution (FA+AA), and FA+AA samples subjected to conventional (CON), and non-conventional impregnation (vacuum impregnation, VI, and ultrasound-assisted impregnation, US) in sea buckthorn juice without and with calcium lactate (CaL).
[i] The results are presented as mean ± standard deviation. Different lowercases mean significant differences (p<0.05) between samples within the same column. Different uppercases mean significant differences (p<0.05) between 0 and 4% CaL within the same impregnation treatment and parameter. Sample codes refer to Table 1.
The water gain/loss of CON and US-treated FA+AA under the same CaL concentration was similar (p≥0.05) (Table 3). The values ranged from –3.46% (US_30, 4% CaL) to 1.41% (US_20, 0% CaL). About 1% weight loss was observed in FA+AA impregnated in 0% CaL, while 4% CaL resulted in about 2–4% weight loss, especially in the US-treated samples. There was no significant (p≥0.05) weight loss difference between FA+AA prepared with 0 and 4% CaL in CON and all US treatments, except for US_20, where 4% CaL caused significantly (p<0.05) higher weight loss than 0% CaL. According to literature, the US treatment (probe, 24 kHz, 400 W) of Granny Smith apple, impregnated with hypotonic vitamin B12 solution, showed minor water gain/loss, depending on the US power and treatment time (5–15 min) applied [Vasile et al., 2022]. The same authors also observed that the treatment at 400 W with two different amplitudes of 20% and 100% resulted in up to 2% water loss and 5.1% water gain, respectively.
The total solid gain/loss in all treatments was close to zero, however slight but significant (p<0.05) differences were found between the samples (Table 3). The highest solid loss was observed in US_10 with 0% CaL, and the highest solid gain in VI_200 and VI_400 with 4% CaL. In comparison to 0% CaL, the 4% CaL treatment caused significantly (p<0.05) higher solid gain in VI and CON, and solid loss in US_10 and US_20. For US_30, there was no significant difference (p≥0.05) between the samples treated with and without CaL. A solid loss of apple was also highlighted in US-assisted impregnation using a hypotonic vitamin B12 solution [Vasile et al., 2022] and VI in a hypotonic lemon juice solution [Neri et al., 2019].
In terms of aw, the value determined for the treated FA+AA (CON, VI, and US) ranged from 0.989 to 0.998 for 0% CaL, and from 0.989 to 0.996 for 4% CaL (Table 3), whereas the aw of raw FA and FA+AA were 0.994 and 0.998, respectively.
The results of this research indicated that the mass transfer phenomena and the aw of the impregnated apples were affected by the composition of the solution, impregnation types, and process parameters. In the CON treatment, as the used solutions were rather hypotonic, the mass transfer, especially water transfer, may have occurred toward apple tissue by simple diffusion [Vasile et al., 2022]. US and VI could cause cellular damage, allowing fluid to flow within the plant matrix [Yılmaz & Ersus Bilek, 2018]. The VI removes intercellular air and native liquid in the apple, and subsequently the emptied intercellular spaces and pores can be easily filled with the impregnating solution [Pasławska et al., 2019], in this case, SB juice and CaL solution. Vacuum also intensifies capillary flows and favors mass transfer during impregnation, which occurs due to surface tension at the solid-solution interface [Vinod et al., 2024]. The US treatment could also promote mass transfer during the impregnation process due to the cavitation phenomenon and continuous sponge effect of the apple tissue [Nowacka et al., 2021]. Other factors, such as cultivars [Kidoń et al., 2023], maturity of apples [Casim et al., 2023], or even their cultivation method (organic and conventional apples) [Neri et al., 2019], could also affect the mass transfer phenomena during impregnation, as different apples showed different physicochemical characteristics.
Color of freeze-dried apples
Next to functional properties, color also is one of the important factors that can attract consumer to buy and consume the functional food products. The color of the freeze-dried control and impregnated apple flesh was described by several parameters (Table 4). Regarding controls, FA+AA exhibited higher L*, lower a* and b*, as well as higher WI and lower YI compared to FA (p<0.05). This might be explained by the role of ascorbic acid that could prevent melanin formation through intermediate products binding, e.g., o-quinone, thus increasing the lightness of the apple [Moon et al., 2020].
Table 4
Color parameters of freeze-dried products: fresh apple flesh (FA), FA dipped in ascorbic acid solution (FA+AA), and FA+AA samples subjected to conventional (CON), and non-conventional impregnation (vacuum impregnation, VI, and ultrasound-assisted impregnation, US).
[i] The results are presented as mean ± standard deviation. Different lowercases mean significant differences (p<0.05) between samples within the same row. Different uppercases mean significant differences (p<0.05) between 0 and 4% CaL within the same impregnation treatment and color parameter. ΔE, total color difference compared to FA+AA sample; BI, browning index; WI, whiteness index; YI, yellowness index. Sample codes refer to Table 1.
The color parameters of freeze-dried impregnated apples (CON, VI, and US) were influenced by the SB juice in the impregnation solution, and more specifically by the carotenoids present in it. For SB juice, L*, a*, and b* were 52.9±0.1, 22.0±0.1, and 63.5±0.3, respectively. The treated samples had lower L* and WI, and higher a*, b*, BI, and YI than the controls (p<0.05) (Table 4). The ΔE of the impregnated samples ranged from 37.0 to 47.2 in 0% CaL, and 31.3 to 40.8 in 4% CaL, indicating that the color difference between FA+AA and all impregnated apple products could be clearly noticed by observers. The color changes of apple chips or fresh apple pieces caused by the use of a colored impregnation solution or an osmotic dehydration solution were observed in other studies, e.g., apples with cranberry and grape juices [Wang et al., 2022], beetroot juice [Aguirre-García et al., 2020], and chokeberry juice [Lech et al., 2018].
The enzymatic browning, which determines color, may occur in apple products, due to the presence of polyphenol oxidase (POD) and peroxidase (POD). Although the color parameters of apple products, especially L*, ΔE, BI, WI, and YI, were used in some studies to observe the enzymatic browning, those parameters are not always in accordance with PPO and POD activities as the color of the impregnating or dipping solution may also affect those parameters [Arnold & Gramza-Michałowska, 2022]. The activity of PPO and POD was determined in our study and discussed below to confirm whether the enzymatic browning occurred in the freeze-dried products.
Regarding the application of non-conventional impregnations (VI and US), only freeze-dried samples prepared under certain treatment conditions showed significant differences in BI, WI, and YI compared to CON (Table 4). However, ΔE did not show any significant differences between CON and non-conventional treatments in either 0% or 4% CaL solution. This might be due to the intense color from SB juice in the samples, noting that for products with intense color, even the ΔE values of 6–7 may still be subtle to the eye [Tylewicz et al., 2020]. In another report, the VI with isotonic CaL solutions caused a significant darkening of melon, which might be due to changes in the structural properties of the tissue as a consequence of vacuum application and/or gas-liquid exchange that can alter the refraction index [Tappi et al., 2016]. The application of ultrasound in combination with VI using a solution containing 9% sucrose, 0.5% citric acid, and 0.5% ascorbic acid (w/w) also affected the ΔE of cranberry, showing that cranberries impregnated at 50 mbar had lower ΔE than those treated at 300 mbar [Mierzwa et al., 2022].
Generally, the addition of 4% CaL tended to cause significant changes in the color parameters of the products, regardless of the impregnation method (CON, VI, or US). The VI of fresh-cut melon using up to 5% of CaL also showed significant changes in L* and hue angle, depending on the pressure levels [Tappi et al., 2016]. In another study, similar chroma values were found for pineapples osmotically dehydrated in sugar solution with 2 and 4% CaL [Silva et al., 2014].
Total phenolic content and antioxidant capacity of freeze-dried apples
The TPC and antioxidant capacity (determined by ABTS, DPPH, FRAP, ORAC, PCL-ACL, PCL-ACW, and PCL-IAC assays assays) of freeze-dried controls and impregnated samples is shown in Figure 1. In controls, FA+AA in general showed higher TPC and antioxidant capacity than FA, due to the presence of ascorbic acid. However, an insignificant increase was found in ABTS and ORAC assays (p≥0.05).
Figure 1
Total phenolic content, TPC (A), ABTS radical cation scavenging activity (B), DPPH radical scavenging activity (C), ferric-reducing antioxidant power, FRAP (D), oxygen radical absorbance capacity, ORAC (E), and results of photochemiluminescence assay including antioxidant capacity of lipid-soluble substances, PCL-ACL (F) water-soluble substances, PCL-ACW (G), and integral antioxidant capacity, PCL-IAC (H) of freeze-dried products: fresh apple flesh (FA), FA dipped in ascorbic acid solution (FA+AA), and FA+AA samples subjected to conventional (CON) and non-conventional impregnation (vacuum impregnation, VI, and ultrasound-assisted impregnation, US) in sea buckthorn juice without and with calcium lactate (CaL). Different lowercase letters indicate significant differences (p<0.05) between samples within the same CaL concentration. Different uppercase letters indicate significant differences (p<0.05) between 0 and 4% CaL within the same impregnation treatment. GAE, gallic acid equivalent; TE, Trolox equivalent. Sample codes refer to Table 1.
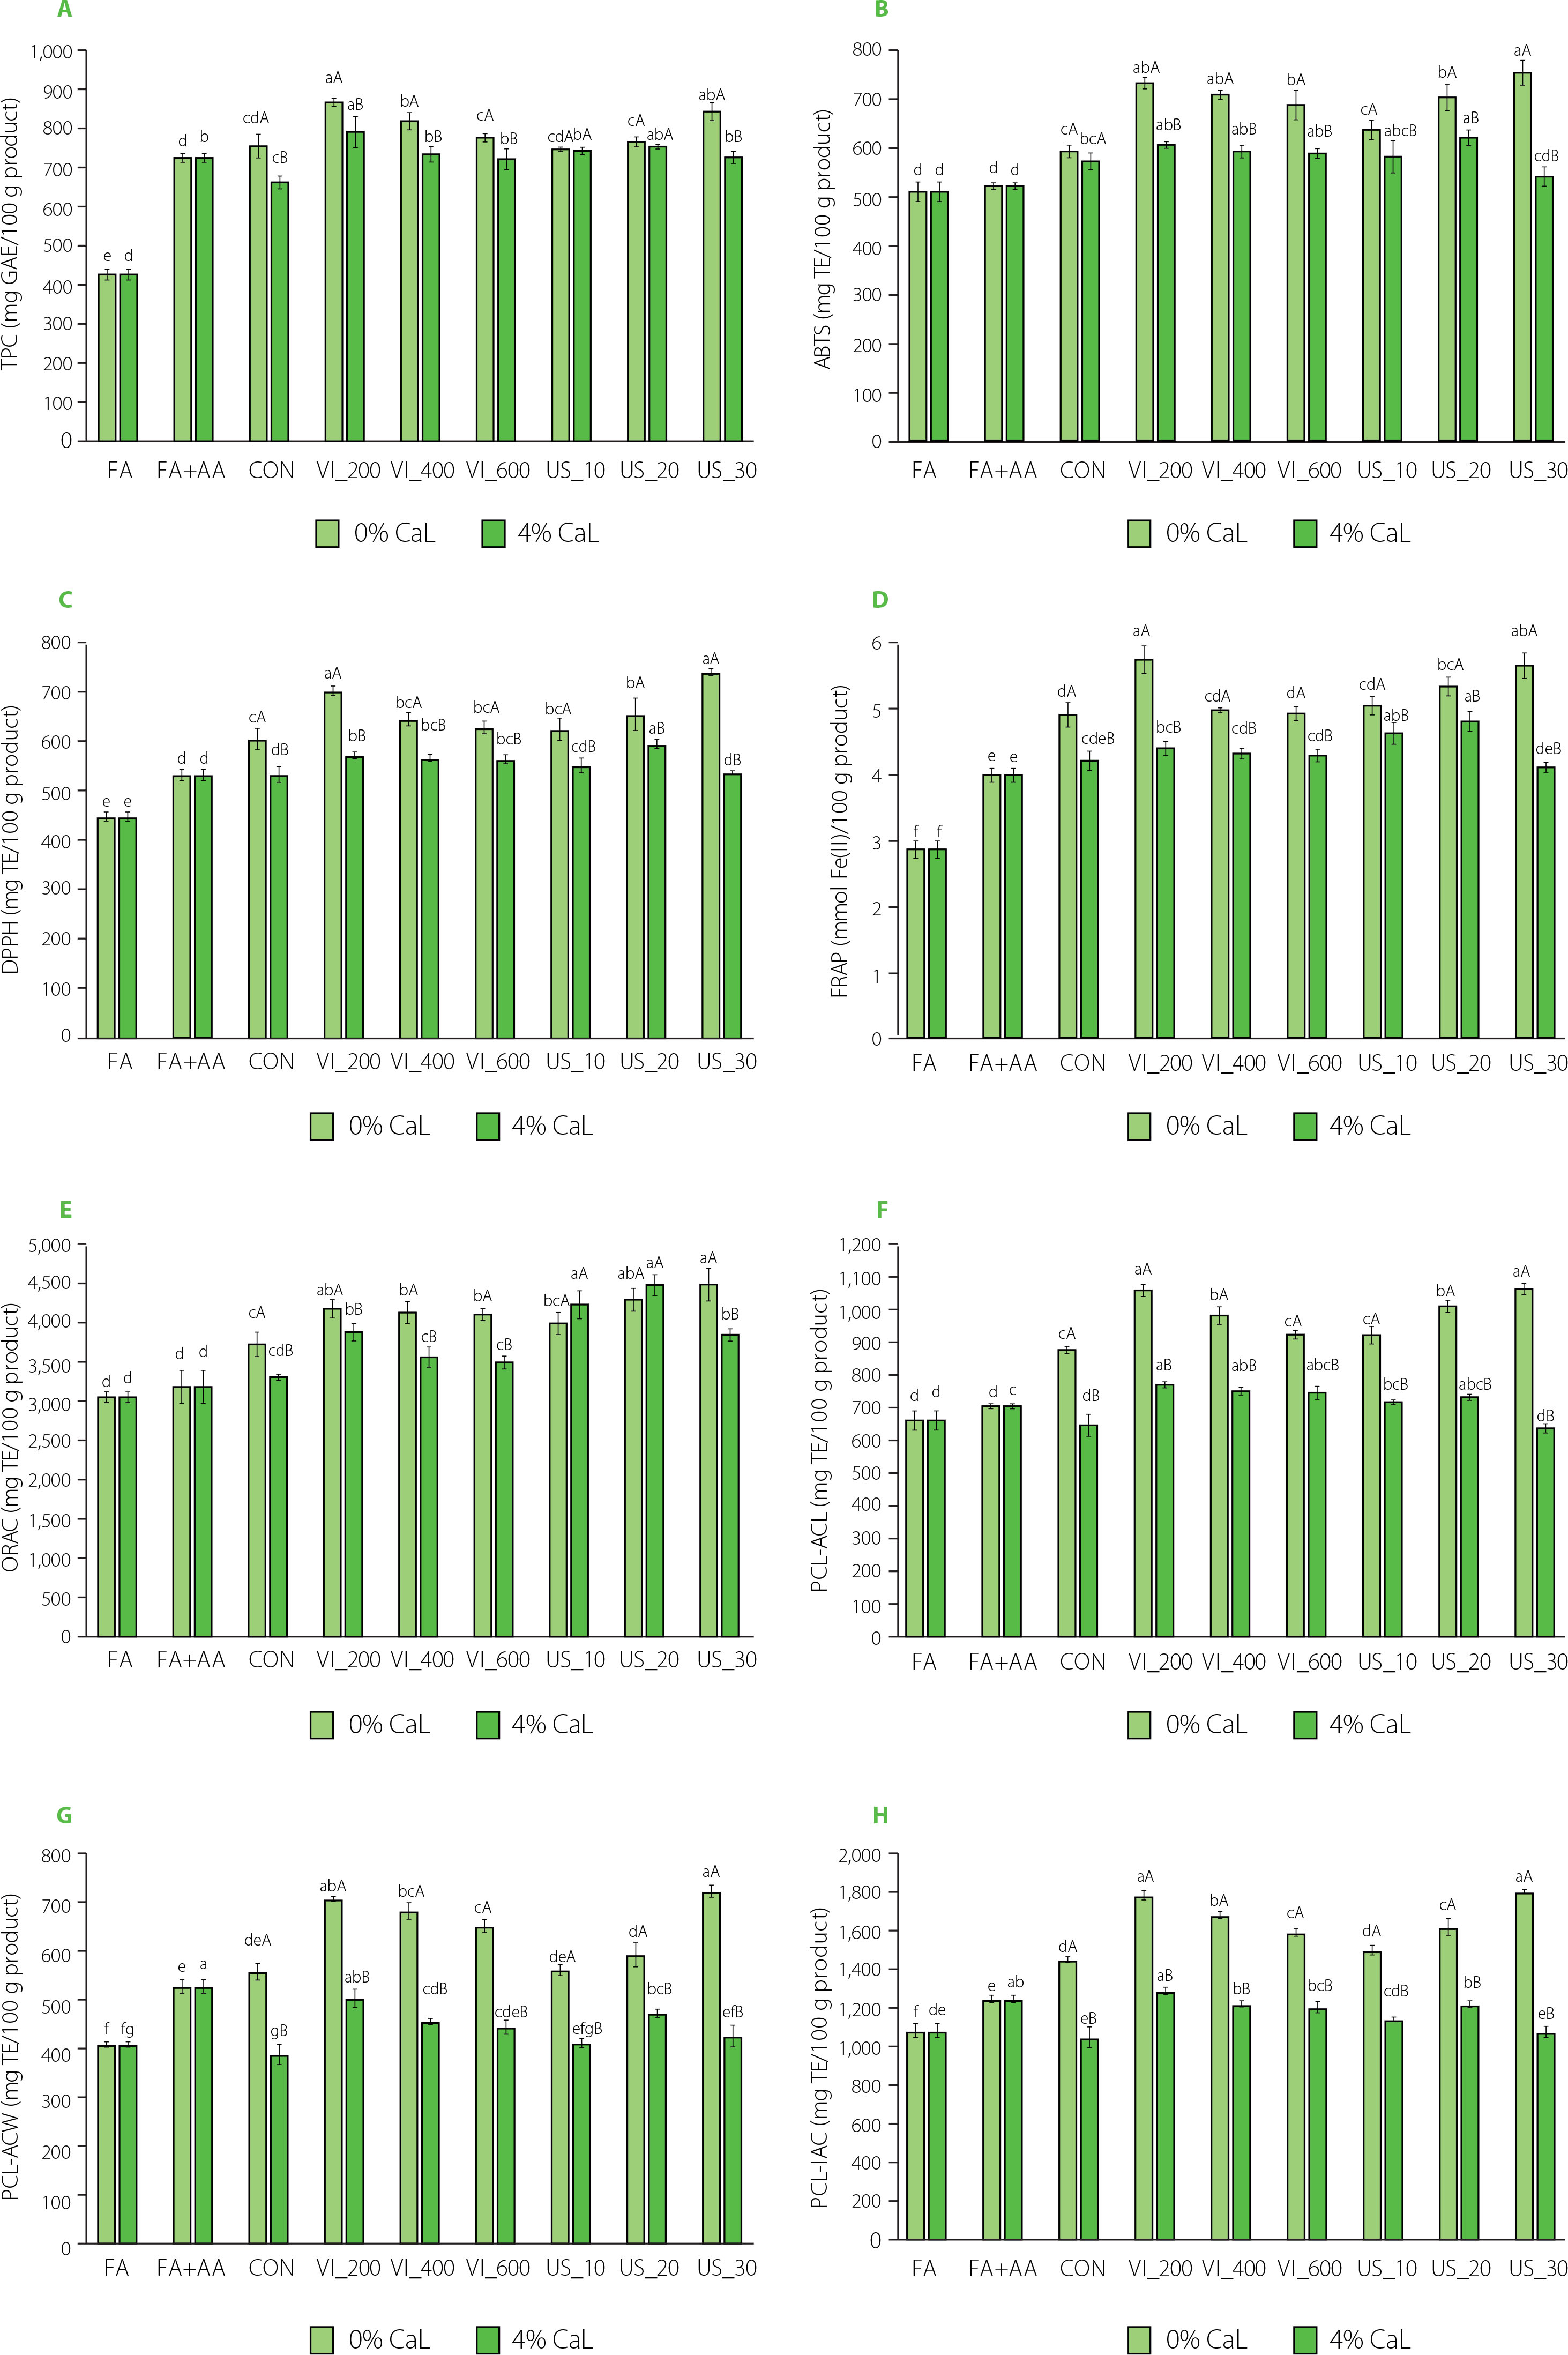
Among the impregnated samples (CON, VI, and US), the addition of 4% CaL in the solution significantly (p<0.05) decreased the TPC and antioxidant capacity of the samples, except for the TPC and ORAC values in US_10 and US_20, and ABTS in CON, where the values were similar (p≥0.05) between CaL concentrations. This phenomenon could be explained by the presence of calcium in the samples, which increased the weight of the freeze-dried samples and subsequently reduced the TPC and antioxidant capacity per 100 g of the sample with 4% CaL [Arnold et al., 2025]. Another possible mechanism could also be the total soluble solid change of the impregnating solution from 4.53°Brix in 0% CaL to 7.47°Brix in 4% CaL solution, which subsequently affected the mass transfer phenomenon and influenced the TPC and antioxidant capacity of freeze-dried products. Although both solutions were still mildly hypotonic than raw FA+AA (8.80°Brix), the higher total soluble solid difference between 0% CaL solution and raw FA+AA could have caused a higher increase in the TPC and antioxidant capacity of the samples than 4% CaL solution. In mango, adding sucrose to the grape-residue solution (raising total soluble solids) during osmosonication-assisted vacuum impregnation (US and VI combined) did not significantly increase the TPC, while US and VI alone without sucrose increased TPC [Batista de Medeiros et al., 2019].
In Figure 1, it was observed that mainly the CON samples showed higher TPC and antioxidant capacity than FA+AA and FA. However, the significance of these differencesvaried depending on the type of antioxidant assay and CaL concentration. Although other studies reported increased antioxidant activity of apple products impregnated in hypertonic solutions, e.g., concentrated chokeberry juice without [Masztalerz et al., 2021] or with sucrose [Kowalska et al., 2020] and beetroot juice with sucrose [Aguirre-García et al., 2020], the impregnation using hypotonic SB juice solution in this study could also increase the TPC and antioxidant activity of the end product, especially in the treatment with 0% CaL. Another study also observed faster migration of phenolic compounds into cucumber slices after impregnation in a hypotonic gallic acid solution than in a hypertonic gallic acid-glycerol solution, and further used various hypotonic herbal solutions to improve the TPC and antioxidant activities (ABTS and FRAP assays) of cucumber slices [Giannakourou et al., 2019].
In contrast to this study, our previous research found lower or similar TPC and antioxidant capacity of freeze-dried Polish Gala apples conventionally impregnated with hypotonic Polish SB juice, even without CaL addition, as compared to FA+AA and FA [Arnold et al., 2025]. The variation in raw material origin may explain the differences in results, as apples and SB juice from different regions can exhibit distinct physicochemical compositions [Ciesarová et al., 2020; Raj et al., 2021]. The differences in physicochemical compositions of apples and SB juice may further influence the mass transfer during the impregnation process and subsequently the chemical composition and antioxidant properties of the end products.
In this study, the application of non-conventional techniques (VI and US) under certain treatment conditions improved the TPC and antioxidant capacity of freeze-dried samples in comparison to CON treatments under the same CaL concentration (Figure 1). For the VI treatment, samples prepared with VI_200 exhibited the highest TPC and antioxidant capacity in both 0% and 4% CaL. This indicated that the lower the pressure applied, the more empty intercellular spaces in apple tissue, and the better the mass transfer as more antioxidants from SB juice filled those spaces and eventually increased the antioxidant capacity of the freezedried product. This was in accordance with the weight gain (Table 3), where VI_200 exhibited the highest weight gain in 0% CaL (18.72%) and 4% CaL (16.74%).
In another study using hypotonic lemon juice (6.25°Brix), it was observed that the VI of organic and conventional Golden Delicious (13.25–13.50°Brix), even at 738 mbar and 10 s of holding time, could increase TPC by 8–11% and antioxidant activity by 10–13% (ABTS assay) [Santarelli et al., 2020]. In the present study, in comparison to CON at the same CaL concentration, the TPC of samples after VI_200 increased 14.8% and 19.5% for 0 and 4% CaL, respectively. Among antioxidant assays, the highest increases after VI_200 were observed in PCL-ACW, which were 26.8% and 29.9% for 0 and 4% CaL, respectively. However, it is noteworthy that the type of impregnating solution, treatment time, and vacuum level in the VI treatment may influence the antioxidant capacity of end products. Pasławska et al. [2019] observed both negative and positive impacts of VI (40–80 mbar, 10–80 s) of Ligol apple in apple-pear juice or citric acid solution on the TPC and antioxidant activities (ABTS and FRAP assays) [Pasławska et al., 2019]. In contrast, Trusinska et al. [2024], who used an isotonic aloe vera-trehalose solution (13 °Brix) during VI of Italian Golden Delicious slices, observed that VI (200 mbar, 10 min) significantly decreased vitamin C content by 34% and TPC by 32%, while similar antioxidant activity was observed in the ABTS assay. Nevertheless, based on the present study, VI especially at 200 mbar, could be an effective way not only to increase the TPC and antioxidant capacity of freezedried apples, but also to save more time as the treatment lasted shorter (28 min) than US or CON (120 min).
In the US treatment, the longer the treatment time, the higher the TPC and antioxidant capacity of the samples, especially in the 0% CaL solution. The US treatment (45 kHz, 900 W, 10–30 min) prior to VI was also reported to minimize the loss of TPC and vitamin C caused by VI alone [Trusinska et al., 2024]. The US treatment may loosen the apple matrix, facilitating the impregnating solution to penetrate into the matrix [Indriani et al., 2023], thus improving the antioxidant properties of the end freeze-dried products.
As the highest TPC and antioxidant capacity among the samples treated with 0% CaL were observed for US_30, the optimum US treatment with 4% CaL was US_20. In comparison to US_20 (in 4% CaL), the US_30 sample had significantly (p<0.05) lower antioxidant capacity in all assays, while TPC did not differ significantly(p≥0.05). After the application of those optimum US conditions (US_30 for 0% CaL and US_20 for 4% CaL), the TPC of samples increased 11.7% and 13.8% for 0 and 4% CaL, respectively, compared to CON samples. Among antioxidant capacity assays, the highest increase was observed in PCL-ACW (29.7%) for 0% CaL and ORAC (35.5%) for 4% CaL.
During the US-assisted impregnation, the mass transfer in the samples was faciliated by cavitation, which is the formation, growth, and collapse of bubbles in the impregnating solution or solids (which contain moisture), produced by the pressure fluctuations generated by the ultrasound waves [Nowacka et al., 2021]. The implosion of these microbubbles could promote mass transfer rates and further influence various mechanical properties [Batista de Medeiros et al., 2019]. The pores of the apple flesh in this study could expand more with the action of collapsed bubble, resulting in more intercellular spaces inside the flesh, and further allowing more antioxidants from the impregnating solution (in this case, SB juice) would infuse through the pores; this was similarly explained in the influence of US on vacuum impregnated apple flesh using black carrot concentrate [Yılmaz & Ersus Bilek, 2018]. However, in the 4% CaL solution, the decline in antioxidant capacity after 30 min of the US treatment might be due to US-induced aggregation of the compounds of impregnating solution within the apple matrix, leading to an increased total soluble solid content with prolonged US treatment. This might cause irreversible excessive cell ruptures, so that during relaxation time, the excessively ruptured cells could not optimally retain the infused antioxidants from SB juice solution. Also, in some cases, viscous solutions make penetration of solutes more difficult compared to less viscous solutions [Tappi et al., 2016]. Furthermore, a study observed that the application of US (33 kHz, 60 W) to cherry in water for up to 40 min increased the TPC and antioxidant activities (ABTS and DPPH assays) of cherry, due to cell disruption and more effective extraction of phenolics. However, after 60 min, the cell disruption might be excessive, resulting in detrimental effects, such as phenolics degradation [Muzaffar et al., 2016]. Apples impregnated with black carrot concentrate also showed higher ion leakage when US treatment (33 kHz) was applied at 198 W, compared to those at 0–158 W, indicating a higher rate of cellular damage in plant tissue [Yılmaz & Ersus Bilek, 2018].
Calcium content of freeze-dried apples
The calcium content of freeze-dried apples before and after the impregnation treatment is shown in Figure 2. The FA had a calcium content of 25.78 mg Ca/100 g, while FA+AA showed a higher calcium content of 43.65 mg Ca/100 g. The dipping process with ascorbic acid may have changed the calcium content of FA through mass transfer. In 0% CaL solution, all impregnated samples (CON, VI, and US) showed a higher calcium content than FA. However, when compared to FA+AA, only CON (54.22 mg Ca/100 g) and VI (51.09–66.65 mg Ca/100 g) freeze-dried apples had significantly (p<0.05) higher values, while US samples (43.45-46.71 mg Ca/100 g) had similar (p≥0.05) values. In our previous study, using SB juice and Gala apples from other sources (fruits originating from Poland), a calcium content of 79.44 mg Ca/100 g was determined in a conventionallyimpregnated sample without CaL addition [Arnold et al., 2025]. The higher calcium content of SB juice than raw FA and FA+AA (Table 2) might explain the increasing calcium content in the impregnated samples without CaL.
Figure 2
Content of calcium (A), dry matter (B), and ash (C) of freeze-dried products: fresh apple flesh (FA), FA dipped in ascorbic acid solution (FA+AA), and FA+AA samples subjected to conventional (CON) and non-conventional impregnation (vacuum impregnation, VI, and ultrasound-assisted impregnation, US) in sea buckthorn juice without and with calcium lactate (CaL). Different lowercase letters indicate significant differences (p<0.05) between samples within the same CaL concentration. Different uppercase letters indicate significant differences (p<0.05) between 0 and 4% CaL within the same impregnation treatment. Sample codes refer to Table 1.
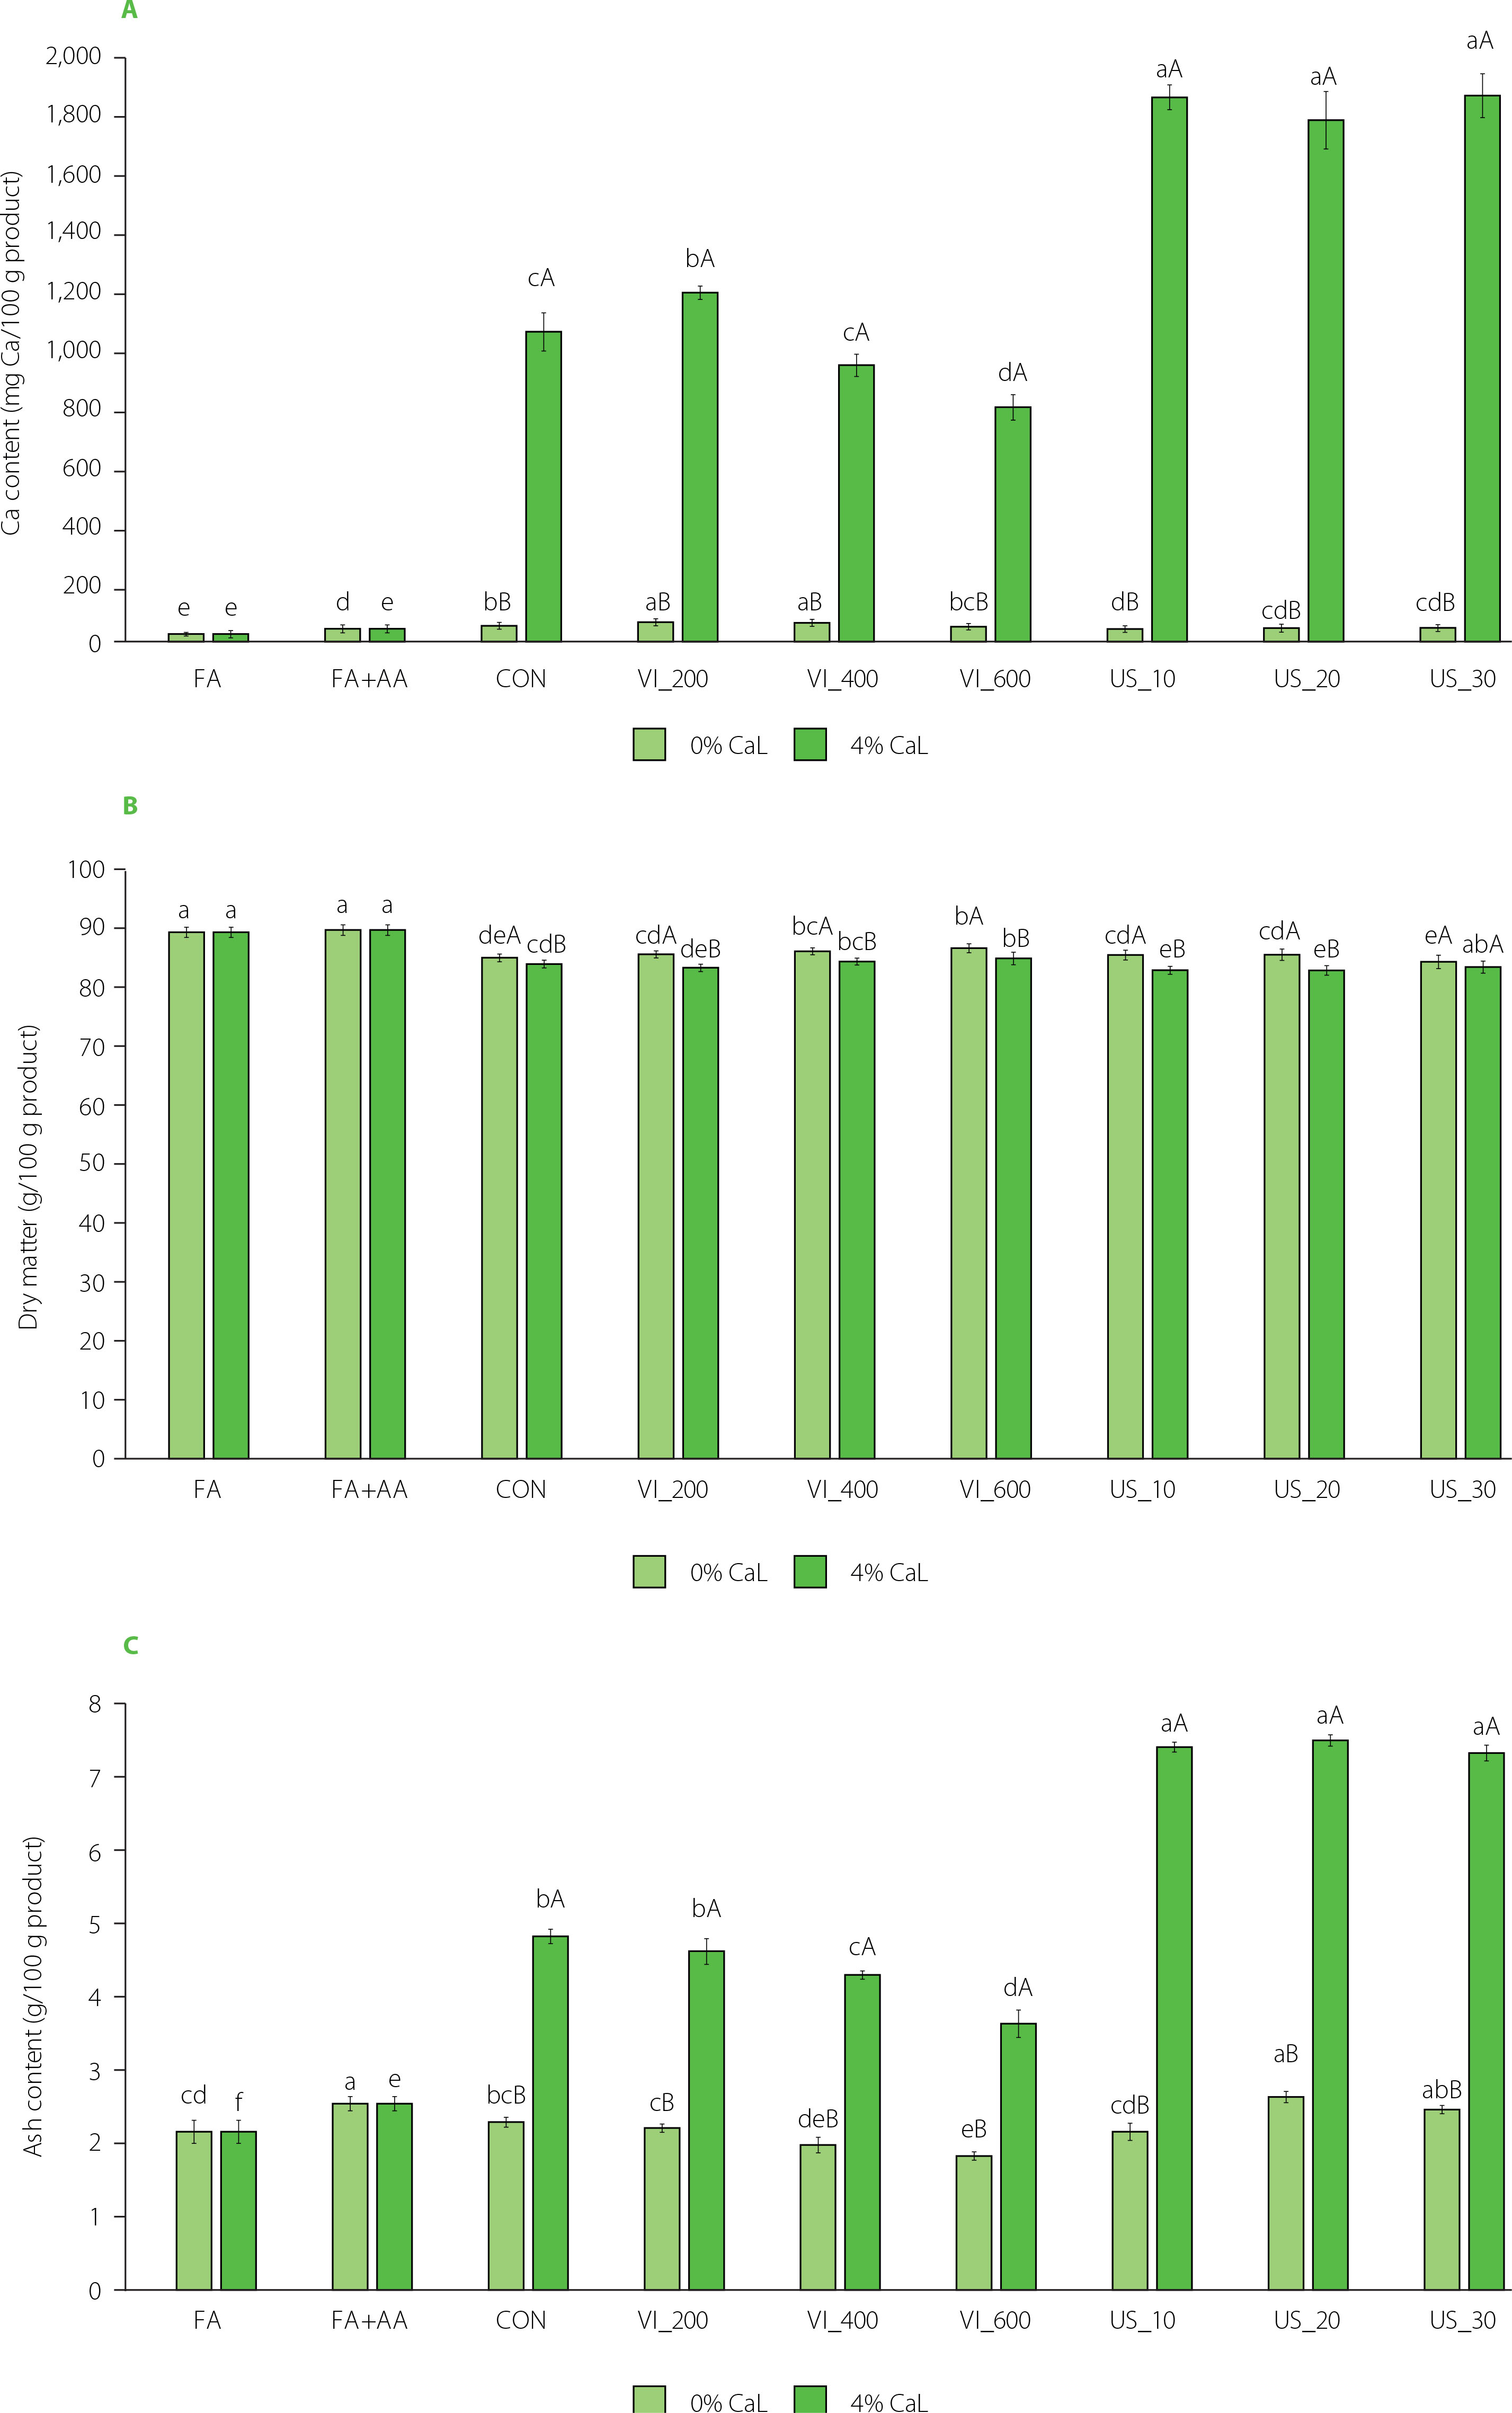
The samples prepared at 4% CaL in the solution, as expected, showed a significantly (p<0.05) higher calcium content than those treated at 0% CaL (Figure 2). Interestingly, among the VI treatments, only VI_200 effectively (p<0.05) increased the calcium content of the freeze-dried apples compared to CON (from 1,194 to 1,060 mg Ca/100 g), while the VI_400 sample showed similar (p≥0.05) values and VI_600 showed 24.3% lower calcium content than CON. When comparing CON with VI_600 in the 4% CaL solution, the pressure used in VI_600 was not sufficient to enhance impregnation. Instead, it may have caused the impregnating solution, along with the calcium, to be drawn out of the apple tissue. This could explain the reduced calcium content observed in the sample, a phenomenon also reported in a previous study using Fuji apples [Assis et al., 2019]. Casim et al. [2023] determined calcium contents of 3,600 and 5,200 mg Ca/kg in Granny Smith dried apples treated by atmospheric (4.5 h, 20°C) and vacuum impregnation (50 mm Hg, 10 min) using an isotonic solution containing 3% calcium gluconate and 2.24% CaL, which were higher than those of the untreated apples (39 mg Ca/kg).
US treatments (4% CaL) resulted in a higher calcium content of the freeze-dried apples, i.e., 49.3–56.4% higher compared to VI_200 and 68.3–76.1% higher compared to CON (Figure 2). However, the duration of the US treatment did not significantly (p≥0.05) affect the calcium content. Therefore, US_20 (4% CaL), with 1,783 mg Ca/100 g, was suggested as optimal, considering it increased both calcium content and antioxidant capacity. The simultaneous application of US (130 W, 35 kHz) during VI (211 mmHg), using a solution containing 3% CaL and 0.8% black carrot concentrate, led to a 13.8% calcium content increase in Starking Delicious apple discs, compared to VI without US [Yılmaz & Ersus Bilek, 2018]. The authors also stated that the addition of Ca could inhibit microbial activity in the product by improving the resistance of cellular structures to microbial infection, and also due to the presence of lactate ions derived from Ca-lactate.
As additional information, considering 25% calcium absorption in adults, consuming 100 g of freeze-dried apples prepared at VI_200 and US_20 in 4% CaL solution may fulfill 29.8% and 44.6% of the recommended daily allowance for adults aged 19–50 [National Institutes of Health, 2022].
Relationship between total phenolic content, antioxidant capacity, and physicochemical parameters of freeze-dried apples
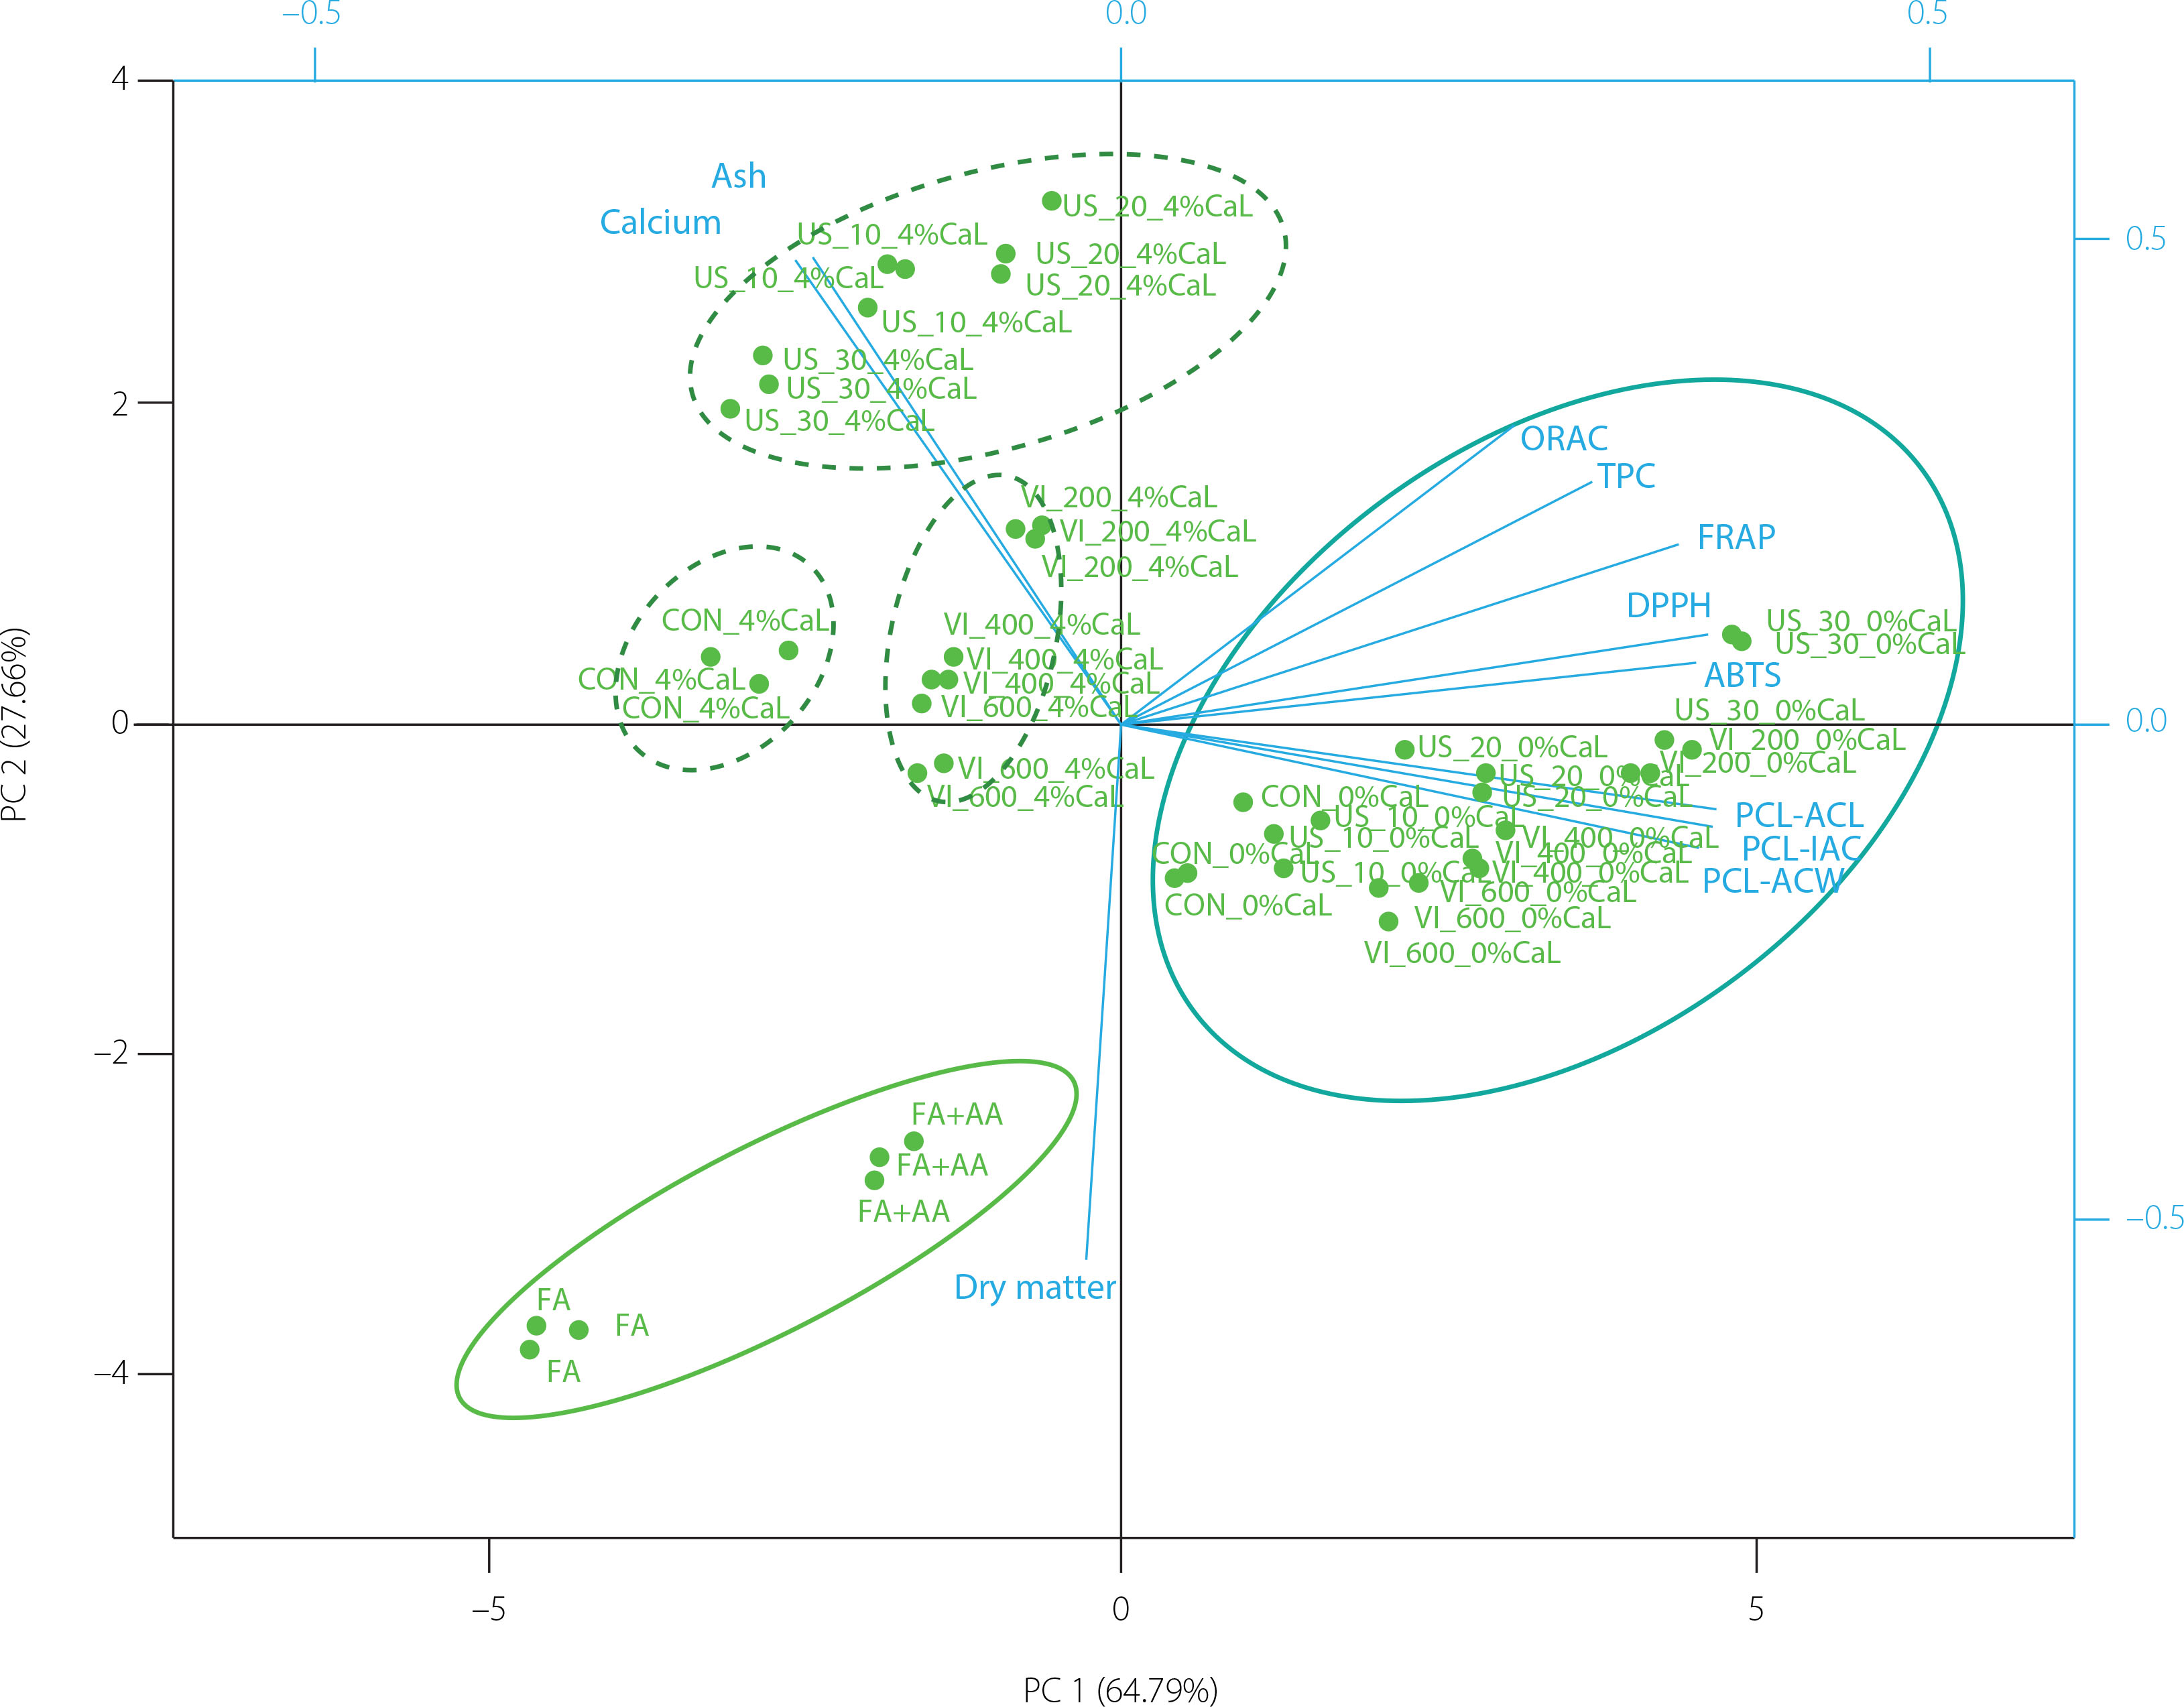
PCA was applied to better understand the relationship between TPC, antioxidant capacity, calcium, dry matter, and ash content of freeze-dried apples. The first two principal components accounted for 92.45% of the total variance (PC1 – 64.79%; PC2 – 27.66%). In the PCA biplot, three groups were noticeable, including a cluster with control samples (FA and FA+AA), a cluster with apples impregnated with 4% CaL, and a group with samples impregnated with 0% CaL (Figure 3). Distinctive subgroups of CON, VI, and US were also observed in the cluster with the apples impregnated with 4% CaL. Variables that distinguished freeze-dried apples treated at 0% CaL were TPC and antioxidant capacity determined by different antioxidant assays, while calcium and ash content characterized samples at 4% CaL. The calcium content of the products was affected not only by the concentration of CaL in the solution, but also by the technology applied during the impregnation process. The calcium content of the product was correlated with ash content, while TPC was associated with antioxidant capacity, especially when it was determined by ORAC, FRAP, ABTS, and DPPH assays.
Figure 3
Biplot of principal component analysis of total phenolic content, antioxidant capacity, and physicochemical parameters of freeze-dried products: fresh apple flesh (FA), FA dipped in ascorbic acid solution (FA+AA), and FA+AA samples subjected to conventional (CON) and non-conventional impregnation (vacuum impregnation, VI, and ultrasound-assisted impregnation, US) in sea buckthorn juice without and with calcium lactate (CaL). Sample codes refer to Table 1.
Content of individual phenolics and carotenoids of freeze-dried apples
The composition of phenolics and carotenoids of the freezedried apple controls and samples with selected treatments from 0% CaL (CON, VI_200, and US_30) and 4% CaL (CON, VI_200, and US_20) is shown in Table 5. The total phenolics of the impregnated samples (226.18–328.02 mg/100 g product) determined by UPLC-PDA were more than twice as high as those of FA and FA+AA (95.03–99.53 mg/100 g product). The application of VI and US generally improved the total phenolics compared to CON, regardless of the CaL concentration, although increases for US_30 without CaL and VI_200 with CaL were insignificant (p≥0.05). Furthermore, CON and VI at 0% CaL showed significantly higher total phenolics than those treated at 4% CaL (p<0.05), while US showed similar values. This trend of results was in accordance with the antioxidant capacity and TPC (Figure 1).
Table 5
Phenolic and carotenoid compositions of freeze-dried products (mg/100 g): fresh apple flesh (FA), FA dipped in ascorbic acid solution (FA+AA) and FA+AA samples subjected to conventional (CON), and non-conventional impregnation (vacuum impregnation, VI, and ultrasound-assisted impregnation, US) in sea buckthorn juice without and with calcium lactate (CaL).
[i] The results are presented as mean ± standard deviation. Different lowercases mean significant differences (p<0.05) between samples within the same row. nd, Not detected. Sample codes refer to Table 1.
However, the increase was not found in all phenolic subgroups. The impregnated samples regardless of the CaL addition had lower sums of phenolic acids compared to controls, except VI_200 without CaL which showed a similar value to controls (Table 5). Controls also had more dihydrochalcones (6.56–6.88 mg/100 g product) than the treated apples. Although the application of VI and US could enhance the impregnation of a bioactive-containing solution into the apple, it could also lead to microstructural changes in the tissue, possibly degrading or enhancing the migration of some native antioxidants, in this case lower molecular weight phenolics like phenolic acids and dihydrochalcones, out of the apple matrix [Vinod et al., 2024; Yılmaz & Ersus Bilek, 2018]. Therefore, it is necessary for industries to control the processing parameters of VI and US to improve the functional properties of food products, noting that the sample matrix and process parameters will profoundly affect specific compound behavior.
Furthermore, the impregnated samples with 0% CaL showed the highest range of flavan-3-ols content, followed by 4% CaL and controls (Table 5). Catechin was generally the predominant compound among flavan-3-ols in the impregnated samples, due to the involvement of SB juice; sea buckthorn fruits are rich in this compound [Guo et al., 2017] Among phenolics, flavonols were the most abundant subgroup in the impregnated samples also due to SB juice, while only quercetin 3-O-rhamnoside was found in FA and FA+AA. The profile of SB fruit comprises mainly diverse simple glycosides of isorhamnetin and quercetin with less frequent occurrence of kaempferol [Ciesarová et al., 2020]. Isorhamnetin 3-O-rutinoside (about 36%) and isorhamnetin 3-O-glucoside (about 22%) were the major flavonols, which were also dominant in the end product of our previous study, using Polish Gala and SB juice from the Polish retail market [Arnold et al., 2025], as well as agreed with the flavonol composition determined in various SB juices [Tkacz et al., 2020]. The flavonol content of SB differs due to maturity, climate, cultivars, and geographical sites. It is worth noting that flavonoids play important roles in osteogenesis [Yuca et al., 2024] and the prevention of chronic diseases, such as diabetes, cardiovascular diseases, and cancer, due to their antioxidant activity [Ciesarová et al., 2020].
For carotenoids, just like with the phenolic compounds, the impregnated freeze-dried apples with SB juice showed higher total carotenoids (16.47–38.88 mg/100 g) than the controls (2.70–-3.02 mg/100 g) (Table 5). Among carotenoids, carotenes dominated with the highest content in VI_200 at 0% CaL accounting for 21.62 mg/100 g product. When comparing between 0 and 4% CaL in each treatment (CON, VI, US), the CON and VI samples prepared at 0% CaL showed higher total carotenoids, while US had similar values. Carotenoids have been studied not only for their contribution to antioxidant activity, but also for their role in bone metabolism, such as bone mineral density and bone mineral content in various in vitro and in vivo studies, which may be beneficial for people with osteoporosis [Kulczyński et al., 2024].
In this study, the impregnation process of Gala flesh using SB juice, without or with 4% CaL, either through conventional or non-conventional impregnation (VI and US) affected the composition of phenolics and carotenoids, which may in turn impact the functional properties of the end products.
Polyphenol oxidase and peroxidase activity of freeze-dried apples
PPO and POD are the enzymes responsible for browning in apple products, which causes discoloration and degradation of phenolics [Moon et al., 2020]. Their inhibition is important for maintaining the quality of apple products. The PPO and POD activity of freeze-dried apple controls and samples with selected treatments from 0% CaL (CON, VI_200, and US_30) and 4% CaL (CON, VI_200, and US_20) are shown in Figure 4. For PPO activity, the highest value was found in FA (3,795 U/g). In comparison to FA, the FA+AA reduced the PPO activity by 11.2%, which was comparable to our previous results (13.7%) [Arnold et al., 2025]. Another study observed higher PPO and POD activity in freezedried apple (Jonagold, without blanching) than in hot air-dried apple, where the enzymes were almost inactivated due to high temperature [Ahmad-Qasem et al., 2017]. The authors explained that the enzymes may be preserved in a latent state at low temperature during freeze-drying, yet their activities can be recovered when they come into contact with an aqueous medium.
Figure 4
Polyphenol oxidase (PPO) and peroxidase (POD) activities of freeze-dried products: fresh apple flesh (FA), FA dipped in ascorbic acid solution (FA+AA), and FA+AA samples subjected to conventional (CON) and non-conventional impregnation (vacuum impregnation, VI, and ultrasound-assisted impregnation, US) in sea buckthorn juice without and with calcium lactate (CaL). Different lowercase letters indicate significant differences (p<0.05) between samples within the same enzyme. Sample codes refer to Table 1.
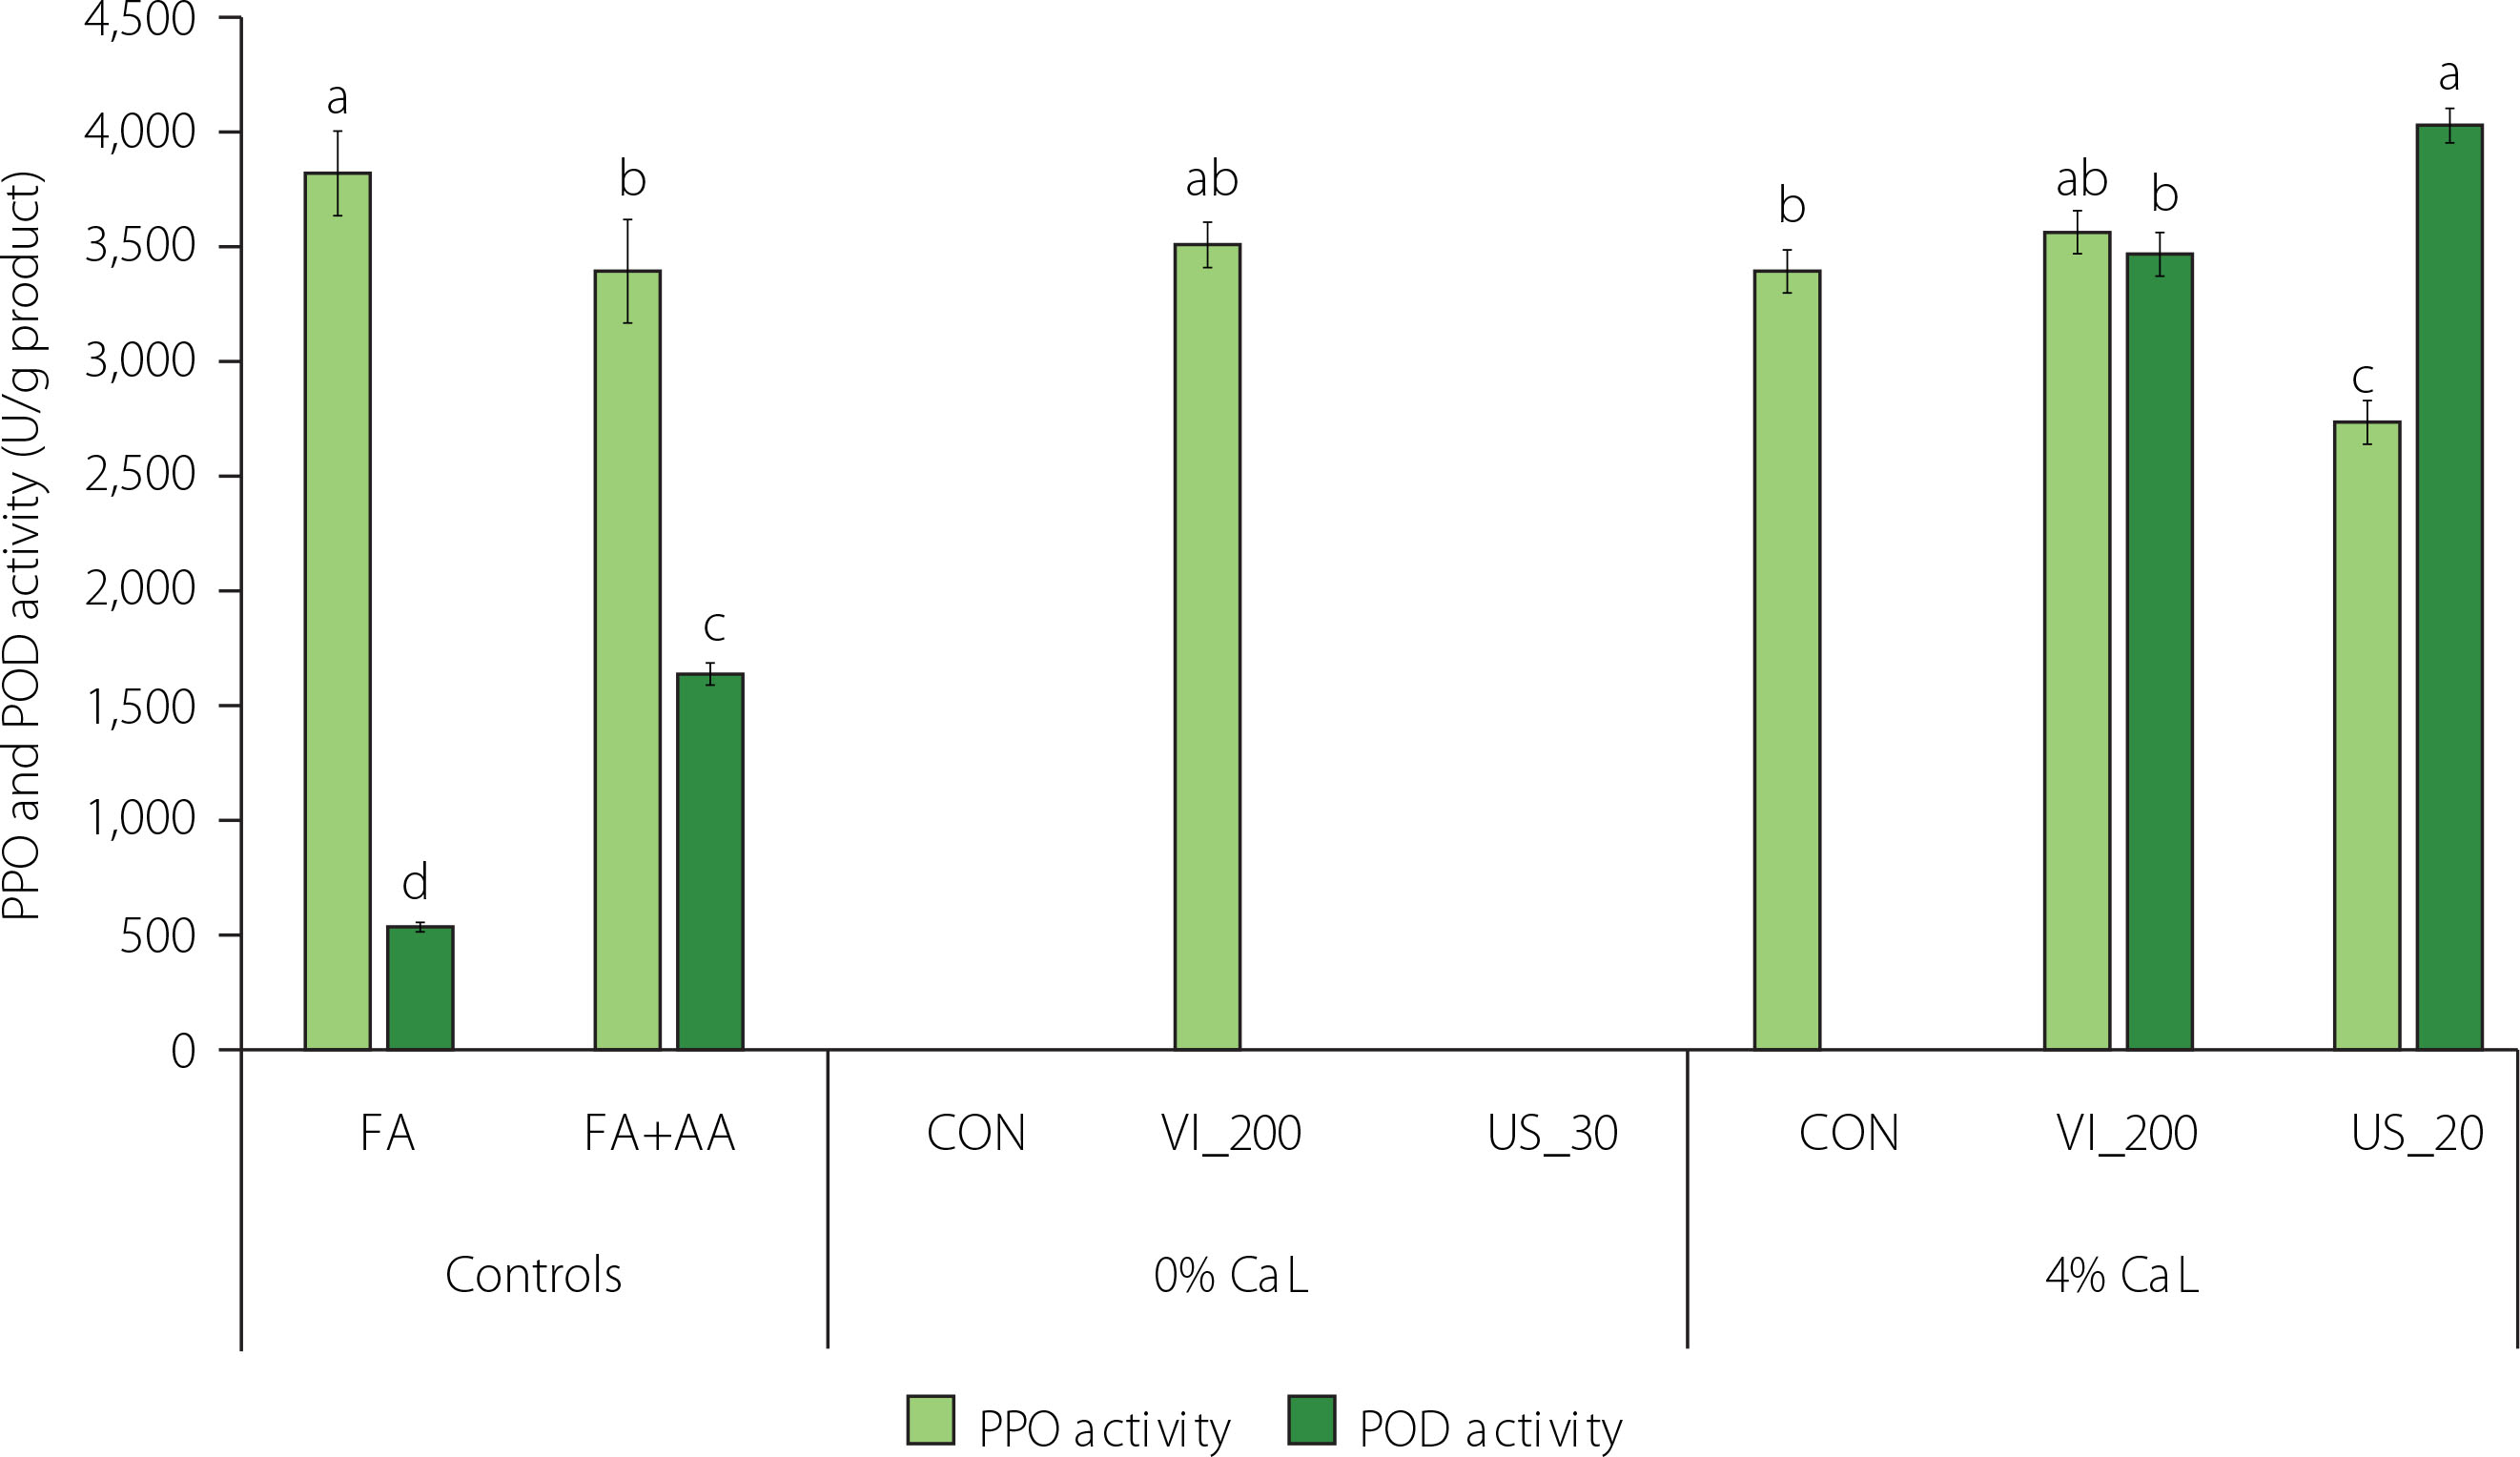
The PPO activity was not observed in CON and US_30 at 0% CaL (Figure 4), which might be caused by complete inhibition from the antioxidants in the samples treated at 0% CaL, confirmed by their high antioxidant capacity. Ultrasound treatment may also inactivate browning enzymes (i.e., PPO) by changing their secondary and tertiary structures [Iqbal et al., 2020]. However, VI_200 at 0% CaL still showed PPO activity (3,486 U/g), a value similar to FA and FA+AA. In this case, despite the high antioxidant capacity found in VI_200, the applied high vacuum (pressure of 200 mbar) might deteriorate the texture of apple flesh [Kidoń et al., 2023], and thus release more PPO during impregnation. Additionally, the sum of phenolic acids of VI_200 at 0% CaL was high, yet still similar to controls (Table 5), which may have acted as substrates of PPO.
In 4% CaL, US_20 reduced PPO activity by 19.4% compared with FA+AA, while CON and VI_200 showed similar values to FA+AA (Figure 4). Neri et al. [2019] applied lower vacuum pressure (738 mbar) during VI of organic and conventional Golden Delicious cubes using a lemon juice solution; this treatment successfully inhibited PPO activity by 32 and 16% in respective treated apple cubes. Additionally, the composition of organic acid contained in the impregnating solution may also influence the inhibition of PPO activity in treated apples [Santarelli et al., 2020]. Another non-conventional technology, high-pressure processing of peaches in a CaL solution (0-2%), was applied and also increased the PPO activity of Clingstone peach, while caused no effect on Freestone peach [Techakanon & Barrett, 2017].
The POD activity of FA+AA was more than three times higher than of FA (Figure 4). The POD activity was completely inhibited in all selected treatments at 0% CaL, which might be linked to the high antioxidant activity and reducing agents that masked the POD activity by reacting with H2O2 as one of the POD substrates [Rojas-Graü et al., 2008]. In contrast, at 4% CaL, POD activity was completely inhibited in CON but increased to 3,444 and 4,002 U/g for VI_200 and US_20, respectively. This might be caused by the combination of non-conventional technologies and the higher total soluble solid content in the solution containing 4% CaL (7.47 °Brix) than in 0% CaL (4.53 °Brix) that could affect the cell structure and thus promote the release of POD. Nevertheless, the antioxidants could not effectively inhibit the POD activity in those treatments. Additionally, a study explained that ultrasound could activate POD by partially unfolding the protein structure, exposing more of the catalytic center and increasing the affinity for the substrate without fully denaturing the protein [Li & Tang, 2021].
Furthermore, although ascorbic acid was reported by previous studies to prevent PPO and POD activities [Arnold & Gramza-Michałowska, 2022; Moon et al., 2020], in some cases it could act as a pro-oxidant that increased PPO and POD activity in apples [Rojas-Graü et al., 2008]. Nevertheless, despite the presence of POD activity observed in some treatments in this study, the POD contribution to enzymatic browning is lower than that of PPO because of the low concentration of H2O2 in apples [Rodríguez-Arzuaga et al., 2019].
CONCLUSIONS
The impregnation of apple flesh using 93.8% SB juice in water (w/w), without or with 4% CaL was carried out conventionally and non-conventionally. Compared with CON, the application of VI and US affected the mass transfer phenomenon and thus resulted in freeze-dried apple products with higher antioxidant capacity and calcium content. The application of VI_200 enabled the development of freeze-dried apple samples with the highest antioxidant capacity (at 0% CaL) and calcium content (at 4% CaL), while the application of US_30 at 0% CaL and US_20 at 4% CaL also effectively improved the antioxidant capacity and calcium content, respectively. In comparison to CON, VI was also beneficial in terms of time-saving and improvement of functional properties, while US could improve the functional properties despite requiring the same treatment time as CON. The output of this study provides a suggestion to consumers and the food industry to consume or produce new alternative locally sourced healthy snacks that may potentially reduce the risk of osteoporosis and calcium deficiency, especially by applying non-conventional technologies. The demonstrated antioxidant properties, calcium content, and enzyme activities of the products suggest that VI and US have potential for application in the development of dried fruit snacks aimed at people with osteoporosis and calcium deficiency. However, it is worth noting that the industrial application of VI and US involves challenges that need to be considered, such as process scale-up, cost, uniformity, regulatory requirements, and the product’s sensory properties and quality. Furthermore, as this study focused on in vitro analysis, further research is needed to evaluate the bioaccessibility and bioavailability of antioxidants and calcium, particularly through in vitro digestion, in vivo experiments, and human studies.