INTRODUCTION
Lentil (Lens culinaris Medik.) is a valuable legume crop known worldwide and mainly used as a protein-rich component of the human diet. Crude protein content of lentil seed flour falls within the range of 25–30% [Barbana & Boye, 2013; Liu et al., 2020]. The two predominant fractions of lentil storage proteins, albumin and globulin, account for approximately 11% and 40% of the total protein content, respectively [Neves & Lourenço, 1995]. The share of glutelins in the protein pool is also significant [Osemwota et al., 2022]. All the essential amino acids were determined in the amino acid profile of the lentil proteins [Liu et al., 2022; Osemwota et al., 2022]. Their content was balanced well and only the contents of tryptophan and sulfur-containing amino acids (methionine and cysteine) were slightly lower than Food and Agriculture Organization/World Health Organization (FAO/WHO) requirement patterns.
In addition to a high nutritional quality, the enhancement of the health-promoting potential of lentil proteins by enzymatic hydrolysis thereof may be considered. The proteases used for hydrolysis can release peptides with different biological activities. In the case of lentil proteins treated with enzymes, several studies have shown the angiotensin I converting enzyme (ACE) inhibitory activity of hydrolysates [Barbana & Boye, 2011; Boye et al., 2010; Garcia-Mora et al., 2014; Rezvankhah et al., 2021a, b]. Moreover, this type of treatment allowed producing lentil protein hydrolysates or their fractions with anti-adipogenic potential, antiproliferative activity, and protective ability against protein glycation [Kuerban et al., 2020; Moreno et al., 2020]. Additionally, enzymatic hydrolysis by the sequential treatment with Alcalase and Flavourzyme decreased the immunoreactivity of lentil proteins [Cabanillas et al., 2010]. The radical scavenging activity of hydrolysates obtained with individual enzymes of microbial (Alcalase, Flavourzyme, Savinase, Protamex, and Corolase 7089) and animal (trypsin) origin or a combination of enzymes (Alcalase/Flavourzyme, pepsin/ pancreatin) has also been reported [Garcia-Mora et al., 2014; Kuerban et al., 2020; Moreno et al., 2020; Rezvankhah et al., 2021a, b]. Although amino acid sequences of few multifunctional peptides with ACE inhibitory and radical scavenging activities released from lentil proteins had already been identified [García-Mora et al., 2017], to the best of our knowledge, hydrolysis of lentil proteins with pancreatin alone to release antioxidant peptides has not been studied so far. In turn, previous studies have shown that this enzyme was equally effective as Alcalase in hydrolyzing and enhancing antioxidant activity of plant seed proteins, including pea, flaxseed, fenugreek seeds, and more effective than many other proteases, such as Flavourzyme, pepsin, trypsin, chymotrypsin, and papain [Asen & Aluko, 2022; Karamać et al., 2016; Kaveh et al., 2022].
Most of the studies mentioned above have involved the hydrolysis of lentil protein isolates or concentrates, while protease treatment of lentil flour to release bioactive peptides has been less frequently explored. Lentil flour contains phenolic compounds, including phenolic acids, flavonoids and condensed tannins [Amarowicz et al., 2010; Paranavitana et al., 2021; Zhang et al., 2015]. Due to interactions with proteins, these compounds, especially tannins, may disturb hydrolysis. Recently, Boachie et al. [2022] have reported that the interaction of lentil proteins with tannic acid diminished the susceptibility of proteins to pepsin hydrolysis, as the enzyme had a limited access to the protein structure, which resulted in a modification of the profile of released peptides. On the other hand, phenolic compounds – as powerful antioxidants – contributed to antioxidant capacity of lentil flour subjected to simulated in vitro gastrointestinal proteolysis [Zhang & Chang, 2019]. Until now, lentil flour has been directly treated by Savinase under mild acidic and alkaline conditions, and the hydrolysates produced in both cases had higher oxygen radical absorbance capacity (ORAC) and better inhibited generation of reactive oxygen species in the murine macrophage cell line RAW 264.7 compared to lentil flour [Bautista-Expósito et al., 2018a, b]. Nevertheless, knowledge of the susceptibility of lentil flour as a whole to treatment with individual proteases and the changes in its antioxidant capacity resulting from such treatment is limited.
Therefore, the aim of our research was to treat lentil flour with pancreatin to obtain hydrolysates with different degrees of protein hydrolysis and to determine the antioxidant capacity of these hydrolysates compared to flour. Since the antioxidant activity of lentil protein hydrolysates has been studied so far mainly as radical scavenging activity, in addition to antiradical activity, also the reducing power and Fe2+ chelating activity were determined in our research.
MATERIALS AND METHODS
Plant material
Lentil seeds (Lens culinaris) of Tina cultivar were purchased at the Plant Breeding Station “Spójnia” (Śrem, Poland). Seeds were ground using a laboratory mill and sieved (mesh size 0.4 mm). The AOAC International approved methods were applied to evaluate the proximate composition of lentil flour: crude protein (N×6.25), starch, lipids, ash, and moisture [AOAC, 1990], which amounted to 27.5±0.16, 48.3±0.71, 0.91±0.01, 3.68±0.12, and 5.91±0.14 g/100 g (n=3), respectively.
Reagents
Pancreatin from porcine pancreas (8×USP specifications), l-leucine, acrylamide, N,N’-methylene-bis-acrylamide, 2-mercaptoethanol, sodium dodecyl sulfate (SDS), glycine, sodium dodecyl sulfate-polyacrylamide gel electrophoresis (SDS-PAGE) marker (SigmaMarker low range), size exclusion-high performance liquid chromatography (SE-HPLC) solvents and standards (bovine serum albumin (cat.-no. A8531), cytochrome C (cat.-no. C7150), bovine lung aprotinin (cat.-no. A3886), bovine insulin chain B oxidized (cat.-no. I6383), human angiotensin II (cat.-no. A9525), leucine encephalin (cat.-no. L9133), and Thr-Tyr-Ser (cat.-no. T0148)), Folin-Ciocalteu’s phenol reagent (FCR), gallic acid, 1,1-diphenyl-2-picrylhydrazyl (DPPH) radical, [2,2’-azinobis-(3-ethylbenzothiazoline-6-sulfonic acid)] diammonium salt (ABTS), 6-hydroxy-2,5,7,8-tetramethyl-chroman-2-carboxylic acid (Trolox), ferrozine, and 2,4,6-tri(2-pyridyl)-s-triazine (TPTZ) were obtained from Sigma-Aldrich (Saint Louis, MO, USA). 2,4,6-Trinitrobenzene sulphonic acid and Coomassie brilliant blue R-250 were purchased from Serva (Heidelberg, Germany). The antioxidant capacity of lipid-soluble substances (ACL) and antioxidant capacity of water-soluble compounds (ACW) kits for the photochemiluminescence method were obtained from Analytik Jena (Jena, Germany). Ferrous chloride tetrahydrate (FeCl2×4H2O), ferric chloride hexahydrate (FeCl3×6H2O) and other reagents, all of analytical grade, were acquired from Avantor (Gliwice, Poland).
Enzymatic hydrolysis conditions and degree of hydrolysis determination
Lentil protein hydrolysis was carried out in a thermostatic vessel placed in an ETS 822 end-point titration system working in the pH-stat mode (Radiometer Analytical A/S, Copenhagen, Denmark). Lentil flour (3 g) was suspended in 30 mL of distilled water. The temperature was set at 50°C and the pH was adjusted to 8.0 using 0.2 M NaOH. Pancreatin was added at a ratio of 50 mAU/g of protein; its activity evaluated by Anson method was 0.74 AU/g. A stable pH 8.0 was maintained during hydrolysis by titration with 0.2 M NaOH. Subsequently, the curve of hydrolysis was plotted as a degree of hydrolysis (DH) vs. time.
The DH (%) was calculated according to Equation (1) [Adler-Nissen, 1986].
where: B – volume of base used for titration (mL), MB – molarity of the base (M), α – average degree of the α–NH2 groups dissociation, P – weight of protein (g), and htot – total number of peptide bonds in the lentil flour proteins (meqv Leu-NH2/g protein).The htot was determined after acidic hydrolysis of lentil flour proteins in 6 M HCl at 105°C using the spectrophotometric method with 2,4,6-trinitrobenzene sulphonic acid (TNBS) [Panasiuk et al., 1998].
Subsequently, the hydrolysates with designed value of DH: 4%, 8%, 12%, 16%, and 20%, were produced. The reaction was stopped by heating at 90°C for 5 min to inactivate the enzyme. The preparations were cooled down, neutralized with 0.2 M HCl, and lyophilized for ∼48 h at –70°C and 0.013 mbar (Lyph Lock 6 freeze dry system, Labconco, Kansas City, MO, USA).
Sodium dodecyl sulfate-polyacrylamide gel electrophoresis (SDS-PAGE)
SDS-PAGE of lentil flour proteins and their hydrolysates obtained with pancreatin was performed in 15% gel in the Laemmli’s buffer system [Hames, 1990]. Proteins were denaturized by heating at 100°C for 5 min. The separation was carried out under reducing conditions (samples were dissolved in Tris-HCl buffer, pH 6.8, with 2% SDS, 5% 2-mercaptoethanol, 10% glycerol, and 0.002% bromophenol blue) using a mini-PROTEAN tetra cell system (BioRad, Hercules, CA, USA) at amperage of 25 A. Sigma-Aldrich marker with molecular weights (MW) in the range of 6.5–66.0 kDa was used as a standard. Resolved proteins and polypeptides in gel were stained with Coomassie brilliant blue R-250. Their molecular weights were estimated by the Quantity One software (BioRad).
Size exclusion-high performance liquid chromatography (SE-HPLC)
The MW distribution of lentil flour proteins and products of their enzymatic hydrolysis was analyzed by SE-HPLC using a Shimadzu HPLC system (Kyoto, Japan) consisting of an LC-10ADVp pump, an SPD-M10AVp photo-diode array detector, and an SCL-10AVp system controller. The samples (100 μL) were injected into a TSKgel G2000SWXL column (7.86×300 mm, 5 μm, Tosoh Bioscience, Tokyo, Japan). The mobile phase of 45% (v/v) acetonitrile with 0.1% (v/v) trifluoracetic acid was delivered at a flow rate of 0.2 mL/min. The detector was set at 220 nm. Bovine serum albumin (66.0 kDa), cytochrome C (12.4 kDa), bovine lung aprotinin (6.5 kDa), bovine insulin chain B oxidized (3.496 kDa), human angiotensin II (1.046 kDa), leucine enkephalin (0.556 kDa), and Thr-Tyr-Ser (0.369 kDa) were used as MW standards.
Total phenolic content determination
The total phenolic content (TPC) of lentil flour and hydrolysates was determined after their (50 mg) extraction with two portions of 80% (v/v) methanol (5 mL) at 65°C for 30 min [Karamać et al., 2020]. Filtrates from both extraction steps were pooled together and their volume was adjusted to 10 mL with extractant. An aliquot of 0.25 mL of the extract was vortexed with 0.25 mL of FCR, 0.5 mL of sodium carbonate saturated solution, and 4 mL of water. The reaction was carried out for 30 min at ambient temperature. The absorbance was measured at λ=725 nm using a Beckman DU-7500 spectrophotometer (Beckman Instruments, Fullerton, CA, USA) after centrifugation of the reaction mixture. Results were expressed as mg gallic acid equivalents (GAE) per g of flour or hydrolysate.
Determination of DPPH radical scavenging activity
The DPPH• scavenging activity of lentil flour and lentil flour protein hydrolysates was determined according to the procedure described by Karamać et al. [2014] with slight modifications. Samples were dissolved in 0.1 M sodium phosphate buffer, pH 7.0, at a concentration ranging from 0.16 to 0.80 mg/mL. An aliquot of 1 mL of the methanolic solution of DPPH• (0.15 mM) was added to 1 mL of the solution of hydrolysates and vortexed vigorously. Control samples were prepared in parallel with methanol. The mixture was left to stand at room temperature for 20 min before absorbance at λ=517 nm was measured using a DU-7500 spectrophotometer (Beckman Instruments). The percentage of DPPH• scavenged by hydrolysate compounds was calculated using the Equation (2):
where: A0 is the absorbance of the DPPH solution, AS is the absorbance in the presence of the sample, and AC is the absorbance of the control. The curves of DPPH• scavenging activity vs. concentration of hydrolysate (mg/mL of reaction mixture) were plotted. The EC50 values, defined as the hydrolysate concentration effective to scavenge 50% of DPPH•, were read from the plot.Determination of Trolox equivalent antioxidant capacity
Trolox equivalent antioxidant capacity (TEAC) of lentil flour and its hydrolysates was evaluated using the ABTS radical cation decolorization assay. ABTS•+ stock solution prepared according to Re et al. [1999] procedure was diluted with methanol up to a final absorbance of 0.70±0.02 at λ=734 nm. Hydrolysates were dissolved in 0.1 M sodium phosphate buffer, pH 7.0, at a concentration of 10 mg/mL. Solutions of hydrolysates (40 μL) were added to 2 mL of ABTS•+ and vortexed. Mixtures were incubated for 6 min at 30°C using a block heater (TH-24, Meditherm, Warsaw, Poland) and the absorbance was measured at λ=734 nm. The results were calculated using the standard curve for Trolox (0.2–2.0 μmol/mL, r=0.999) and expressed in μmol of Trolox equivalents per g of hydrolysate or flour.
Photochemiluminescence assay
The photoluminescence (PCL) method [Popov & Lewin, 1999] was employed to evaluate the radical scavenging capacity of lentil flour and hydrolysates for superoxide anion radicals (
Determination of ferric reducing antioxidant power
The ferric reducing antioxidant power (FRAP) was determined according to Benzie & Strain [1996] method. Lentil flour and lentil flour hydrolysate solutions (5 mg/mL) and FRAP reagent (10 mM TPTZ in 40 mM HCl, 20 mM FeCl3×6H2O, and 0.3 M acetate buffer, pH 3.6; 10:1:1 v/v/v) were prepared. Sample solution (150 μL), FRAP reagent (2.25 mL), and distilled water (150 μL) were mixed and incubated for 30 min at 37°C using a TH-24 block heater (Meditherm). Absorbance readings were taken at λ=593 nm using a Beckman DU-7500 spectrophotometer. The results were calculated using the standard curve for FeSO4×7H2O (0.18–1.80 mM, r=0.996) and expressed as μmol of Fe2+ per g of hydrolysate or flour.
Determination of Fe2+ chelating activity
The Fe2+ chelating activity of lentil flour and lentil flour hydrolysates was evaluated using the assay with ferrozine [Karamać & Pegg, 2009]. Samples were suspended in distilled water at a concentration ranging from 0.1 to 0.8 mg/mL. Afterwards, 2.5 mL portions of sample solutions were vortexed with 0.25 mL of 0.4 mM solution of FeCl2×4H2O. Then, 0.5 mL of 5 M ferrozine was added and after 10 min quiescent period at ambient temperature the mixtures were centrifuged for 5 min at 5,000×g using an MPW-210 centrifuge (MPW Med. Instruments, Warsaw, Poland). The absorbance of the supernatant was measured at λ=562 nm (Beckman DU-7500 spectrophotometer). A control sample was prepared in parallel by replacing the hydrolysate solution with distilled water. The percentage of Fe2+ bound was calculated.
Statistical analysis
The hydrolysis and antioxidant assays were performed in triplicate. The mean value and standard deviation were calculated using Microsoft Excel 2000 software (Microsoft Office Excel for Windows, Microsoft, Redmond, USA). The results of TPC and antioxidant assays were analyzed by a one-way analysis of variance (ANOVA) with Tukey’s multiple comparison test (GraphPad Prism version 5.02 for Windows, GraphPad Software, San Diego, USA). The differences were considered significant at p<0.05.
RESULTS AND DISCUSSION
Kinetics of hydrolysis of lentil flour proteins with pancreatin
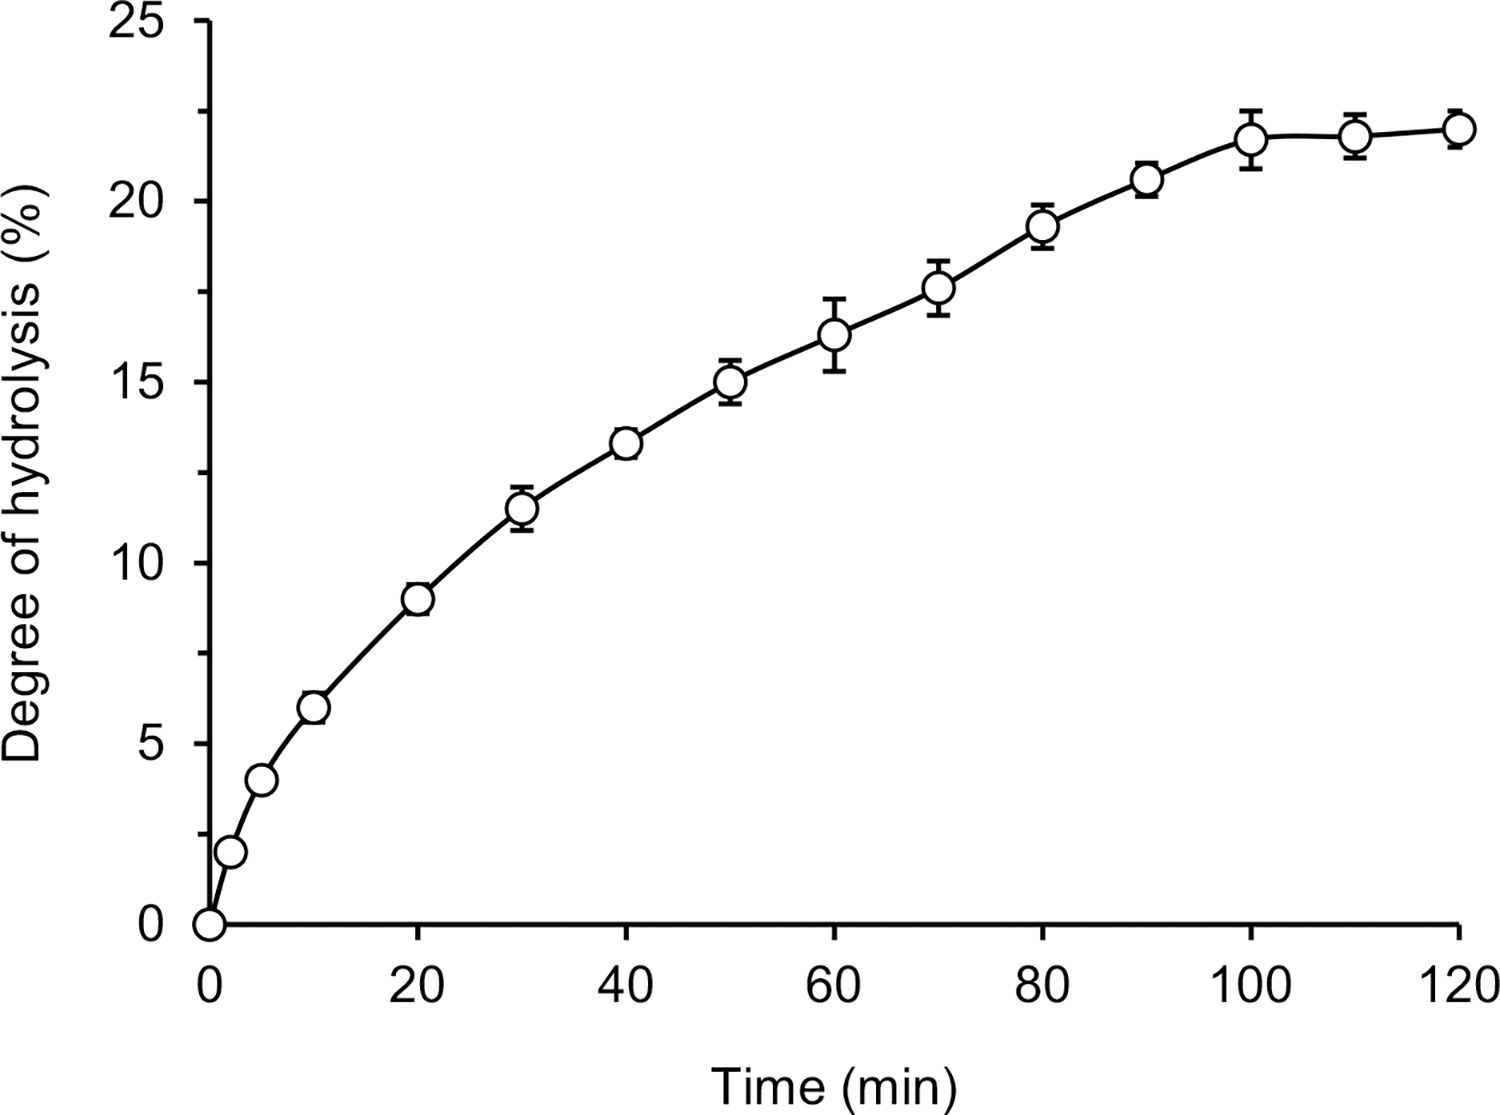
The kinetic curve of hydrolysis of lentil flour proteins with pancreatin was depicted in Figure 1. After 120 min of the process, the DH reached 22%. The initial phase of the process was the most rapid, then the reaction rate slowed down gradually and stabilized after 100 min of hydrolysis. The maximal DH was in the range of 20–24%, which was previously achieved for lentil protein extract or concentrate hydrolyzed by Alcalase [Cabanillas et al., 2010; Garcia-Mora et al., 2014; Rezvankhah et al., 2021a]. Lower values were obtained using other proteases of microbial origin, like Flavourzyme, Savinase, Protamex, and Corolase 7089 (DH 8.5–15%) [Garcia-Mora et al., 2014; Rezvankhah et al., 2021a]. The digestive tract enzymes, i.e. chymotrypsin and trypsin, hydrolyzed lentil flour proteins up to DH of 13% and 4–57%, respectively [Avramenko et al., 2013; Karamać & Rybarczyk, 2008]. In the latter case, different enzyme to substrate ratios (1/100–1/1000, respectively) were used. Higher DH values were reported for lentil proteins treated sequentially with Alcalase and Flavourzyme (47.05–64.31%) [Barbana & Boye, 2011; Cabanillas et al., 2010; Rezvankhah et al., 2021a] and digested under simulated conditions of the gastrointestinal tract with pepsin-pancreatin or pepsin-trypsinchymotrypsin (65.5–82.4%) [Aryee & Boye, 2016]. The DH determined in our research fell within the wide range of 12–55% reported for hydrolysates of other leguminous seeds and oilseeds obtained with pancreatin [Asen & Aluko, 2022; Betancur-Ancona et al., 2014; Karamać et al., 2014; Valdez-Ortiz et al., 2012]. This difference may be related to the protein profile of the seeds, but also to the hydrolysis carried out under different conditions (temperature, enzyme-substrate ratio, initial substrate concentration) and the use of different methods for DH determination.
Molecular weight distribution of proteins, polypeptides, and low MW compounds of lentil flour and hydrolysates
SDS-PAGE of lentil flour (DH 0%) under reducing conditions revealed more than 20 bands corresponding to proteins and protein subunits with MW in the range of 14.5–92.0 kDa (Figure 2). Bands with the highest intensity (48.8 and 47.4 kDa) were in the MW range previously distinguished as the subunit of vicilin [Boye et al., 2010; Garcia-Mora et al., 2014; Moreno et al., 2020]. Convicilin subunit might be recognized in a clear band corresponding to MW of 58.9 kDa [Boye et al., 2010]. Bands in the MW ranges of 34.0–39.0 kDa and 20.0–23.0 kDa originated probably from acidic and basic subunits of lentil 11S globulin, respectively. Few bands in the low MW range of 14.5–18.0 kDa might originate from γ-vicilin or some albumins. Bautista-Expósito et al. [2018c] showed the electrophoretic pattern of a lentil protein concentrate with two bands corresponding to MW of around 90 kDa and suggested that they distinguished lipoxygenase isoforms. Probably the analogous bands in the electrophoretic separation of lentil flour were those of MW of 82.8 and 91.9 kDa (Figure 2). The SDS-PAGE pattern of lentil flour in our study corresponded well with those reported by Barbana & Boye [2011, 2013] and Aryee & Boye [2016], where bands ranging from 15 to 97 kDa were detected under reducing conditions for raw red and green lentil flours and protein concentrates.
Figure 2
SDS-PAGE patterns of lentil flour and its hydrolysates obtained with pancreatin. MW – molecular weight.
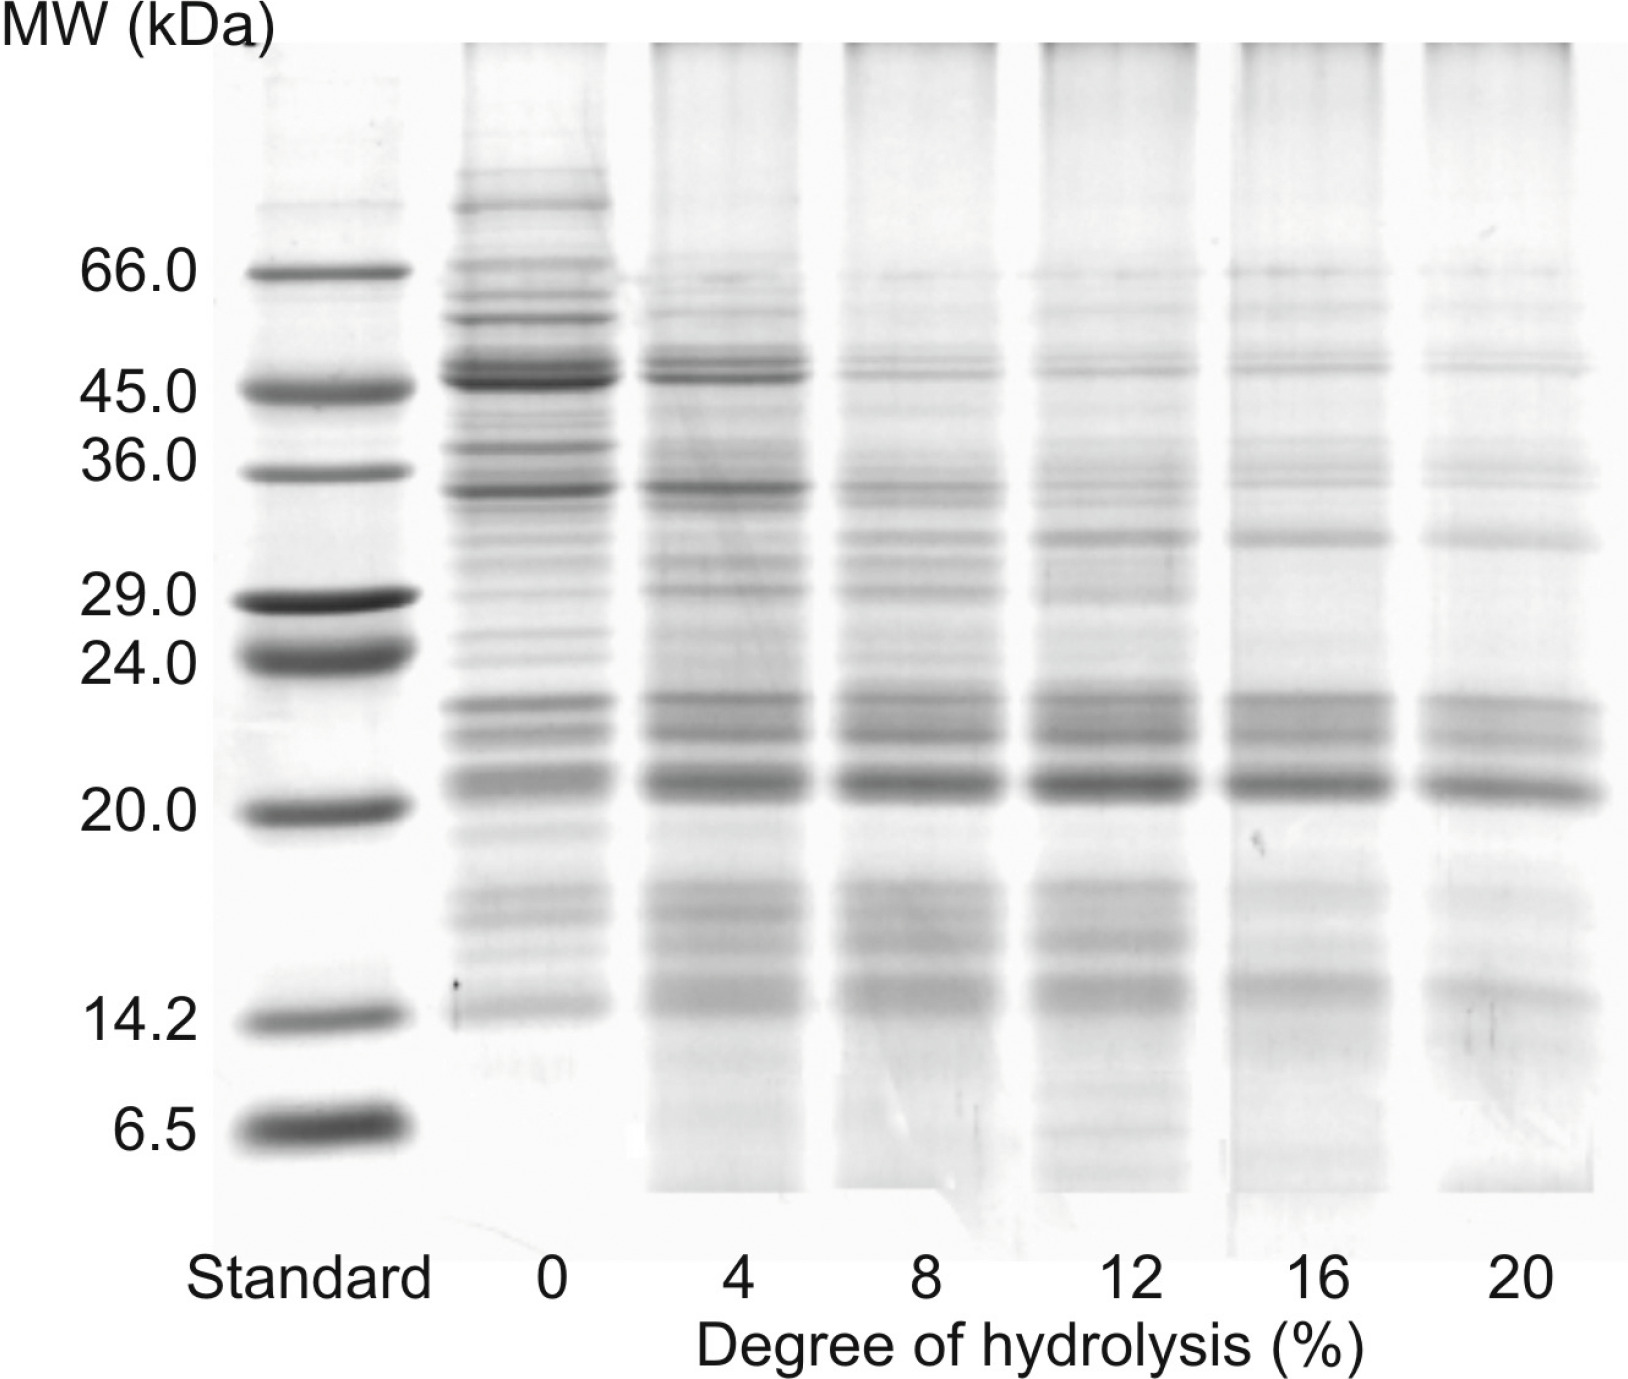
As a result of pancreatin treatment, proteins with the highest molecular weights were degraded firstly (Figure 2). The electrophoretic pattern of the hydrolysate with DH 4% showed a lack of bands corresponding to MW higher than 65 kDa, and much weaker intensity of the bands in the range of 47.4–65.0 kDa compared to the SDS-PAGE pattern of lentil flour. An increase in DH of the hydrolysates resulted in a further decrease in the intensity or disappearance of bands corresponding to convicilin, vicilin, and acidic subunits of legumin. At the same time, bands originating from basic subunits of lentil 11S globulin did not lose their intensity completely and were apparent even in the electrophoretic pattern of the hydrolysate with DH 20%. Previous studies have reported the resistance of certain lentil protein subunits to hydrolysis with trypsin and chymotrypsin [Avramenko et al., 2013; Karamać & Rybarczyk, 2008; Neves & Lourenço, 1995]. SDS-PAGE separation of lentil globulin hydrolysates revealed that subunits with an MW below 21 kDa were not susceptible to trypsinolysis and those with the MW of 32–34 kDa and below 21 kDa were resistant to chymotrypsinolysis [Neves & Lourenço, 1995]. Similarly, our previous study [Karamać & Rybarczyk, 2008] showed that some lentil protein subunit bands were present in the electrophoretic pattern of a lentil flour hydrolysate obtained with chymotrypsin (DH 13%). In turn, Avramenko et al. [2013] determined the patterns of SDS-PAGE under non-reducing conditions of lentil protein isolate and its hydrolysates with trypsin (DH 4–20%). A band corresponding to an MW of around 30 kDa was found for the isolate and hydrolysates. These findings may explain the presence of bands from undigested protein in the hydrolysates obtained with pancreatin, which has trypsin and chymotrypsin activity.
The MW distribution of low MW compounds of lentil flour and hydrolysates was analyzed by SE-HPLC (Figure 3). A large peak eluting at short retention time was dominant in the chromatogram of lentil flour. It suggested that the molecules with the MW higher than 66.0 kDa were predominant in the sample. However, small peaks corresponding to lower MW were also present in the chromatogram. This was in line with the previous study, in which SE-HPLC fractions of green and red lentil flours with MW of 0.24–44 kDa were detected [Barbana & Boye, 2013]. The authors suggested that they could be derived from some subunits of 11S and 7S globulins, 2S albumin, polypeptides, γ-vicilin, and small peptides from the cleavage of the larger proteins. The peaks corresponding to the lowest MW (<0.556 kDa) could also be ascribed to the phenolic compounds, as provided in our earlier publication [Karamać & Rybarczyk, 2008]. The presence of phenolic acids (mainly hydroxycinnamates), flavonoids (including kaempferol and quercetin glycosides, (+)-catechin/(–)-epicatechin and their glycosides), and proanthocyanidins was demonstrated in lentil flour [Amarowicz et al., 2010; Bautista-Expósito et al., 2018b; Paranavitana et al., 2021; Zhang et al., 2015].
Figure 3
SE-HPLC chromatograms of lentil flour and its hydrolysates obtained with pancreatin. The arrows indicate the standards: 1 – bovine serum albumin (66.0 kDa) 2 – cytochrome C (12.4 kDa); 3 – bovine lung aprotinin (6.5 kDa); 4 – bovine insulin chain B oxidized (3.496 kDa); 5 – human angiotensin II (1.046 kDa); 6 – leucine enkephalin (0.556 kDa); 7 – Thr-Tyr-Ser (0.369 kDa). DH – degree of hydrolysis.
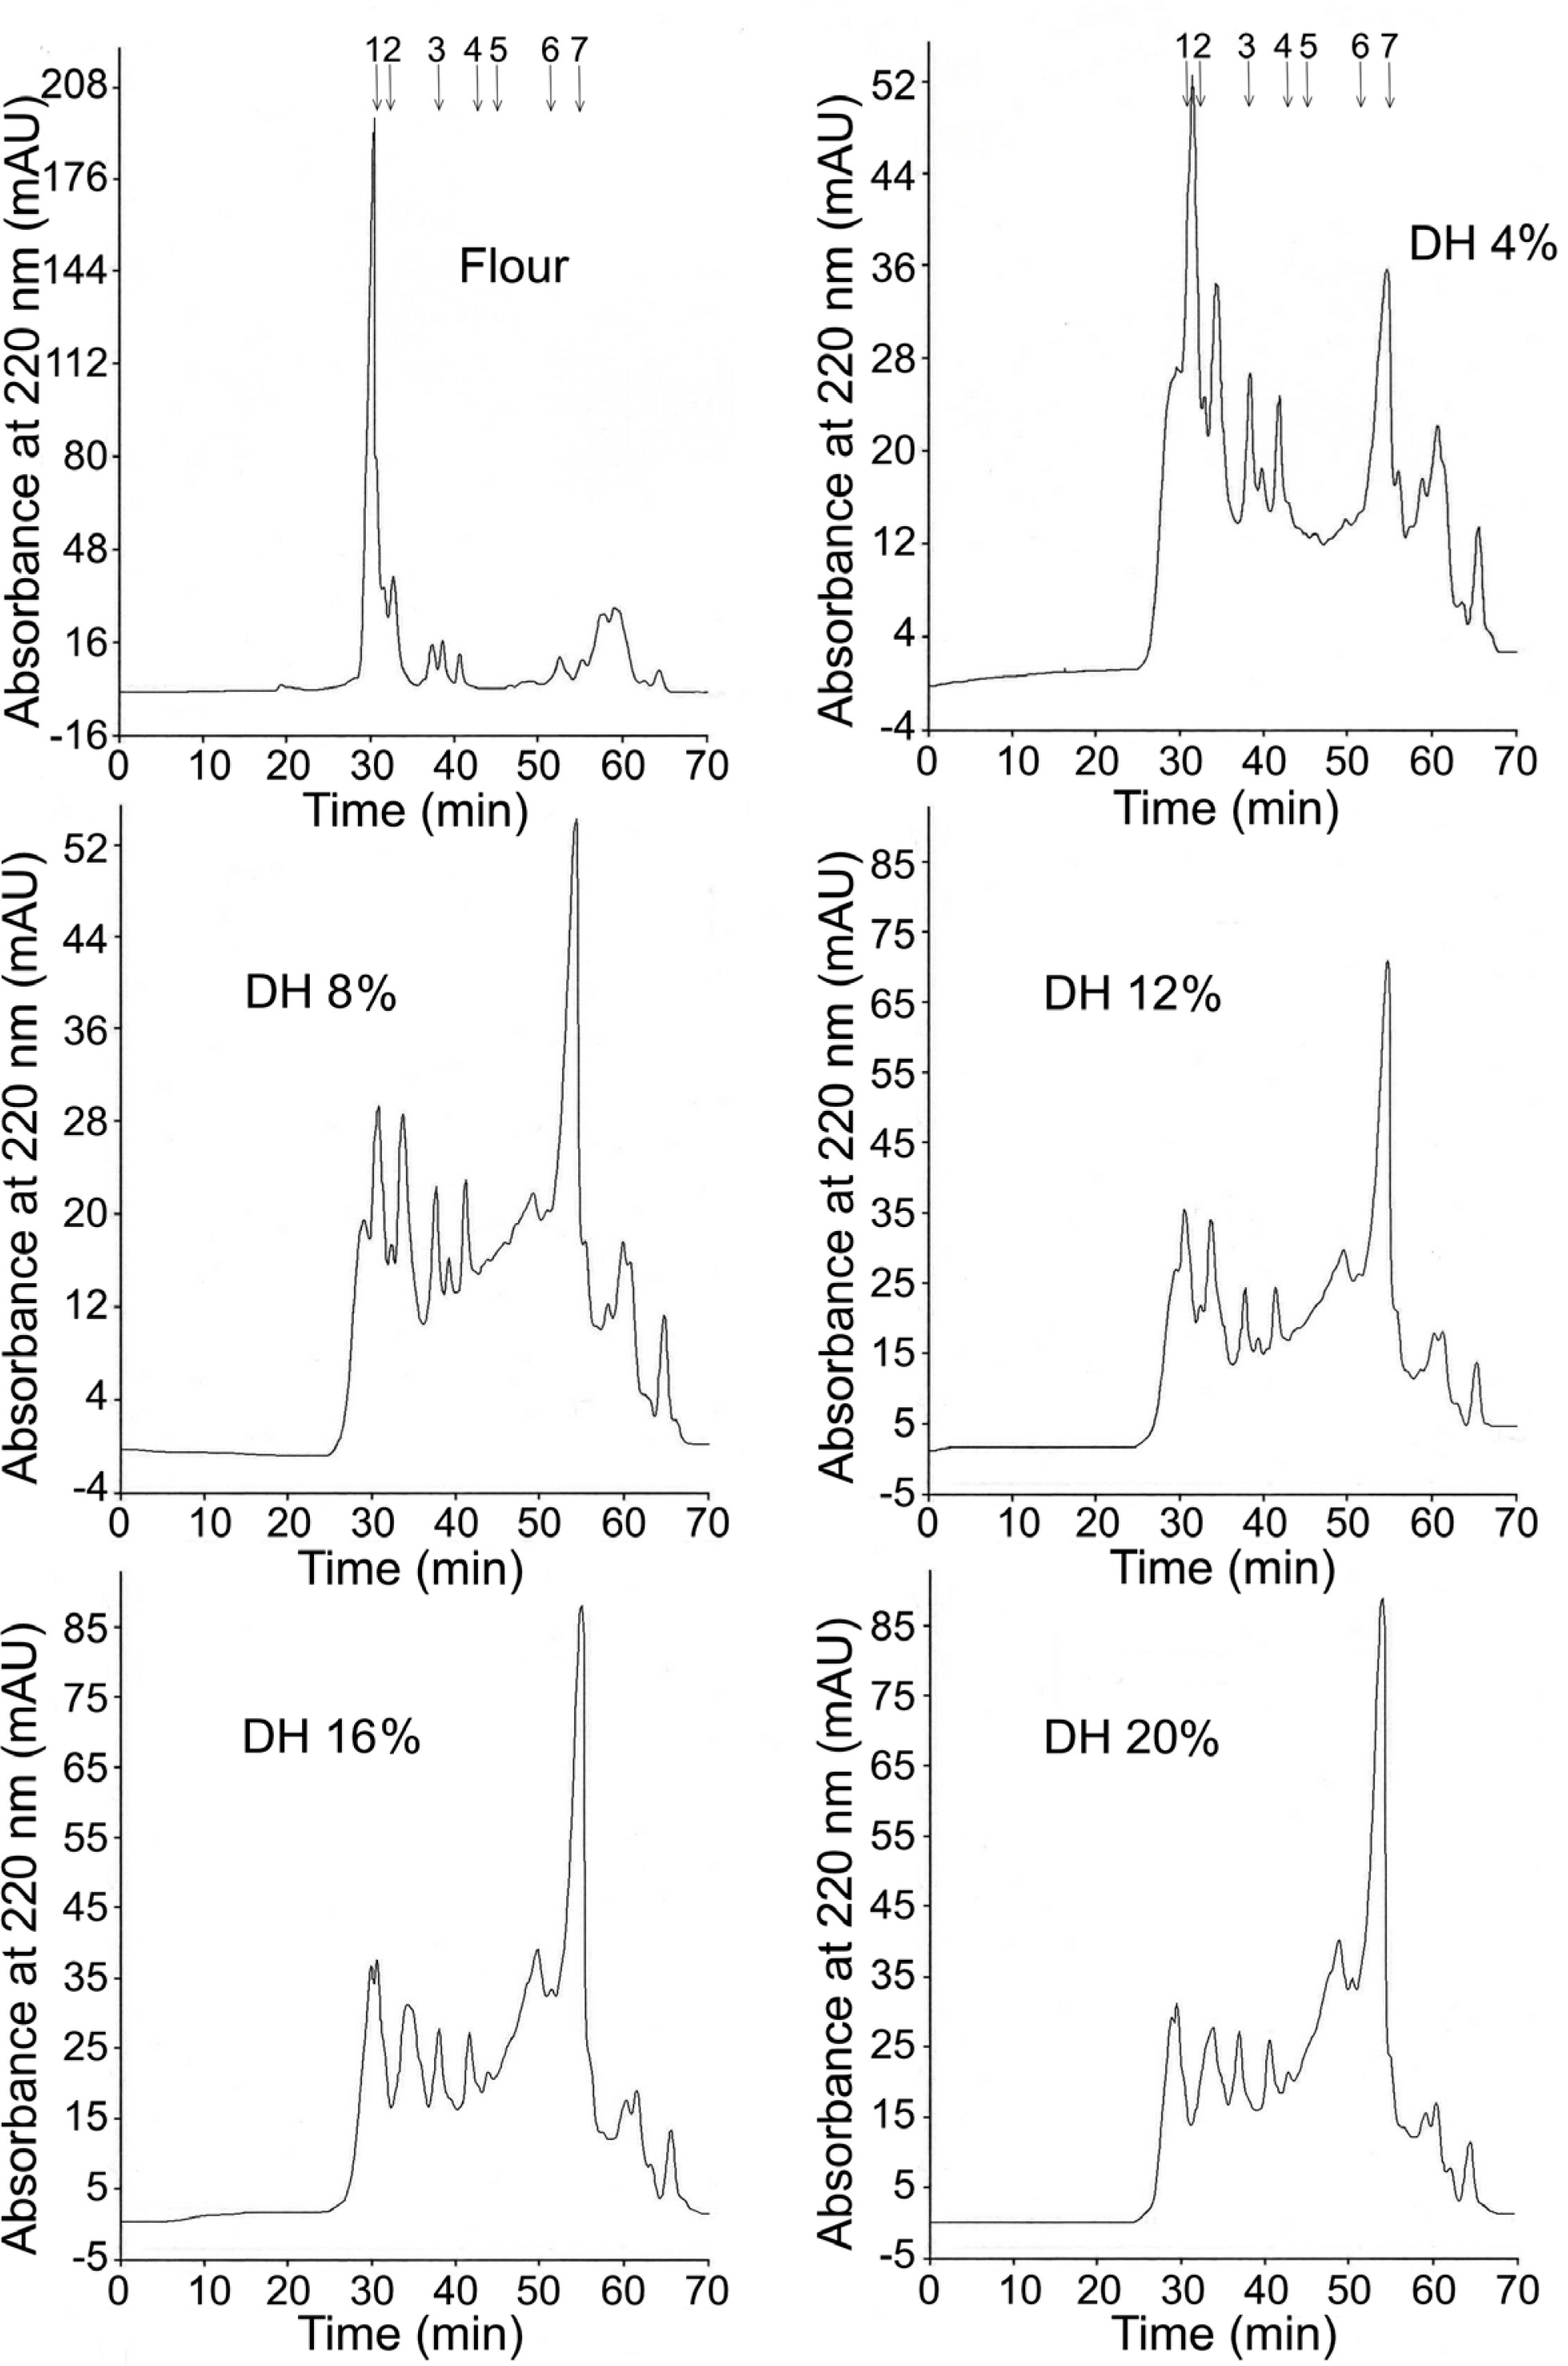
Protein hydrolysis up to DH 4% decreased the height of the SE-HPLC peak originating from the largest lentil proteins (Figure 3). At the same time, the presence of hydrolysis products with MW of 12.4–66.0 kDa, 3.5–6.5 kDa, and 0.369–0.556 kDa was apparent. Chromatograms of the hydrolysates with higher DH revealed successively smaller peaks corresponding to polypeptides with MW of 12.4–66.0 kDa and increasing peaks of compounds with MW of 0.369–1.046 kDa. The comparison of the MW profiles of the hydrolysates of lentil flour treated with pancreatin (Figure 3) to those previously published for hydrolysates obtained with chymotrypsin [Karamać & Rybarczyk, 2008] showed that pancreatin released considerably more products with low MW, especially peptides with MW of 0.369–0.556 kDa.
Radical scavenging activity of lentil flour and hydrolysates
Radical scavenging activity of lentil flour and its hydrolysates was investigated against two synthetic radicals (DPPH• and ABTS•+) and against superoxide (
Figure 4
DPPH• scavenging activity of lentil flour and its hydrolysates obtained with pancreatin. Error bars represent the standard deviations of the means (n=3). Different letters above bars indicate significant differences among samples (p<0.05).
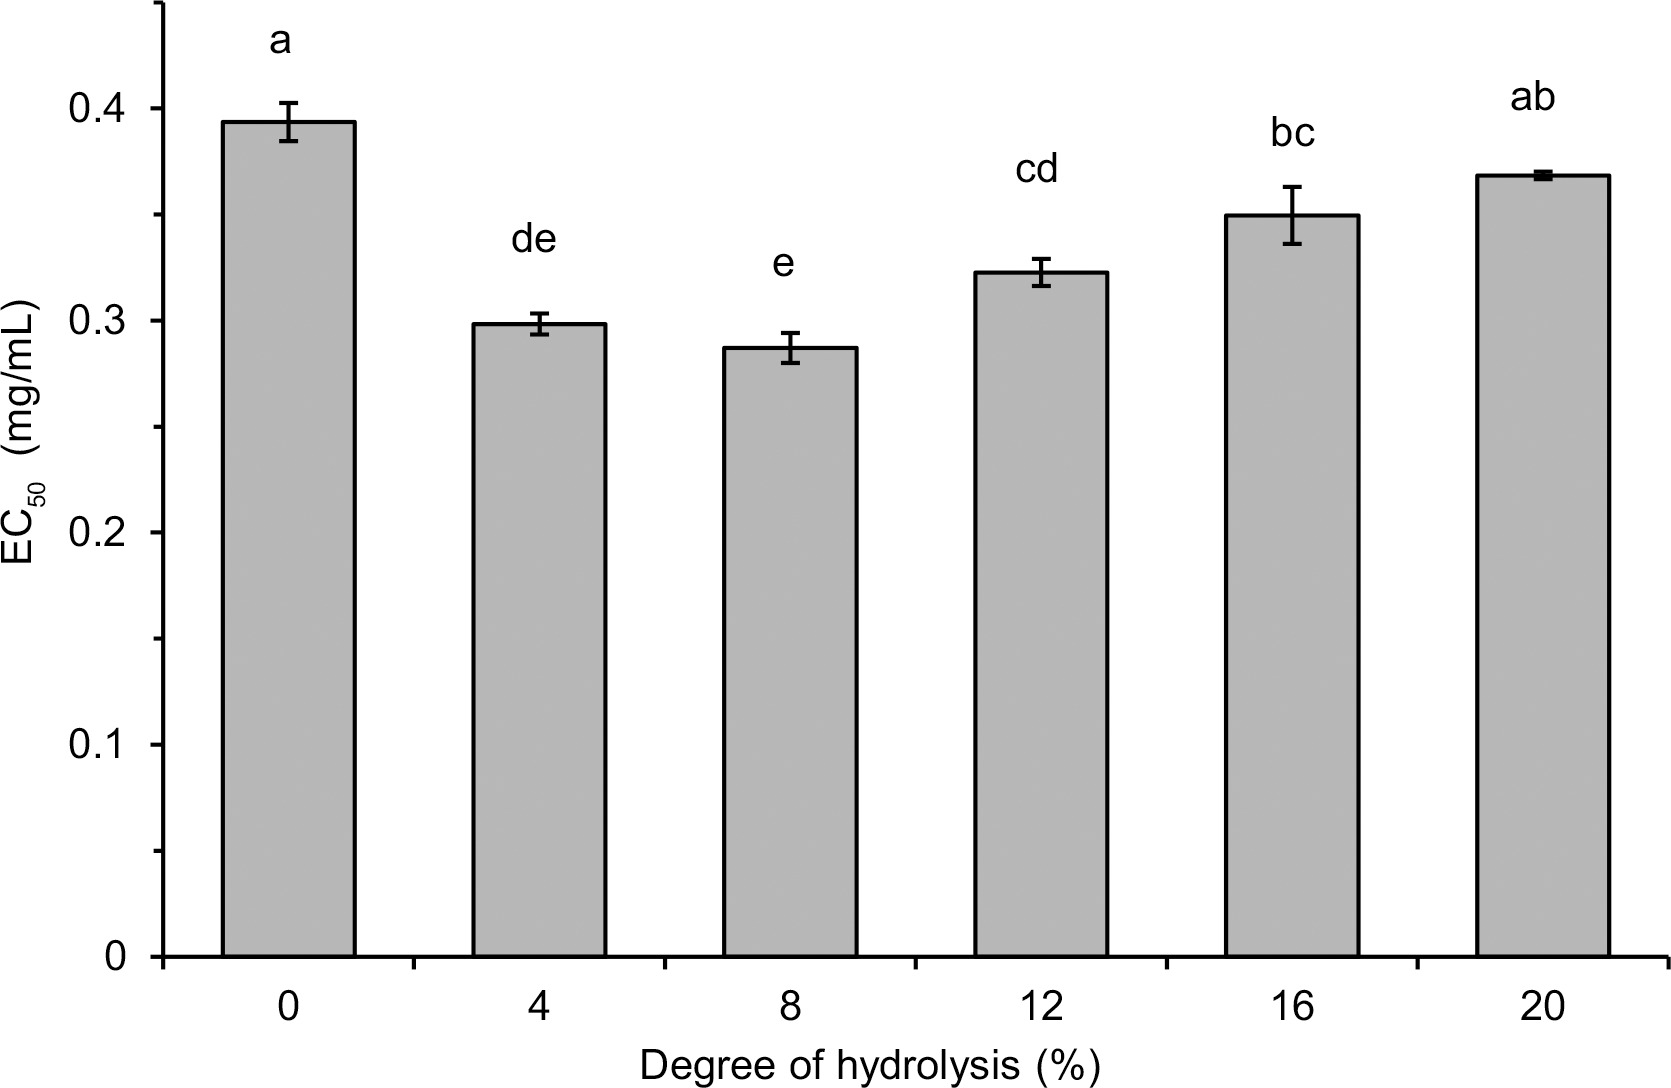
Figure 5
Trolox equivalent antioxidant capacity (TEAC) of lentil flour and its hydrolysates obtained with pancreatin measured by ABTS assay. Error bars represent the standard deviations of the means (n=3). Different letters above bars indicate significant differences among samples (p<0.05).
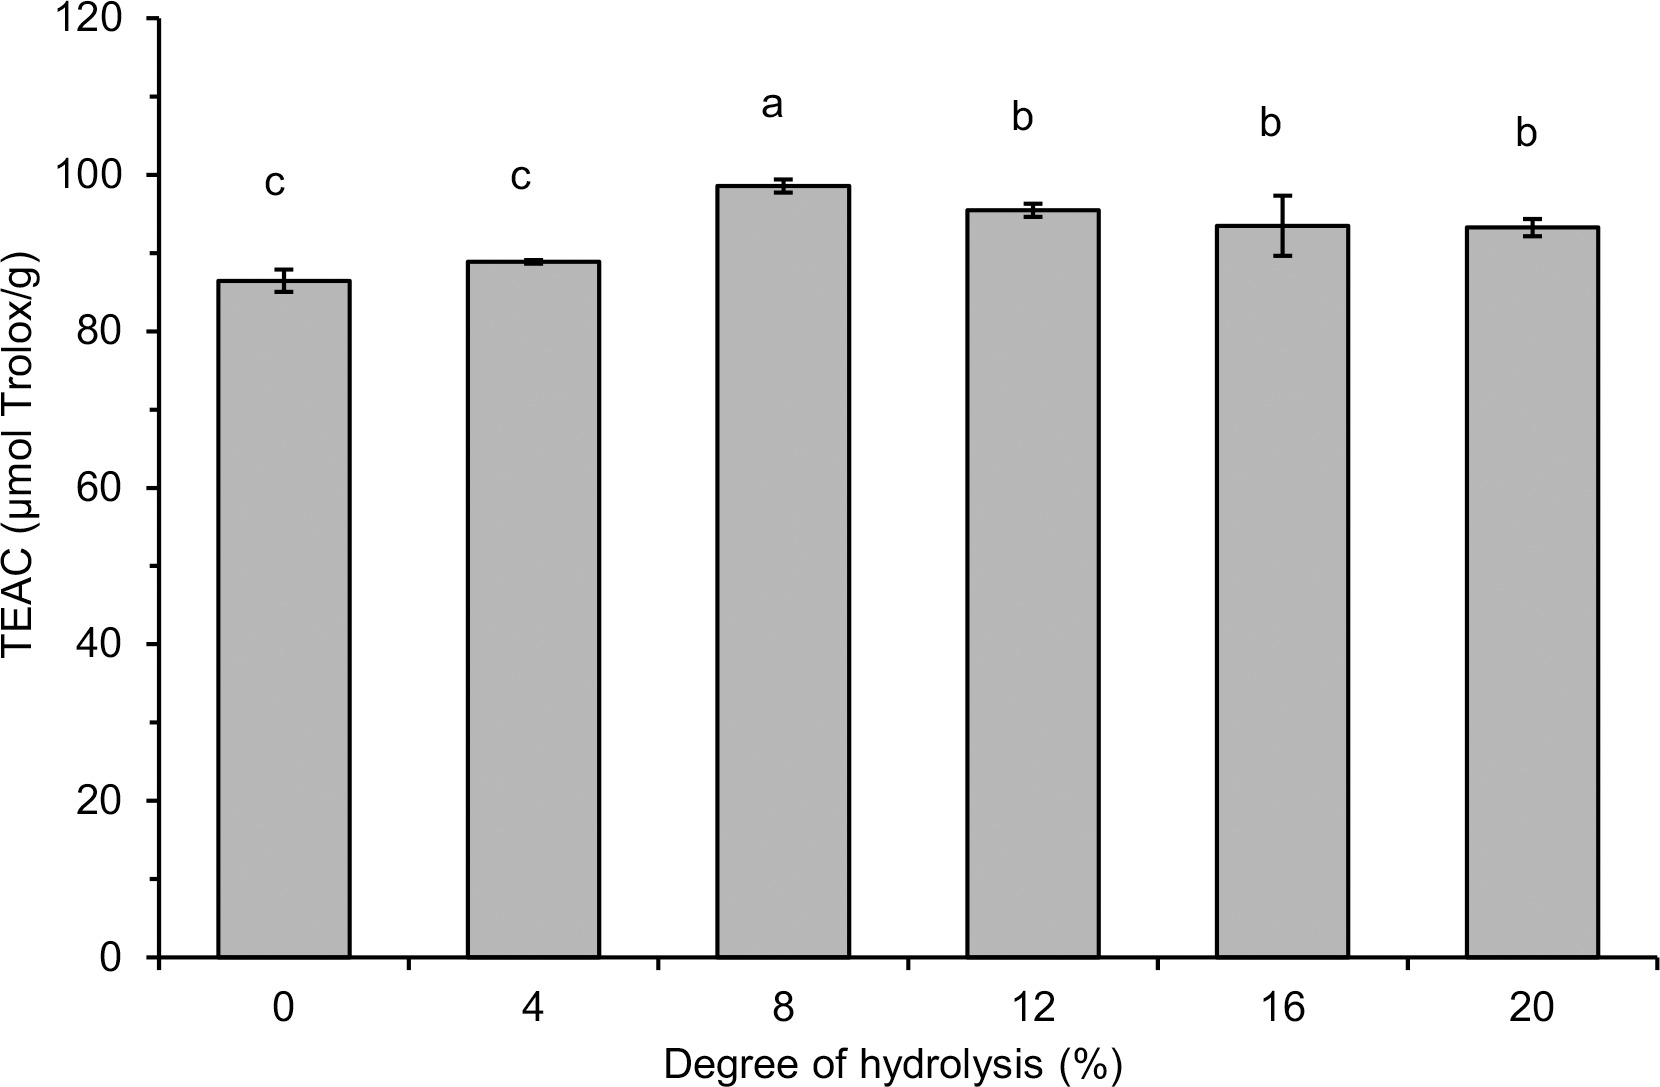
Table 1
Antioxidant capacity of lipid (ACL) and water (ACW) soluble compounds determined by the photochemiluminescence assay as well as total phenolic content (TPC) of lentil flour and its hydrolysates obtained with pancreatin.
Generally, the hydrolysate with DH 8%, which contained polypeptides and peptides with a wide range of MWs, was a stronger free radical scavenger than the hydrolysates with a higher DH (12–16%) and containing low MW peptides (<0.556 kDa) as dominant. This finding does not coincide with previous reports indicating an increase in the radical scavenging activity of hydrolysates with an increase in DH [Karamać et al., 2014; Trigui et al., 2021] and with a decrease in MW of released polypeptides and peptides [Malomo et al., 2020]. On the other hand, some other reports have shown that hydrolysate fractions with peptides having intermediate MW (3–5 kDa, >0.5 kDa) or, comparable as in our study, with a wide range of MWs exhibited the highest antiradical properties [Hwang et al., 2010; Samaei et al., 2021; Tang et al., 2010]. These differences are due to the fact that the antioxidant activity of the released peptides is determined not only by their size, but also by their hydrophobicity as well as the composition and sequence of amino acids [Noman et al., 2022; Udenigwe & Aluko, 2011], which in turn depend on the structure of the parent proteins and the specificity of the proteases used. In the case of lentil protein hydrolysates, the structure of seven peptides (released by Savinase) with antiradical activity measured by the ORAC assay has been identified [García-Mora et al., 2017]. They consisted of 11–17 amino acids with MW in the range of 1.30–2.11 kDa and most of them contained C-terminal residues of Phe or Leu and hydrophobic amino acids (Trp, Tyr, Ile, Leu, Met, Phe) in the sequence. The release of antiradical hydrophobic polypeptides from lentil flour could also explain the PCL assay results in our research. Such peptides were involved in ACL but not in ACW, hence the increase in ACL due to limited hydrolysis and no significant differences in ACW between lentil flour and hydrolysates (Table 1). In turn, the highest radical scavenging activity of lentil flour hydrolysates with low DH (Figure 4, Figure 5 and Table 1) is consistent with the study of Garcia-Mora et al. [2014] who found out, while treating a lentil protein concentrate by Protamex and Savinase, that the highest ORAC was determined for hydrolysates with DH <5% (max. 11%) and ~9% (max. 15%), respectively. However, the hydrolysates obtained with Corolase 7089 and Alcalase exhibited the highest antiradical activity when DH was within a wide range of ~5–10% and ~17–23%, respectively.
In addition to the peptides released during hydrolysis, also phenolic compounds could affect the antiradical activity of lentil flour and hydrolysates. Both low MW phenolics and condensed tannins of lentil seeds are known for their ability to scavenge free radicals [Amarowicz et al., 2010]. In our research, the total content of lentil flour phenolics determined using the method with FCR was 1.129 mg GAE/g (Table 1). The TPC of hydrolysates was significantly higher (1.501–2.168 mg GAE/g) and dependent on DH. The increase in TPC of hydrolysates with their DH was in line with the report showing that treatments of a pinto bean concentrate with Alcalase and Savinase increased the TPC in a time-dependent manner [Garcia-Mora et al., 2015]. The enhanced TPC was also noted as a result of hydrolysis of a lentil protein concentrate with Alcalase and Flavourzyme [Rezvankhah et al., 2021a, b] and simulated in vitro gastrointestinal proteolysis of cooked lentil powder [Zhang & Chang, 2019]. However, when discussing the results of TPC obtained by the method with FCR, the limitations of this method should be taken into consideration. Some polypeptides and peptides released during hydrolysis could further reduce FCR and overestimate the real phenolic content. Indeed, Bautista-Expósito et al. [2018b] determined the phenolic profile of lentil flour and its hydrolysates by HPLC and found that the hydrolysates had a lower phenolic content calculated as a sum of contents of individual compounds than the flour. Nevertheless, the lack of correlation between TPC and the radical scavenging activity of flour and hydrolysates allowed us to speculate that rather the antioxidant polypeptides and peptides released by pancreatin affected the high TEAC, EC50, and ACL of the hydrolysates with low DH.
Ferric reducing antioxidant power of lentil flour and hydrolysates
The FRAP of lentil flour and its hydrolysates with pancreatin are shown in Figure 6. The ability to reduce Fe3+ of all hydrolysates was significantly (p<0.05) higher than that of flour (68.5 μmol Fe2+/g). The highest value was noted for the hydrolysate with DH 4% (109.2 μmol Fe2+/g). For hydrolysates with increasingly higher DH, a successively lower FRAP was determined with the lowest value of 82.3 μmol Fe2+/g (DH 20%). To the best of our knowledge, the reduction of Fe3+(TPTZ)2 by products of lentil protein hydrolysis obtained by any enzyme has not been determined so far. Whereas, an increase in FRAP as a result of protein hydrolysis has been widely reported for proteins of other sources hydrolyzed by various enzymes, e.g., the FRAP values of hydrolysates obtained with papain, trypsin, pancreatin, Alcalase, and Flavourzyme were higher than that of flaxseed protein isolate [Karamać et al., 2016]. Hydrolysis of flour proteins of raw and roasted butterfly pea seeds with bromelain and trypsin also enhanced FRAP values [Ee et al., 2019]. Another example is fluted pumpkin leaf isolate treated with Alcalase, pepsin, trypsin and chymotrypsin, which had higher FRAP than protein substrate [Famuwagun et al., 2020]. The high FRAP of the hydrolysates with low DH was consistent with the results of the radical scavenging activity and, it could be speculated that peptides with a wide range of MWs contributed to the reducing power of lentil flour hydrolysates.
Figure 6
Ferric reducing antioxidant power (FRAP) of lentil flour and its hydrolysates obtained with pancreatin. Error bars represent the standard deviations of the means (n=3). Different letters above bars indicate significant differences among samples (p<0.05).
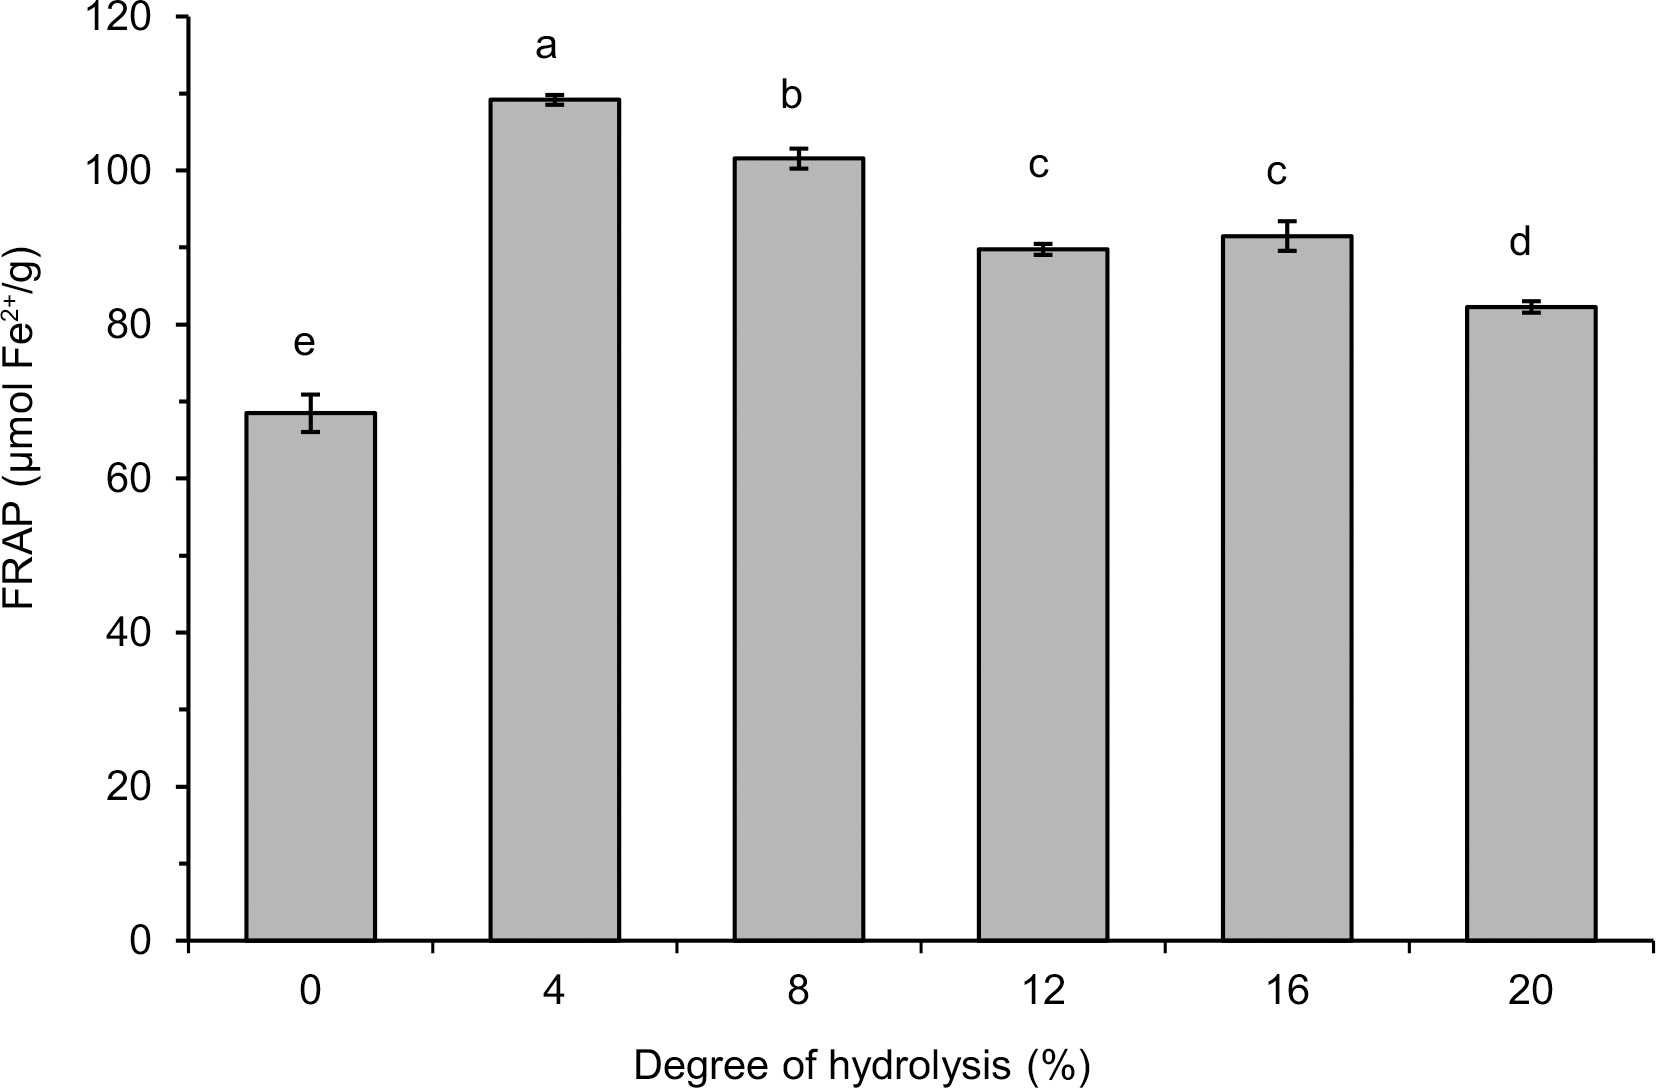
The FRAP values determined in our study were about two-three times lower than those reported for hydrolysates of flaxseed protein isolate produced with pancreatin (0.21–0.25 mmol Fe2+/g) [Karamać et al., 2014]. Pancreatin treatment of the pigeon pea protein isolate also allowed obtaining a hydrolysate with high ability to reduce Fe3+(TPTZ)2 (0.05 mmol Fe2+/mg) [Olagunju et al., 2018]. The lower reducing power of lentil flour hydrolysates compared to the aforementioned hydrolysates of protein isolates may be due to the different structure and amino acid composition of the proteins treated with pancreatin, but also to the high protein content of the isolates when compared with flour.
Fe2+ chelating activity of lentil flour and hydrolysates
The results of determinations of the ability of lentil flour and its hydrolysates obtained with pancreatin to bind ferrous ions are shown in Figure 7.
Figure 7
Fe2+ chelating activity of lentil flour and its hydrolysates obtained with pancreatin. Error bars represent the standard deviations of the means (n=3).
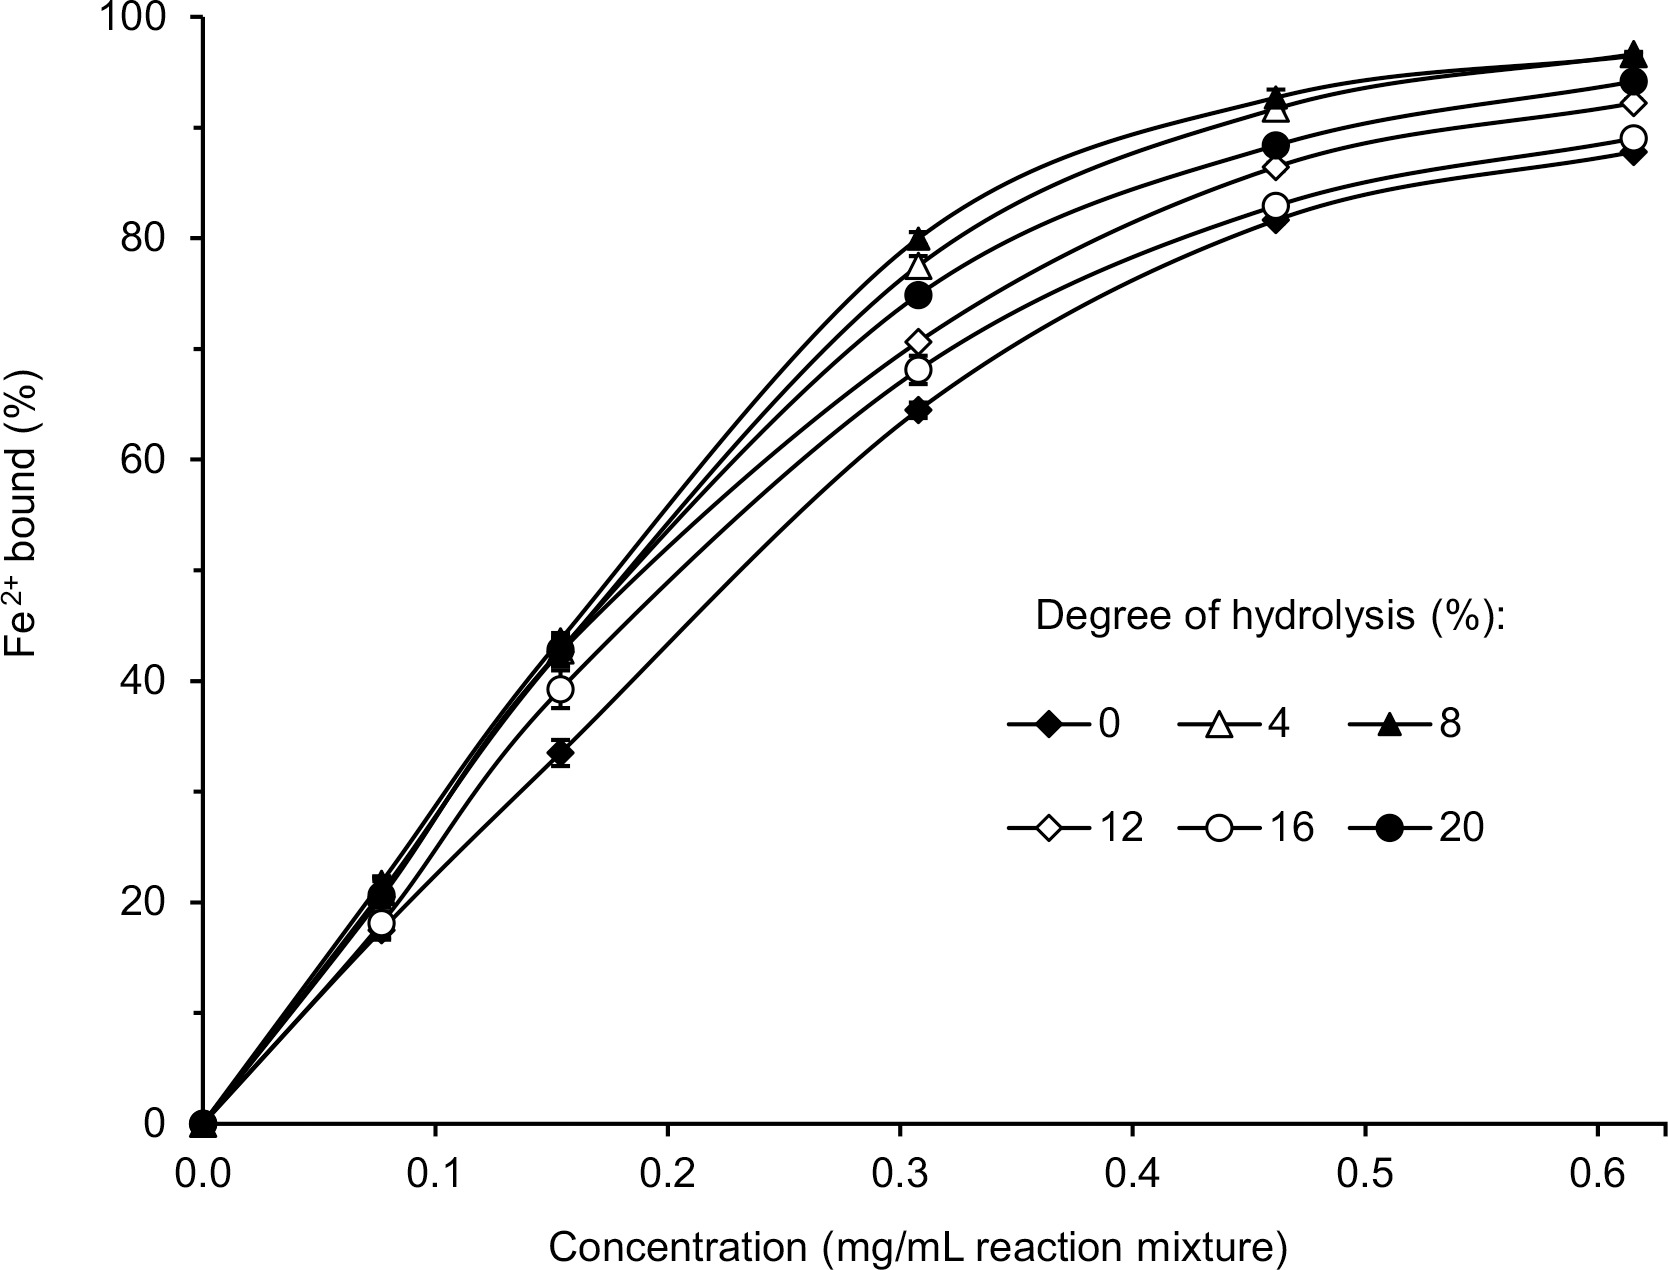
The Fe2+ chelating activity of both the flour and the hydrolysates increased with the increase of their concentration in the reaction mixture. This relationship was linear for up to approximately 0.3 mg/mL. At that concentration, the compounds of the hydrolysate with DH 8% bound 80% of ferrous ions, and the Fe2+ chelating activity decreased for hydrolysates with the following DH: 8% > 4% > 20% > 12% = 16%. The Fe2+ chelating activity of lentil flour was the lowest (64.5%). Although data on chelation of ferrous ions by lentil protein hydrolysis products are lacking in the literature, the improvement in Fe2+ binding capacity as a result of enzymatic hydrolysis is not surprising and was reported for various plant proteins treated with different enzymes [Famuwagun et al., 2020; Karamać et al., 2016; Zhang et al., 2014]. Also, the high Fe2+ chelating activity of hydrolysates with a relatively low DH was reflected in a previous study [Zhang et al., 2014]. The authors showed that the hydrolysate of soybean protein isolate with Flavourzyme with DH 6.79% had a significantly higher iron-binding capacity than hydrolysates with higher DH (up to 11.17%).
The percentage of ferrous ions bound (77.5–80.0%) by the most active hydrolysates (DH 4–8%) was relatively high considering their concentration in the reaction mixture (0.3 mg/mL) (Figure 7). Malomo et al. [2020] reported that the Fe2+ chelating activity of the hydrolysates of cashew nut and fluted-pumpkin proteins was approximately 20% and 95%, respectively, but at their higher concentration in the reaction mixture (1 mg/mL). Also, flaxseed protein hydrolysate obtained with pancreatin was used at a much higher concentration (1.54 mg/mL) to achieve the ferrous ion binding capacity of 71.5% [Karamać et al., 2016]. The high Fe2+ chelating activity in our study could be due to the presence of phenolic compounds in the samples. It is known that phenolic compounds, especially tannins, form chelates with ferrous ions [Karamać & Pegg, 2009].
CONCLUSIONS
Treatment of lentil flour with pancreatin allowed the hydrolysis of its proteins to DH 22%. Hydrolysates with increasingly higher DH contained polypeptides and peptides with increasingly lower molecular weights, but some basic subunits of lentil 11S globulin seemed to be quite resistant to digestion with pancreatin. The antiradical activity, reducing power, and Fe2+ chelating activity of lentil flour have been improved upon hydrolysis of its protein with pancreatin. Regardless of the mechanism of antioxidant action taken into account, the highest antioxidant capacity had hydrolysates with low DH (4–8%). The polypeptides and peptides with a wide range of molecular weights released from lentil proteins were responsible for enhanced antioxidant capacity of these hydrolysates. In turn, the total phenolic content of the hydrolysates determined with FCR increased with increasing DH. In conclusion, a limited hydrolysis with pancreatin could be recommended to improve the antioxidant capacity of lentil flour. Thus obtained hydrolysates with health benefits can be considered as an ingredient of functional foods. However, their use for this purpose requires future research.