
INTRODUCTION
Composite bread is formulated through the incorporation of wheat and non-wheat flours, primarily to reduce dependence on wheat flour and promote the utilization of locally available raw materials. The development of composite bread is closely associated with food security strategies, as it supports the diversification of carbohydrate sources and mitigates reliance on imported wheat. In recent years, the consumption of composite bread has increased substantially, driven by growing consumer awareness of healthier and diverse dietary patterns. Nevertheless, wheat flour remains a critical component in breadmaking due to the functional role of gluten in imparting elasticity and gas-holding capacity to the dough. The formation of a continuous gluten network enables the retention of gases produced during fermentation, thereby resulting in a light and porous crumb structure [Ronie et al., 2021]. Based on available evidence, non-wheat flours have not been reported to fully mimic the functional properties of gluten in breadmaking. Several studies have indicated that acceptable mechanical characteristics are typically achieved only when wheat flour substitution levels are kept below 30 g/100 g, such as in formulations containing 20 g/100 g pedada flour [Irmawati et al., 2024], and red bean flour at 10 g/100 g [Espinosa-Ramírez et al., 2022].
Orange sweet potato flour represents a promising alternative to wheat flour due to its favorable starch composition and nutritional value. Content of amylose and amylopectin in its starch is approximately 18–24 g/100 g and 76–82 g/100 g, respectively [Wang et al., 2020], which is comparable to the profile of wheat starch (14–19 g/100 g and 81–86 g/100 g, respectively) [Valková et al., 2019]. However, similar starch composition does not always result in similar bread quality because starches from tuber crops behave differently from cereal starches. In addition, orange sweet potato is rich in β-carotene, a precursor of vitamin A, thereby providing enhanced nutritional benefits relative to wheat flour [Malavi et al., 2022]. Indonesia also reports a substantial production of orange sweet potato, reaching 1.4 million tons in 2024 [Ministry of Agriculture of the Republic of Indonesia, 2024]. Collectively, these factors highlight its potential as a raw material for breadmaking. The relative proportion of amylose and amylopectin is key determinant of bread structure and texture: amylose contributes to the formation of a stronger starch network, whereas amylopectin enhances starch granule swelling and water absorption during baking, thereby influencing bread volume and crumb characteristics [van Rooyen et al., 2023]. However, the leaching of amylose from starch granules during baking may accelerate starch retrogradation upon cooling, thereby contributing to crumb firming, while excessive amylopectin may result in sticky dough with inferior handling properties. These phenomena may ultimately shorten bread shelf-life [Chen et al., 2021].
The incorporation of non-wheat flours at substitution levels exceeding 30 g/100 g remains a technological challenge, particularly with respect to dough rheology and loaf volume. One potential approach to overcome these limitations is starch modification through enzymatic hydrolysis using amylase. Amylase catalyzes the hydrolysis of starch polymers into shorter chains, thereby influencing viscosity, water absorption, and dough rheology [Chen et al., 2021]. Bacillus spizizenii ATCC 6633 has been reported to produce amylase suitable for food industry applications, as the enzyme exhibits stability at elevated temperatures, indicating thermal stability under baking conditions [Maity et al., 2015]. In parallel, hydrocolloids have been reported to partially mimic the structural functionality of gluten, leading to improvements in loaf volume, crumb texture, and storage stability [Irondi et al., 2023]. Hydroxypropyl methylcellulose (HPMC) is one of the most widely used among the hydrocolloids commonly applied in composite breadmaking, as it has been shown to exert superior functionality by stabilizing gas cells and promoting a fine crumb structure [Sadat et al., 2023].
Previous studies have reported that various non-wheat flours hydrolyzed by amylase from different microbial sources have been successfully applied in composite breadmaking. For instance, amylase-hydrolyzed rice flour and purple sweet potato flour have been shown to increase specific volume of loaf and improve its texture compared to loaves made using untreated flours [Freire et al., 2025; Safari et al., 2013]. Furthermore, studies have also demonstrated that the addition of HPMC to composite breads based on rice, corn, and potato flours resulted in improved crumb softness and optimal loaf volume [Belorio & Gómez, 2020]. To date, there is limited information regarding the combined use of amylolytically-hydrolyzed orange sweet potato flour and hydrocolloids to enhance the quality of composite bread. Based on these considerations, the objective of this study was to evaluate the effect of substituting wheat flour with α-amylase-hydrolyzed orange sweet potato flour and adding HPMC on the physical quality characteristics of breads and to identify the most promising formulation.
MATERIALS AND METHODS
Materials
The materials used in this study included B. spizizenii ATCC 6633 (Bio-Microbiology Laboratory Collection, Food Technology Department, Prasetiya Mulya University, Tangerang, Indonesia); starch substrate, nutrient agar, and nutrient broth (Merck, Darmstadt, Germany) for microbial cultivation; pure amylose and amylopectin for amylose content determination (Merck); and distilled water (Evoqua, Pittsburgh, PA, USA). The main ingredients for breadmaking were wheat flour (Indofood, Jakarta, Indonesia), orange sweet potato flour (Selera Organik, Bantul, Indonesia), water, sugar powder (GMP, Central Lampung, Indonesia), salt (Susanti Megah, Tangerang, Indonesia), margarine (Upfield, Cikarang, Indonesia), yeast (Lesaffre, Wavrin, France), milk powder (Karya Pranata, Bekasi, Indonesia), and HPMC (Jaya Mulyo, Bantul, Indonesia).
Experimental design
The study employed a randomized block design with two factors and three replications. The experimental factors were the proportion of amylolytically-hydrolyzed orange sweet potato flour (HOSPF) in a blend with wheat flour (0, 15, 30, 45, and 60 g/100 g) and the addition level of HPMC to a flour blend (0, 1.5, and 3 g/100 g). Each treatment combination was coded as A*H*, where A represents the level of HOSPF (A0, A1, A2, A3, and A4, respectively) and H represents the addition level of HPMC (H0, H1, and H2, respectively). For example, A4H1 corresponds to substituting wheat flour with 60 g HOSPF per 100 g of the flour blend and adding 1.5 g HPMC to 100 g of the flour blend. In negative control, only non-hydrolyzed orange sweet potato flour (NHOSPF) was used, and positive control was prepared from wheat flour. The research was conducted in several stages. Initially, orange sweet potato flour was hydrolyzed using amylase produced by B. spizizenii ATCC 6633, followed by evaluation of its functional properties. Subsequently, composite bread was prepared using HOSPF with HPMC incorporation. The resulting breads were then evaluated for physical properties. Finally, the quality of the selected composite bread formula was compared with that of conventional wheat-based bread.
Obtaining crude amylase and amylolytic hydrolysis of orange sweet potato flour
Inoculum preparation and α-amylase production were performed following the method previously used by Abd-Elaziz et al. [2020], with some modifications. B. spizizenii ATCC 6633 was first activated on nutrient agar and incubated at 37°C for 24 h. A loopful of culture was subsequently transferred into nutrient broth and cultivated at 30°C with agitation at 2.3×g until an optical density (OD580) of 0.8 was reached, corresponding to the exponential growth phase. The resulting culture was used as inoculum at 10% (v/v) and introduced into a fermentation medium consisting of nutrient broth supplemented with 2% starch substrate. Fermentation was carried out at pH 7, 30°C, and 2.3×g for 48 h. Following fermentation, the culture medium was centrifuged at 3,260×g for 25 min (Thermo Fisher Scientific, Waltham, MA, USA) to separate the bacterial biomass from the liquid fraction. The recovered supernatant was collected and used as the crude α-amylase extract. Amylase activity was determined according to the procedure described by Punia et al. [2016], with some modifications. Briefly, 0.1 mL of a crude α-amylase extract diluted 100-fold with distilled water was mixed with 0.9 mL of phosphate-citrate buffer (pH 7) and incubated at 37°C for 5 min. Subsequently, 2 mL of 2% gelatinized starch was added and further incubated at 37°C for 30 min. The reaction was terminated by adding 3 mL of dinitrosalicylic acid (DNS) reagent, followed by boiling at 90°C for 5 min, then cooling and adjustment to ambient temperature. The absorbance was measured using a spectrophotometer (Shimadzu, Kyoto, Japan) at λ=540 nm, and glucose was used to construct a standard curve. One unit of amylase activity was defined as the amount of enzyme that releases 1 μmol of glucose per min under assay conditions.
Based on the measured enzyme activity, the required volume of enzyme solution was calculated to obtain a dosage of 50 U/g flour. The enzyme was then applied to hydrolyze a sweet potato flour suspension (20 g/100 mL of distilled water, pH 7) for 24 h at 25°C [Safari et al., 2013]. The amylase was subsequently inactivated, and the flour suspension was simultaneously concentrated by heating the hydrolysate at 80°C for 150 min. The hydrolyzed flour was then washed with distilled water, dried at 60°C for 16 h, and used for bread preparation.
Determination of physical properties of flours
Color
Color of hydrolyzed and unhydrolyzed orange sweet potato flours, as well as wheat flour was evaluated using the CIELab color system using the colorimeter (ColorFlex EZ HunterLAB instrument, Reston, VA, USA). It was calibrated using the manufacturer’s standard white and black calibration tiles prior to analysis. Color parameters were measured under illuminant D65 and a 10° standard observer. The parameters L* (lightness 100 – darkness 0), a* (redness +a* – greenness −a*), and b* (yellowness +b* – blueness −b*) were recorded.
Gel hydration properties and moisture content
The water absorption index (WAI) and water solubility index (WSI) of flours were measured by placing 1 g of the sample into a 15 mL centrifuge tube, followed by the addition of 10 mL of distilled water at 25°C for 30 min. The tube was centrifuged at 1,449×g for 10 min. The supernatant was removed and placed into an evaporating dish, while the resulting gel was weighed. The WAI was calculated as the ratio of the hydrated gel to the initial dry sample weight (g/g). The WSI was determined by drying the collected supernatant at 105°C for 4 h to obtain the dissolved solids. WSI was expressed as a percentage (%) and calculated as the ratio of the weight of the dissolved solids to the initial dry sample weight, multiplied by 100 [Yea et al., 2019]. The moisture content of the flours was determined by drying the samples in a forced-draft oven (BINDER, Tuttlingen, Germany) at 105°C for 3 h [AOAC, 2006].
Pasting properties
Pasting properties were measured using a Rapid Visco Analyzer (RVA 4500; Perten Instruments, Hägersten, Sweden) following the procedure described by Martínez et al. [2015], with some modifications. The flour slurry was prepared by mixing 3.5 g (±0.1) of flour with 25 g (±0.1) of distilled water. The slurry was stirred at 960 rpm for 10 s and subsequently at 160 rpm throughout the analysis. The temperature profile consisted of holding at 50°C, heating from 50 to 95°C at 12°C/min, holding at 95°C for 2.5 min, cooling to 50°C at 12°C/min, and holding at 50°C for 2 min. The RVA pasting profile was used to determine pasting temperature (°C), peak viscosity, final viscosity, breakdown viscosity, and setback viscosity. Breakdown viscosity was calculated as the difference between peak viscosity and trough viscosity, whereas setback viscosity was calculated as the difference between final viscosity and trough viscosity. All viscosity values were expressed in mPa×s.
Microstructure
Micrographs of flours were obtained using a Zeiss EVO MA10 scanning electron microscope (SEM; Zeiss, Oberkochen, Germany). The instrument was equipped with a tungsten filament, and operated at 9 mm working distance, as well as an accelerating voltage of 10 kV. The samples were sprayed and coated with gold, and then observed at a magnification of ×2,000.
Determination of the chemical composition of flours
Reducing sugar content
Reducing sugar content of hydrolyzed and unhydrolyzed orange sweet potato flours, as well as wheat flour was determined using DNS method [Miller, 1959]. Samples were 100-fold diluted with distilled water, and 2 mL of the resulting suspension were mixed with 3 mL of the DNS reagent. The mixture was boiled at 90°C for 5 min, then cooled and adjusted to ambient temperature. The absorbance was measured using a spectrophotometer (Shimadzu) at a wavelength of 540 nm. The amount of reducing sugars was calculated using a glucose standard curve and corrected for the dilution factor. The results were expressed as g of glucose equivalent per 100 g of flour.
Content of total starch, amylose, and amylopectin
Amylose and amylopectin contents were determined using the spectrophotometric method by Reddappa et al. [2022], with some modifications. Approximately 100 mg of the sample were treated with 500 μL of aqueous ethanol (80 g/100 mL) to remove soluble non-starch compounds, and centrifuged at 16,099×g for 5 min. The process was repeated twice. The pellet was washed with 500 μL of a 0.1 M NaCl solution with toluene (10 g/100 mL) and re-washed with aqueous ethanol (80 g/100 mL), then dried at 80°C for 4 h to obtain a purified starch residue. A total of 25 mg of starch residue were solubilized in 2.5 mL of 1 M NaOH and heated in a boiling water bath for 15 min. After cooling, the volume was adjusted to 25 mL with distilled water. An aliquot of 1.25 mL was treated with 150 μL of 1 M acetic acid, 100 μL of 1 M NaOH, and 500 μL of a potassium iodide solution, then adjusted to 25 mL with distilled water. The mixture was incubated for 20 min at room temperature, and absorbance was measured at 620 nm using a spectrophotometer (Shimadzu). Amylose content was calculated from a standard curve for pure amylose and amylopectin (Merck) mixtures with ratios ranging from 100:0 to 0:100 (w/w) and expressed as g per 100 g flour on a dry weight basis. The total starch content was obtained from 25 mg of the purified starch residue. Amylopectin content was calculated by subtracting the amylose content from the total starch content.
β-Carotene content
β-Carotene content was determined using high-performance liquid chromatography (HPLC) on an Agilent 1200 series system (Agilent Technologies, Santa Clara, CA, USA). Chromatographic separation was performed on a reversed-phase C18 column following the method of Rathi et al. [2022]. The mobile phase consisted of methanol and ultrapure water, used under gradient elution from 95:5 (v/v) to 100:0 (v/v) in 15 min, 100:0 (v/v) in 27 min and back to 95:5 (v/v) in 3 min, giving a total run time of 45 min. The flow rate was maintained at 0.8 mL/min, the column temperature at 30°C, and the injection volume was 20 μL. Detection was carried out at 440 nm. β-Carotene was identified by comparing retention time and absorption spectra with those of authentic standards. Quantification was performed using the external standard calibration method. β-Carotene standard (≥93% purity) was obtained from Sigma-Aldrich (St. Louis, MO, USA). Results were expressed as mg/kg flour sample.
Bread preparation
Wheat bread was prepared using a formulation consisting of 100 g of total flour, 11.11 g of powdered sugar, 1.94 g of yeast, and 16.67 g of milk powder. In composite bread formulations, a portion of wheat flour was substituted with HOSPF in accordance with experimental design. A bread sample with complete wheat flour substitution with NHOSPF was prepared as well. All dry ingredients were mixed for 1 min, followed by the addition of 66.67 g of water, HPMC at the level specified by the experimental design (g/100 g of total flour blend), 0.17 g of salt, and 11.11 g of margarine. The dough was then kneaded until a smooth and elastic consistency was achieved. Subsequently, the dough was proofed at 25°C for 20 min, remixed, divided into two equal portions, placed into baking molds (17×8×7 cm), and allowed to undergo a second proofing at 25°C for 15 min. The dough was then baked at 180°C for 35 min using an electric oven (KAO-K30, Konka, China). After baking, the bread was cooled at ambient temperature for 2–4 h prior to analysis [Bakare et al., 2016].
Determination of physical characteristics of breads
Loaf volume and specific volume
Loaf volume was measured based on the rapeseed displacement technique, modified by replacing rapeseed with mung beans [Manyatsi et al., 2020]. The method is based on the principle that the volume of the bread corresponds to the volume of granular material displaced. The loaf volume was calculated as the difference between the volume of the measuring container and the volume occupied by the mung beans after bread insertion. Specific volume was calculated by dividing loaf volume by its weight (mL/g) [Guan et al., 2023].
Texture profile
Three bread slices, including the central slice and one from each side, were used for texture profile analysis (TPA) using a texture analyzer (TX-700, Lamy Rheology Instruments, Champagne-au-Mont-d’Or, France). Analysis was performed at room temperature under the following conditions: a 50-mm stainless cylinder (TX-PL50SS) as the probe, a 10 kg load, 1 mm/s of speed, 5 mm of distance, 1 N of sample detection, 1 mm/s speed for return, and 5 mm position for return. The testing method followed that of Wang et al. [2006], with parameters analyzed including cohesiveness, chewiness (N), resilience, and hardness (N). Texture parameters were determined from the force–time curves generated during analysis. Hardness was defined as the maximum force during the first compression cycle. Cohesiveness was calculated as the ratio of the area under the second compression curve to that under the first compression curve. Chewiness was calculated as the product of hardness, cohesiveness, and springiness, while resilience was determined as the ratio of the recovery area to the compression area during the first cycle.
Dough rheology
Three composite bread samples were selected based on their physical property scores (as presented in Table S1 in Supplementary Materials), representing the best-performing formulations, for further dough rheology analysis. Dough machinability was assessed by TPA determination in a TX-700 texture analyzer (Lamy Rheology Instruments) by using a 5-cm diameter probe, 75 s waiting period, and 60 g/100 g compression as described previously by Angioloni et al. [2008]. The measured parameters included cohesiveness, chewiness (N), resilience, and hardness (N).
Statistical analysis
All experiments were conducted in triplicate. Results are expressed as mean and standard deviation (SD). Two-way analysis of variance (ANOVA) was used for physical characteristics of breads; one-way ANOVA for flour characteristics and dough rheology, followed by Tukey’s multiple comparison test to determine significant differences among means at a significance level of p<0.05. Statistical analysis was carried out using XLSTAT 2025 Statistical Software (Lumivero, Denver, CO, USA).
RESULTS AND DISCUSSION
Use of the crude amylase preparation
Due to the lack of a purification step, crude bacterial enzymes are economically cheaper to produce than purified commercial enzymes and can be cost-effective in applications [Mahfudz et al., 2024]. Therefore, in our study, crude amylase from B. spizizenii ATCC 6633 was obtained and used for the hydrolysis of orange sweet potato flour. A fixed enzyme dosage of 50 U/g flour was applied following the method of Safari et al. [2013], who reported that this dosage was sufficient to achieve partial hydrolysis of purple sweet potato flour and to improve the swelling volume and firmness of wheat–purple sweet potato composite bread. In addition, previous studies have demonstrated that crude microbial enzyme preparations may contain multiple carbohydrases that are capable of synergistically improving dough rheology and bread quality [Hmad et al., 2024]. However, no additional enzymatic activities of the crude amylase preparation obtained in our study were determined. Therefore, the effects observed are discussed primarily in relation to the action of α-amylase.
Physical properties of flours
Color of flours
HOSPF exhibited a significantly darker color than NHOSPF and wheat flour (Figure 1). Considering color parameters, HOSPF had the lowest L* value (68.29), followed by NHOSPF (77.47), while wheat flour showed the highest L* value (93.28) (Table 1). In contrast, HOSPF exhibited the highest redness (a* – 14.43) and yellowness (b* – 24.44), followed by NHOSPF (13.38 and 23.20, respectively), whereas wheat flour exhibited an a* value close to zero (0.38), indicating almost no red or green hue, as well as the lowest b* value (10.44). The reddish-yellow hue of HOSPF and NHOSPF may be due to the presence of carotenoids. In turn, the more intense reddish-yellow color of HOSPF was probably associated with the combined effects of enzymatic hydrolysis and subsequent heat treatment (enzyme inactivation at 80°C for 150 min and flour drying at 60°C for 16 h). Enzymatic hydrolysis increased the reducing sugar content, while orange sweet potato flour naturally contains proteins [Olugbuyi et al., 2024], which provide amino groups that participate in the Maillard reaction [Rebholz et al., 2021]. Therefore, interactions between reducing sugars and amino groups may have promoted non-enzymatic browning during these subsequent heat-treatment steps, resulting in the formation of brown-colored compounds and a darker flour color. Similar observations were reported by Pongpaiboon et al. [2016], who suggested that the darker color of α-amylase-treated rice flour might be related to Maillard reactions between reducing sugars and amino groups during processing. Moreover, previous studies have demonstrated that moderate heat treatment (60–70°C) can promote Maillard reactions in food matrices containing reducing sugars and amino groups, contributing to browning during drying [Chaipoot et al., 2026].
Figure 1
Color of (A) wheat flour, (B) non-hydrolyzed orange sweet potato flour (NHOSPF), and (C) hydrolyzed orange sweet potato flour (HOSPF).
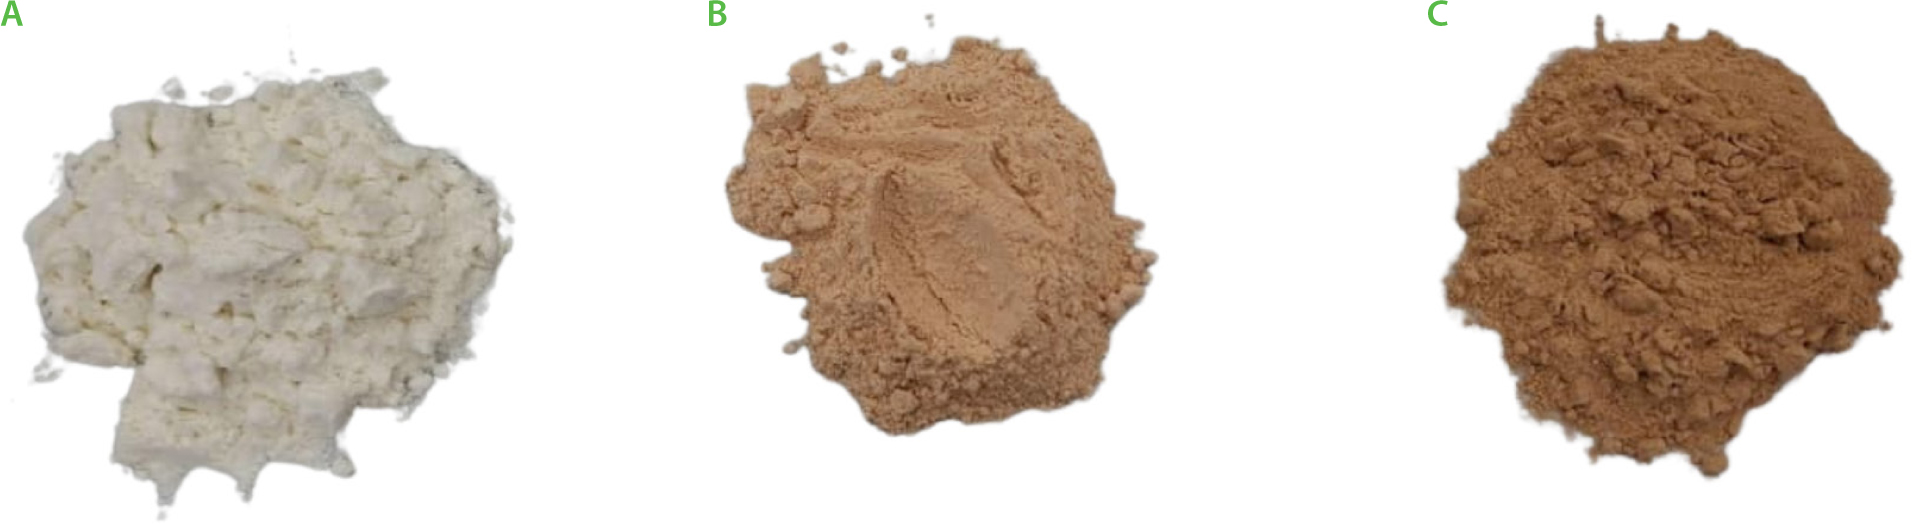
Table 1
Physical and chemical properties of wheat flour, non-hydrolyzed orange sweet potato flour (NHOSPF), and hydrolyzed orange sweet potato flour (HOSPF).
[i] Values are expressed as mean ± standard deviation. Mean values within the same row followed by different letters are significantly different (p<0.05) according to Tukey’s multiple comparison test. WAI, water absorption index; WSI, water solubility index; L*, lightness; a*, redness–greenness, b*, yellowness–blueness.
Gel hydration properties and moisture content
HOSPF exhibited the highest WAI and WSI (3.20 g/g and 22.66%, respectively) (Table 1). The hydrolysis process enhanced the ability of starch to bind water. Enzymatic hydrolysis altered the surface characteristics of starch granules and promoted a granule disruption. The enzymes preferentially hydrolyzed the amorphous fractions rather than the crystalline domains. Since water first enters the amorphous region before penetrating crystalline domains, these structural changes may facilitate water penetration into starch granules [Almeida et al., 2019]. Consequently, partially hydrolyzed starch in HOSPF demonstrated a higher water solubility level than both NHOSPF and wheat flour.
Moisture contents of all samples remained below the maximum limit for wheat flour (14.5 g/100 g) [Codex Alimentarius Commission, 2019], although significant (p<0.05) differences were observed between flours (Table 1). The lowest value was found for NHOSPF. The hydrolysis resulted in a significant increase in moisture content. However, wheat flour exhibited the highest moisture content, which may be attributed to differences in the processing conditions of the commercial wheat flour and commercial orange sweet potato flour used in this study, as well as the additional enzymatic hydrolysis applied to produce HOSPF.
Pasting properties
The viscosity of the starch slurry generally decreases after enzymatic hydrolysis due to starch depolymerization and reduction in its molecular weight [Sigüenza-Andrés et al., 2022]. After drying, the hydrolyzed flour exhibits increased pasting viscosity. However, in our study, HOSPF exhibited a higher peak viscosity (986.0 mPa×s) compared to NHOSPF (513.3 mPa×s). This behavior can be attributed to several mechanisms. Firstly, hydrolysis products, such as oligosaccharides and branched limit dextrins, can interact with leached amylose and long outer chains of amylopectin from starch granules during gelatinization, forming a molecular association that contributes to a more developed viscous system. Secondly, due to their relatively low molecular weight and high mobility, these hydrolysis products can readily diffuse into the starch network and interact with starch molecules during pasting. Thirdly, the hydroxyl (–OH) groups present in these hydrolysis products can interact with water molecules, reducing the amount of available water and restricting starch chain mobility, thereby contributing to increased viscosity [Wang et al., 2018]. Collectively, these mechanisms explain the higher viscosity of HOSPF compared to NHOSPF, which was however lower than that of wheat flour (2,493 mPa×s). In addition, HOSPF showed a significantly (p<0.05) higher trough viscosity (966.7 mPa×s) and a lower breakdown viscosity (19.3 mPa×s) compared to NHOSPF (121.0 and 392.3 mPa×s, respectively), indicating improved resistance to thermal and mechanical disintegration. This study, in line with previous findings by Shariffa et al. [2017], showed that the hydrolysis of sweet potato starch increased peak viscosity while decreased breakdown viscosity. Notably, the breakdown viscosity of HOSPF was even lower than that of wheat flour, suggesting superior viscosity stability of HOSPF under the tested conditions.
Interestingly, the final viscosity of HOSPF (1,521 mPa×s) was intermediate between wheat flour (2,231 mPa×s) and NHOSPF (163.3 mPa×s) (Table 1), indicating a more balanced structural re-association during cooling. This suggests a lower retrogradation tendency than in wheat flour, which may contribute to reduced staling in composite bread, while still providing a firmer structure than NHOSPF. However, HOSPF exhibited a longer peak time (11.27 min) compared to NHOSPF (6.27 min), and wheat flour (9.47 min), as well as a higher pasting temperature (87.48°C) than NHOSPF (77.57°C), and wheat flour (85.02°C). These values indicate that the modified starch system requires higher thermal energy for gelatinization, likely due to strengthened molecular interactions and reduced water mobility. In contrast to physical treatments, such as high hydrostatic pressure (HHP), which induce pre-gelatinization and structural disruption leading to reduced pasting viscosity [Gu et al., 2026], enzymatic hydrolysis in the present study resulted in an increase in peak viscosity. This finding suggests that enzymatic treatment does not excessively damage starch granules but instead promotes molecular interactions that enhance viscosity development. Overall, enzymatic hydrolysis improved the pasting properties of non-wheat flour, as reflected in HOSPF, highlighting its potential as a functional ingredient and partial substitute for wheat flour in composite bread formulation.
Flour microstructure
Figure 2 shows that starch granules in wheat flour and NHOSPF appeared intact and compact, exhibiting minimal surface damage or fragmentation. The granules showed relatively smooth surfaces and fairly uniform, round-to-oval morphology. Starch granules generally exhibit round or oval shapes with smooth structural features. Such structural characteristics contribute to elastic dough properties and facilitate the formation of a strong gluten network. Starch granules occupy and fill the gluten matrix, thereby reducing gluten density and enhancing dough flexibility and gas expansion during fermentation [Gao et al., 2020]. The starch granules of NHOSPF were significantly larger than those of wheat flour (Figure 2), suggesting potentially inferior dough-forming performance in terms of elasticity, and consequently, potentially reduced dough stability and a lower loaf volume.
Figure 2
Scanning electron microscope (SEM) micrographs (×2,000) of (A) wheat flour, (B) non-hydrolyzed orange sweet potato flour (NHOSPF), and (C) hydrolyzed orange sweet potato flour (HOSPF).
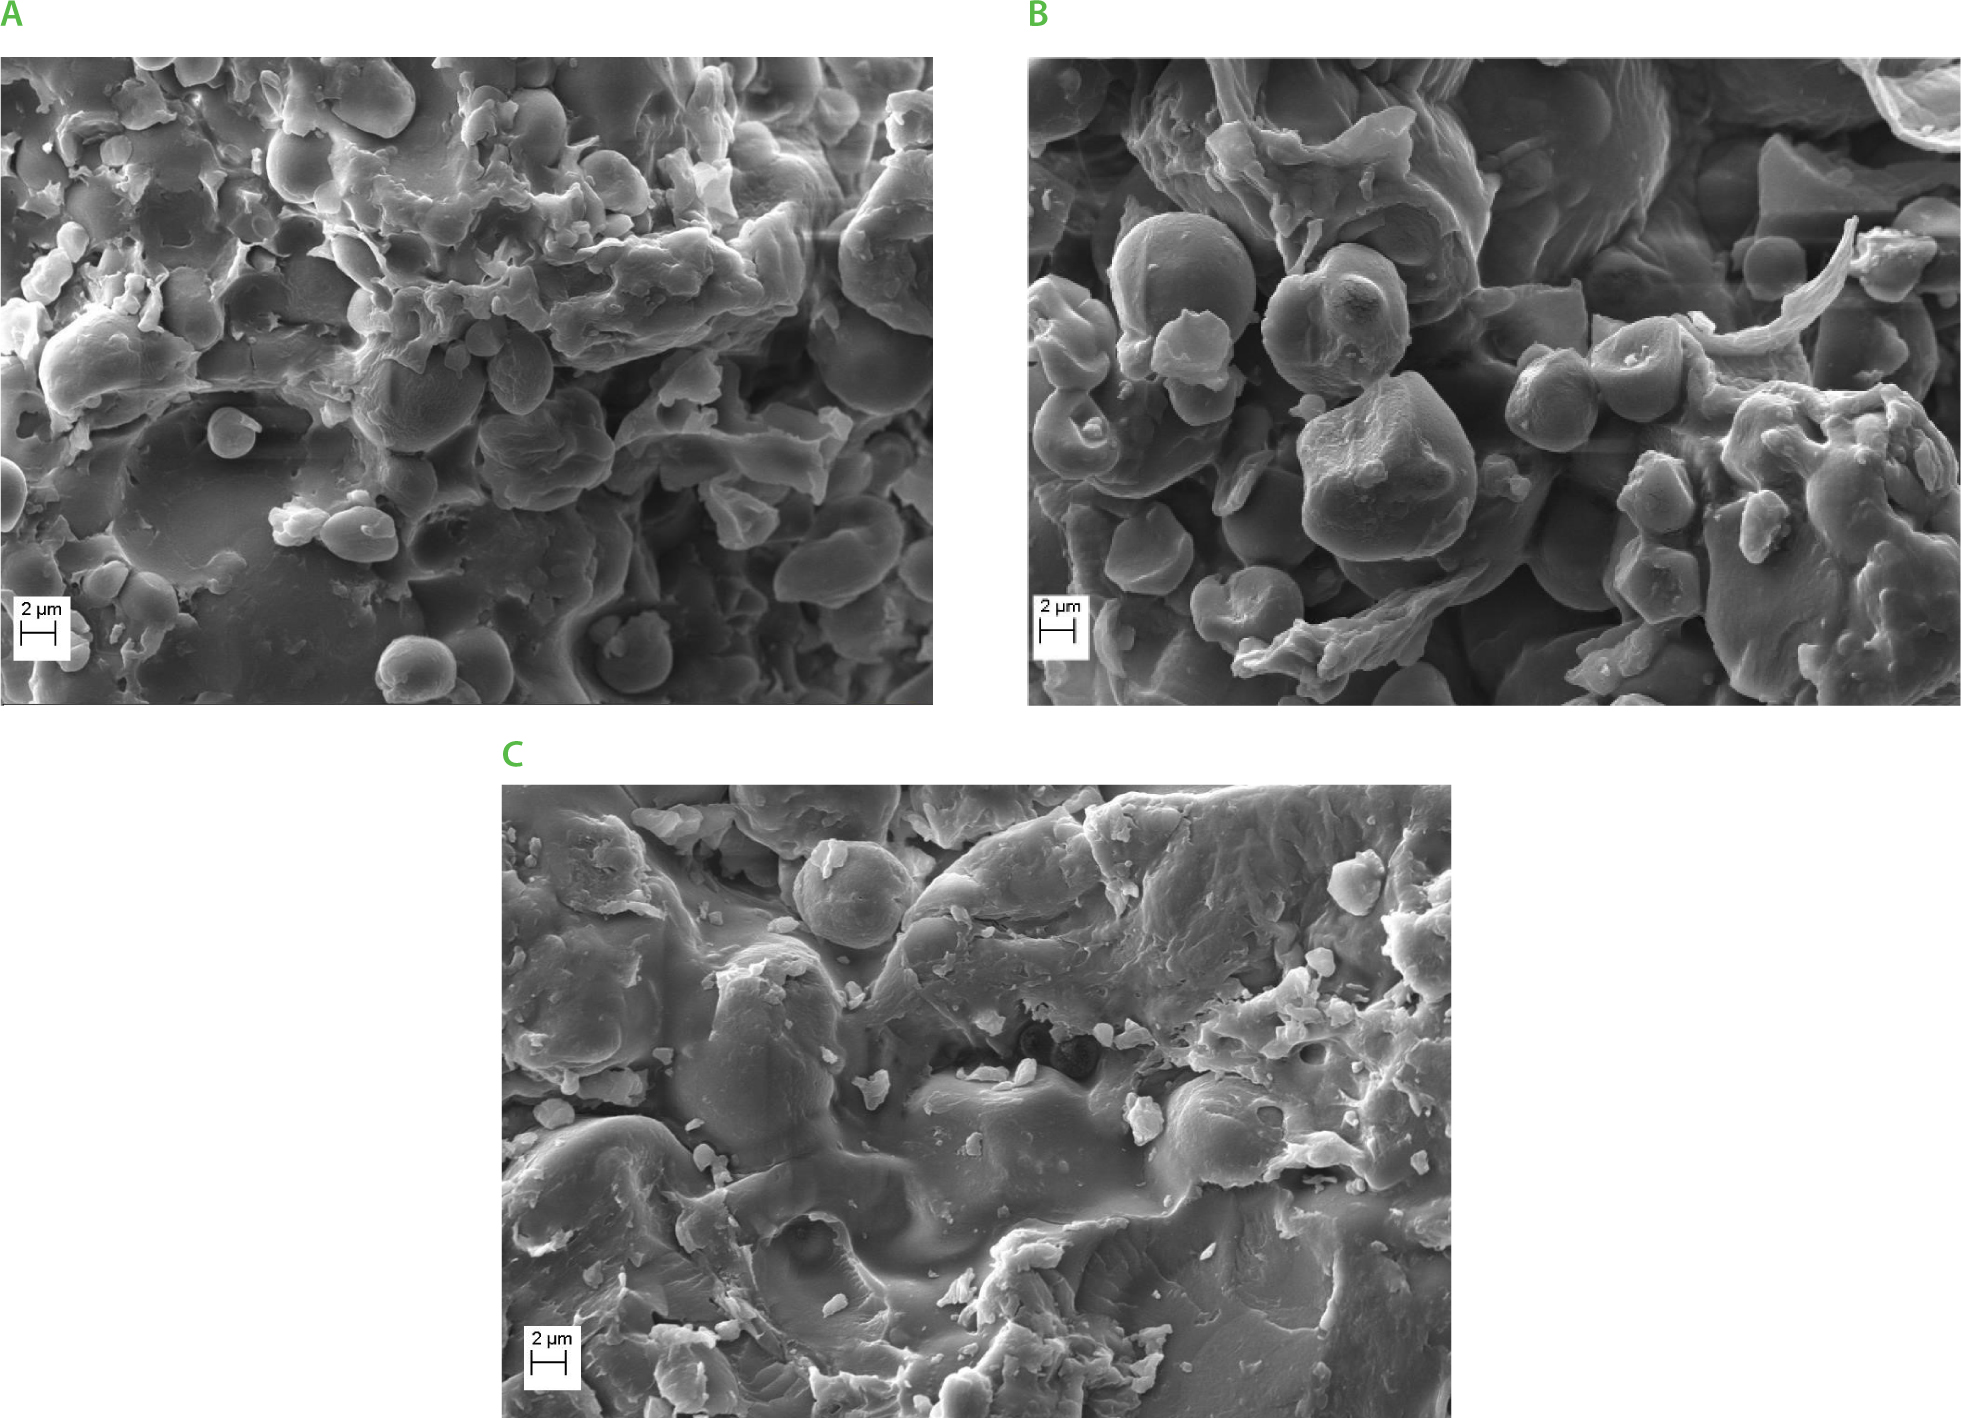
In contrast, starch granules of HOSPF were no longer clearly distinguishable (Figure 2), indicating extensive granule disruption induced by amylolytic hydrolysis. The granules exhibited irregular surfaces, porous structures, agglomeration, surface erosion, and reduction in granule size, similar to those reported in a previous study for cassava starch hydrolyzed with α-amylase and glucoamylase [Cornejo et al., 2022]. This structural degradation is due to enhanced starch solubility and water absorption capacity.
Chemical composition of flours
Reducing sugar content
The content of reducing sugars in HOSPF was significantly (p<0.05) higher compared to NHOSPF and wheat flour. This difference was expected, as the hydrolysis of starch by amylase produces reducing sugars including glucose, maltose, maltotriose, and other maltooligosaccharides [Rebholz et al., 2021].
Content of total starch, amylose, and amylopectin
During dough kneading, flour starch swells due to the penetration of water into amorphous regions of the granules, which may be followed by limited amylose leaching into the extra-granular space [van Rooyen et al., 2023]. Subsequently, starch granules undergo gelatinization during baking, allowing extensive granule swelling, which is strongly influenced by the amylopectin-toamylose ratio. Starches with a higher amylopectin-to-amylose ratio generally exhibit greater swelling power because the highly branched structure of amylopectin is primarily responsible for granule swelling, particularly with the sufficient water content during gelatinization. In contrast, a higher amylose content has been associated with reduced granule swelling and swelling power [Chiodetti et al., 2024].
In the present study, the total starch content of wheat flour (70.77 g/100 g) was higher than that of NHOSPF (65.70 g/100 g) and HOSPF (65.76 g/100 g) (Table 1). However, the amylopectin-to-amylose ratio of wheat flour (2.00) was lower than those of NHOSPF (2.72) and HOSPF (3.46), indicating that the swelling power of wheat flour starch may be lower than that of orange sweet potato flours. Previous studies have reported that wheat flour does not usually exhibit the highest swelling power compared to non-wheat flours, e.g., potato flour, which has larger granules, showed a higher swelling power than wheat flour at 70–90°C [Fan et al., 2024]. In addition to its effect on starch swelling power, the lower amylose content has been associated with the formation of softer starch gels [Teng et al., 2013]. As shown in Table 1, the amylose content of HOSPF (14.74 g/100 g) was significantly (p<0.05) lower than that of NHOSPF (17.65 g/100 g). Consequently, the lower amylose content of HOSPF could contribute to enhanced crumb softness compared with NHOSPF.
The starch, amylose, and amylopectin contents determined in this study differed from those previously reported in the literature. For example, de Souza et al. [2020] reported starch, amylose, and amylopectin contents within the ranges of 51.6–59.1, 9.7–15.1, and 84.9–90.3 g/100 g, respectively, for four Brazilian sweet potato genotypes. These differences were expected because starch composition is largely influenced by genotypes. This finding has been further supported by Wang et al. [2020], who demonstrated that different sweet potato genotypes exhibited various starch, amylose, and amylopectin contents even when grown under the same environmental conditions, indicating that genotype is a major determinant of starch composition. Similarly, the orange sweet potato used in the present study belonged to a different genotype compared to those used in previous studies, which may explain the differences in its starch composition.
β-Carotene content
A substantial variation was demonstrated in β-carotene content among wheat flour, NHOSPF, and HOSPF (Table 1). Wheat flour exhibited a negligible β-carotene content (0.02 mg/kg), confirming that conventional wheat-based products contribute minimally to provitamin A intake. In contrast, NHOSPF showed the highest β-carotene content (1,277 mg/kg), highlighting its potential as a functional ingredient rich in bioactive compounds. This value was substantially higher than those reported by Oloniyo et al. [2021] (36.3–188.3 mg/kg). The higher β-carotene content determined in the present study may be attributed to differences in sweet potato cultivars, as carotenoid content varies considerably among varieties. This explanation is supported by Islam et al. [2016], who reported significant variation in carotenoid content among orange-fleshed sweet potato cultivars. The HOSPF exhibited a significantly lower β-carotene content (872.5 mg/kg) compared to its non-hydrolyzed counterpart, indicating that the hydrolysis process may lead to partial degradation or loss of β-carotene. The reduction in β-carotene following hydrolysis can be attributed to oxidative degradation and trans–cis isomerization reactions induced by exposure to oxygen and enzymatic activity during processing [Mordi et al., 2020]. This may reduce the intensity of the yellow color in orange sweet potato flour. Nevertheless, HOSPF still retained a considerably higher β-carotene level than wheat flour, suggesting that it remains a valuable source of provitamin A.
Physical properties of breads
Bread appearance
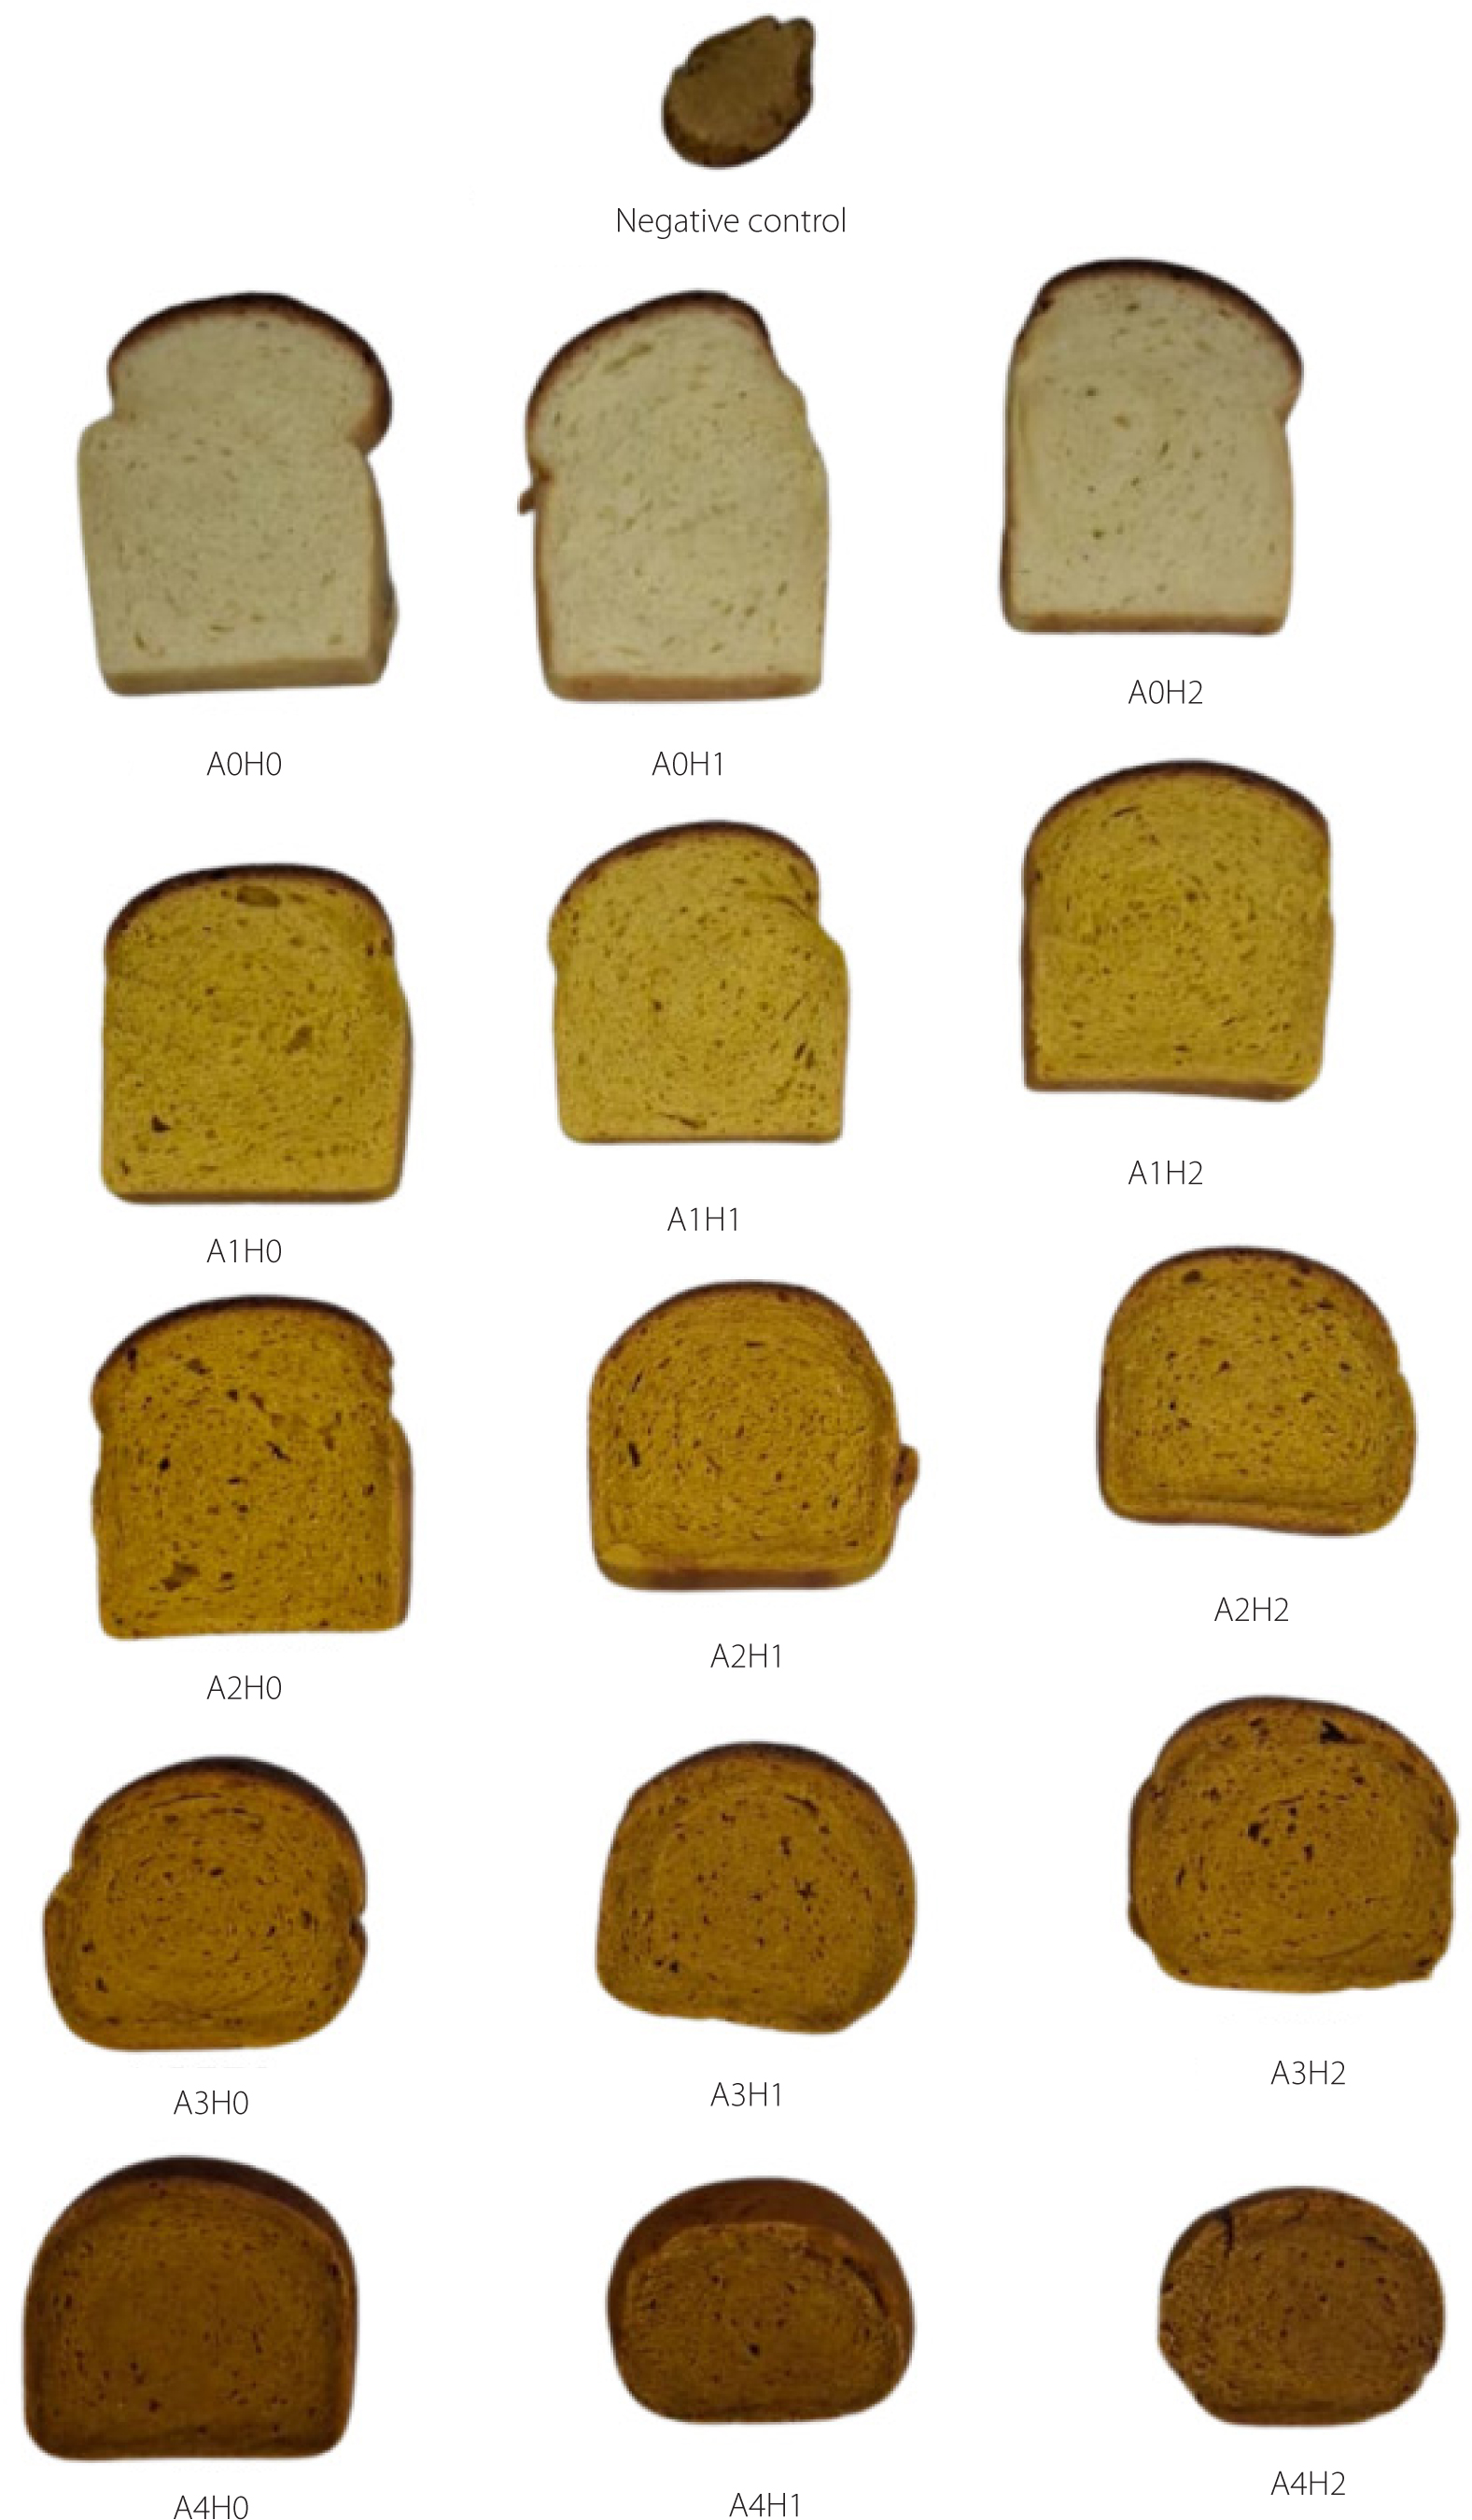
The appearance of breads produced from wheat flour (positive control) and its blends with HOSPF, without or with HPMC addition, as well as from NHOSPF (negative control) is shown in Figure 3. Breads of various formulations revealed differences in the volume, texture, and color, the extent of which was found to depend on the wheat flour substitution with HOSPF (A0– –A4) and the addition of HPMC (H0–H2). In the A0 treatment (0 g HOSPF/100 g flour blend) with different HPMC contents, the resulting breads exhibited the lightest color, like the positive control, with satisfactory volume, particularly in A0H1 and A0H2. This indicates that the addition of HPMC was able to maintain bread structure and expansion even in the absence of sweet potato flour. As the levels of wheat flour substitution with HOSPF increased (A1–A4), the bread color became progressively darker, shifting toward the characteristic orange-brown hue of sweet potato. Bread in treatment A1 (15 g/100 g flour blend) still exhibited good expansion with a golden-yellow color, whereas at higher incorporation levels, such as A3 (45 g/100 g flour blend) and A4 (60 g/100 g flour blend), the bread color turned darker brown, and loaf volume tended to decrease. This observation is consistent with the higher reducing sugar content of HOSPF (Table 1). During bread production, α-amylase hydrolyzes starch, releasing glucose, maltose, and other reducing sugars which serve as substrates for the Maillard reaction [Rebholz et al., 2021]. These reducing sugars readily react with amino groups from proteins in wheat and orange sweet potato flours via the Maillard reaction, producing brown melanoidin pigments responsible for crust darkening [Helou et al., 2016]. Accordingly, increasing HOSPF substitution intensified the Maillard reaction, resulting in a darker and more reddish appearance.
Figure 3
Cross-sectional appearance of breads produced from wheat flour and its blends with hydrolyzed orange sweet potato flour (HOSPF) with or without hydroxypropyl methylcellulose (HPMC) addition. Treatments were coded as A*H*, where A indicates HOSPF substitution level (A0=0, A1=15, A2=30, A3=45, A4=60 g/100 g flour blend) and H indicates HPMC addition level to flour blend (H0=0, H1=1.5, H2=3 g/100 g). Bread made from non-hydrolyzed orange sweet potato flour without HPMC was negative control.
Loaf volume and specific volume of breads
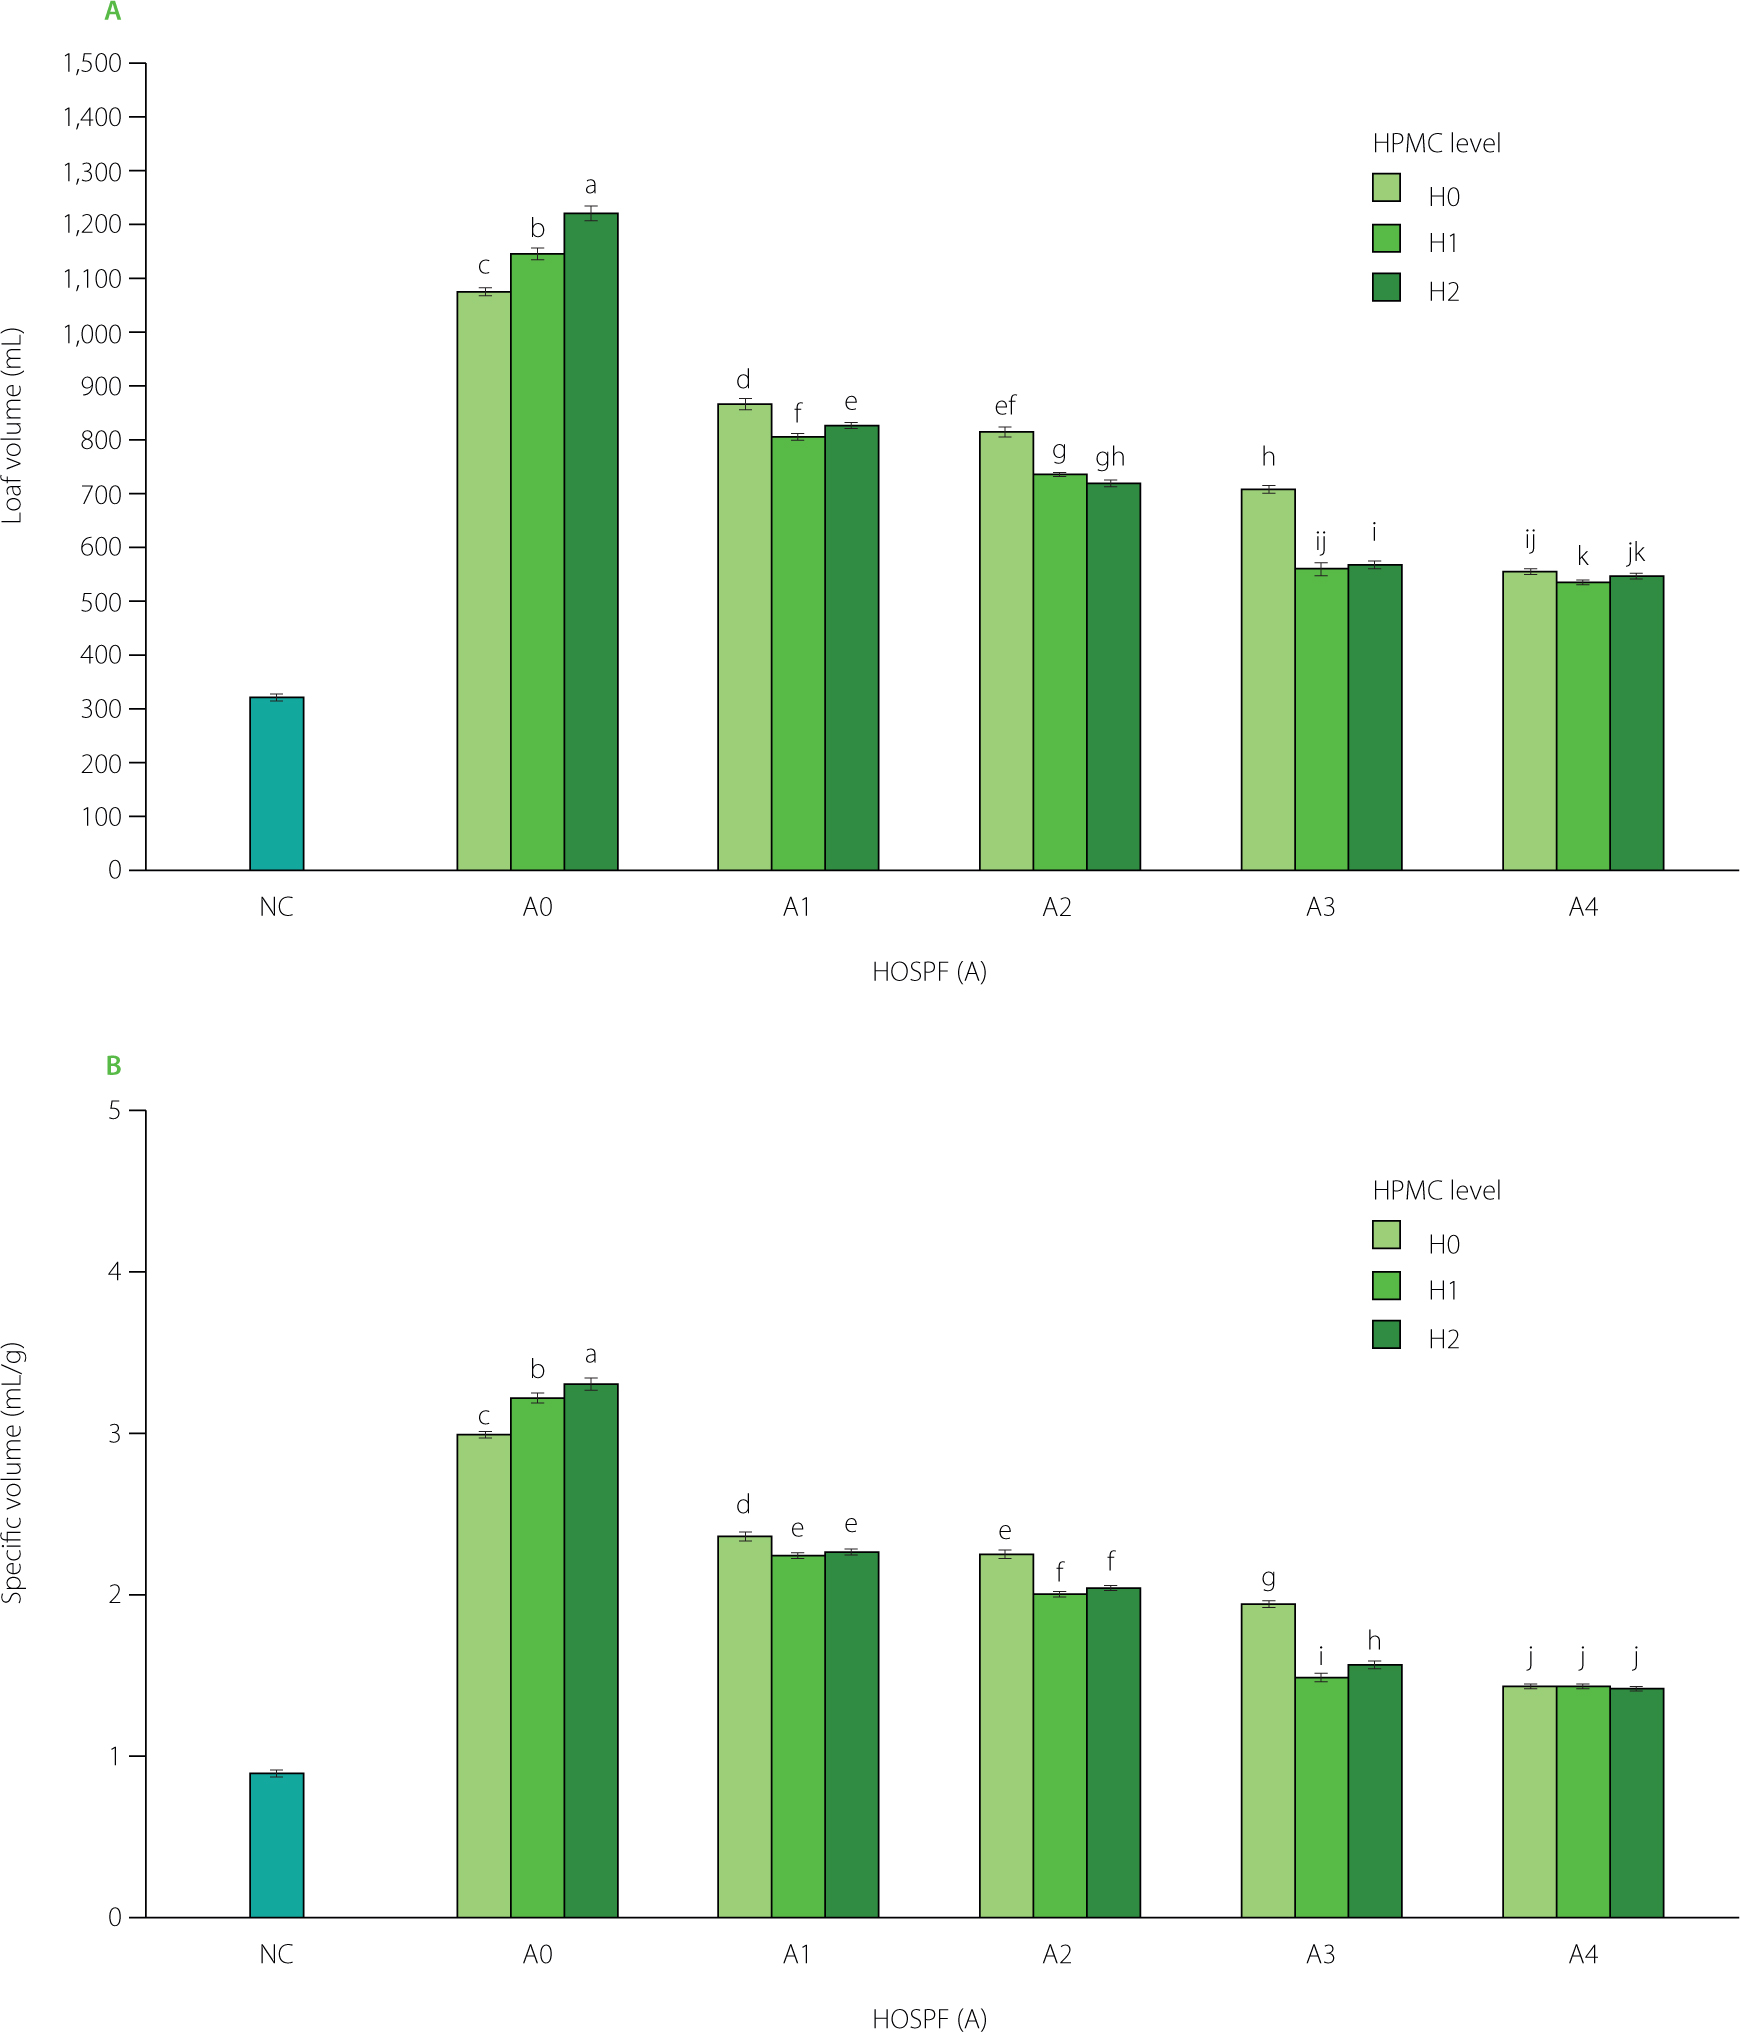
The highest loaf volume and specific volume were determined for the bread produced from A0H2 formulation (0 g HOSPF/100 g flour blend and addition of 3 g HPMC/100 g flour blend), reaching 1,218.7 mL and 3.30 mL/g, respectively (Figure 4). In contrast, negative control (NHOSPF without HPMC) showed the lowest loaf volume and specific volume, at 318.0 mL and 0.90 mL/g, respectively. These results indicate that the addition of HPMC to wheat flour had the pronounced effect on improving the expansion of breads by stabilizing gas bubbles and partially replacing gluten functionality, thereby enhancing dough structure during fermentation and baking [Torres-Pérez et al., 2024]. However, the effect of HPMC on bread expansion depended on the presence of HOSPF (Figure 4). In the breads containing HOSPF, HPMC generally reduced loaf volume and specific volume. This result was further confirmed by two-way ANOVA analysis, which showed that the interaction between main factors (HOSPF and HPMC) significantly influenced the volume and specific volume of composite breads (p<0.05) (Table S2 in Supplementary Materials). The higher volume observed in the breads containing HOSPF compared to that produced from NHOSPF can be attributed to the amylolytic hydrolysis, which generates reducing sugars that accelerate yeast fermentation and increase CO2 production, ultimately enhancing loaf expansion at certain incorporation levels [Struyf et al., 2017]. However, with increasing HOSPF incorporation levels, loaf volume tended to decrease, likely due to excessive gluten dilution and weakening of the dough matrix, which impaired gas retention capacity. This effect sustained despite the addition of HPMC, as both HPMC and HOSPF strongly compete for water, thereby limiting gluten hydration and restricting dough expansion.
Figure 4
(A) Loaf volume, and (B) specific volume of breads produced from wheat flour and its blends with hydrolyzed orange sweet potato flour (HOSPF) with or without hydroxypropyl methylcellulose (HPMC) addition. Different letters above bars indicate significant differences between breads (p<0.05). Treatments were coded as A*H*, where A indicates HOSPF substitution level (A0=0, A1=15, A2=30, A3=45, A4=60 g/100 g flour blend) and H indicates HPMC addition level to flour blend (H0=0, H1=1.5, H2=3 g/100 g). NC, negative control (bread from non-hydrolyzed orange sweet potato flour without HPMC).
Texture profile parameters of breads
TPA results showed significant differences among samples in all parameters examined (Figure 5). Bread with higher HOSPF incorporation exhibited high hardness and chewiness, particularly at a substitution level of 45 g/100 g flour blend (A3). This effect is attributed to gluten dilution, as sweet potato flour lacks gluten-forming proteins, thereby weakening the three-dimensional dough network responsible for gas retention. Reduced gas retention lowers specific volume and crumb porosity, resulting in a denser structure that requires greater force to deform [Gan et al., 1995]. Although HOSPF exhibited a lower amylose content (Table 1), characteristics generally associated with a softer crumb, these potential benefits were insufficient to counteract the adverse effect of gluten dilution at the higher substitution levels. These findings agree with observations made by Chikpah et al. [2023], who reported that higher incorporation levels of nonwheat flour (orange-fleshed sweet potato and pumpkin flour) increased hardness and chewiness in composite bread.
Figure 5
(A) Hardness, (B) cohesiveness, (C) chewiness, and (D) resilience of breads produced from wheat flour and its blends with hydrolyzed orange sweet potato flour (HOSPF) with or without hydroxypropyl methylcellulose (HPMC) addition. Different letters above bars indicate significant differences between breads (p<0.05). Treatments were coded as A*H*, where A indicates HOSPF substitution level (A0=0, A1=15, A2=30, A3=45, A4=60 g/100 g flour blend) and H indicates HPMC addition level to flour blend (H0=0, H1=1.5, H2=3 g/100 g); Negative control (NC), A4H1, and A4H2 could not be measured due to excessive hardness; ND, not detected.
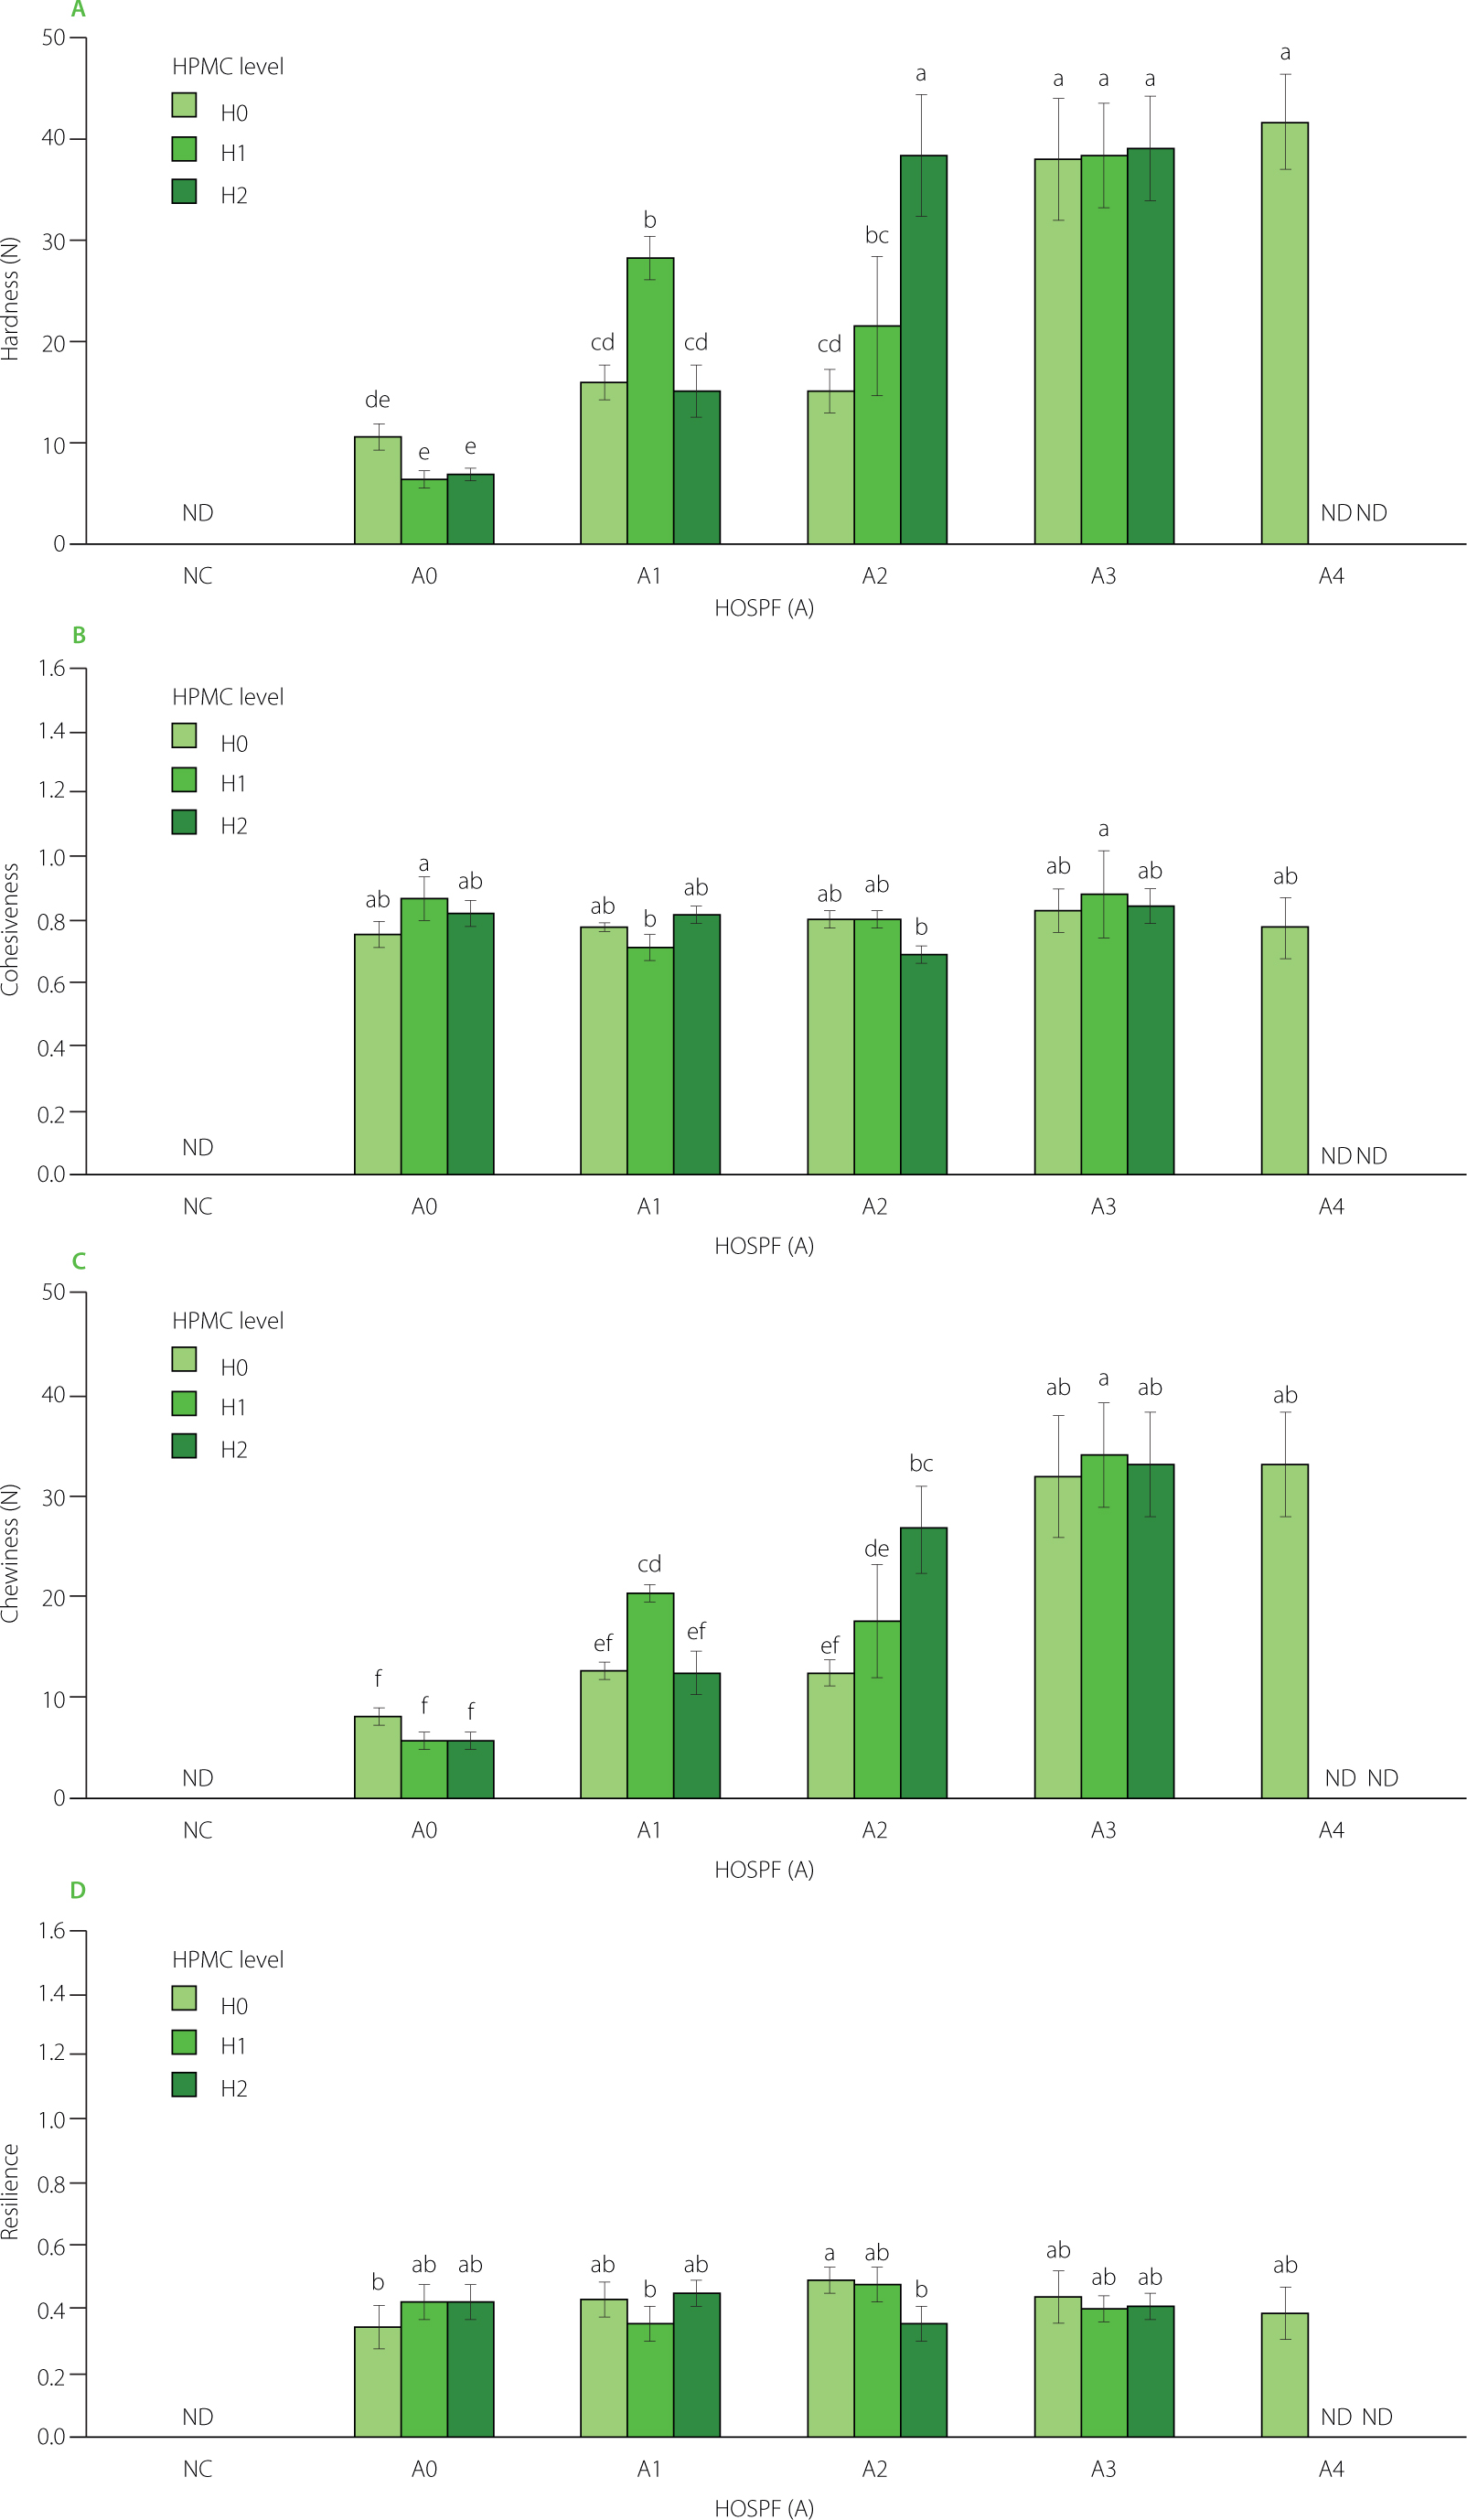
Generally, higher cohesiveness reflects a crumb structure that remains intact during mastication, whereas lower cohesiveness results in increased crumbling [Encina-Zelada et al., 2018]. In our study, cohesiveness ranged from 0.689 (A2H2) to 0.882 (A3H1), with positive control (A0H0) at 0.749 and did not exhibit a consistent trend with increasing HOSPF levels (Figure 5). In the absence of HPMC (H0), replacing wheat flour with HOSPF resulted in cohesiveness values comparable to those of the positive control. Similarly, HPMC supplementation resulted in fluctuating cohesiveness across HOSPF substitution levels, indicating that no consistent effect of HPMC on crumb cohesiveness could be established.
The two-way ANOVA revealed a significant interaction between HOSPF and HPMC for all TPA parameters (p<0.05) (Table S2). This interaction explains the inconsistent role of HPMC across treatments, as its functionality varied depending on the composite flour matrix. In wheat bread, HPMC reduced hardness by improving gas retention, and increasing specific volume as mentioned previously, resulting in a lighter crumb [Belorio & Gómez, 2020]. However, HPMC tended to increase hardness in the composite breads containing HOSPF. This shift in functionality reflects the interaction between both factors, where the presence of HOSPF alters the ability of HPMC to improve structure. This occurs due to water competition between HOSPF, HPMC, and gluten. Given the identical water levels were used in all formulations, the higher water-binding capacity of HOSPF and HPMC likely resulted in limited gluten hydration and matrix expansion, reducing gas retention, and producing a denser crumb [Culetu et al., 2021]. A comparable effect has been reported by Encina-Zelada et al. [2018], who observed that increasing xanthan gum content at a constant water level increased crumb hardness, whereas increasing the water content reduced hardness and improved specific volume. Although a different hydrocolloid was used, these findings underscore the importance of maintaining an appropriate hydrocolloid-to-water ratio for desirable bread texture.
Regarding the main effects, neither HOSPF nor HPMC showed a significant influence on resilience (p≥0.05) (Table S2), suggesting that the elastic recovery of the crumb was not substantially affected by these factors and mainly determined by the gluten network. In addition, the main effect of HPMC was not significant (p≥0.05) for cohesiveness, indicating that HPMC had a limited role in modifying the internal structural integrity of the crumb, which is more strongly influenced by starch composition and crumb density.
Negative control, A4H1, and A4H2 could not be analyzed due to excessive hardness, which prevented the instrument from detecting the texture parameters. This result implies that adding hydrocolloids along with high incorporation levels of HOSPF may result in an overly stiff and technologically unsuitable crumb structure. Excessive hydrocolloid-starch interactions have been reported to cause severe stiffness in composite and gluten-free bread systems [Culetu et al., 2021]. Overall, these results indicate that the level of HOSPF in bread formula plays a more dominant role in determining bread quality than the hydrolysis process itself, while hydrolysis mainly acts as a supporting factor by improving flour functionality.
Dough rheological properties
Dough rheology analysis was performed on selected samples based on their similarity in physical characteristic scores to A0H0 (positive control). The selection was based on a scoring approach derived from multiple physical parameters, and the complete scoring data are provided in Table S1. The top three samples were A1H0, A1H2, and A2H0, which, together with the positive control, were further analyzed for dough rheology. The rheological properties of the composite dough were significantly influenced by the proportion of HOSPF in the flour blend and the addition of HPMC (Table 2). The positive control dough (A0H0) exhibited the highest cohesiveness and resilience, reflecting a strong and elastic gluten network typical of wheatbased dough. As the level of HOSPF increased, cohesiveness and resilience progressively decreased, indicating weakening of the dough structure due to partial dilution of gluten and modification of starch-protein interactions [Culetu et al., 2021]. The formulation containing 30 g HOSPF/100 g flour blend (A2H0) showed the highest hardness values, suggesting a denser and more rigid dough matrix. This result may be attributed to the altered starch structure resulting from hydrolysis, which can increase water absorption and limit dough extensibility, thereby producing a stiffer dough.
Table 2
Rheological properties of wheat flour dough and doughs from blend of wheat flour and hydrolyzed orange sweet potato flour (HOSPF) with or without the addition of hydroxypropyl methylcellulose (HPMC).
[i] Values are expressed as mean ± standard deviation. Mean values within the same row followed by different letters are significantly different (p<0.05) according to Tukey’s multiple comparison test. Treatments were coded as A*H*, where A indicates HOSPF substitution level (A0=0, A1=15, A2=30 g/100 g flour blend) and H indicates HPMC addition level to flour blend (H0=0, H2=3 g/100 g flour blend).
The addition of HPMC at 3 g/100 g flour blend (A1H2) partially mitigated the negative effects of flour substitution on dough structure. HPMC likely contributed to these effects by forming a hydrocolloid gel that interacts with starch and proteins, improving water retention, and reinforcing the dough matrix in the absence of sufficient gluten. Overall, increasing levels of HOSPF reduced dough elasticity and cohesiveness while increasing firmness. However, the incorporation of HPMC helped improve dough functionality by enhancing structural integrity and viscoelastic behavior [Torres-Pérez et al., 2024]. These results highlight the importance of hydrocolloid addition when formulating composite doughs with HOSPF to achieve rheological properties suitable for bread making.
CONCLUSIONS
This study demonstrates that the combination entailing substitution of wheat flour with orange sweet potato flour hydrolyzed using amylase from B. spizizenii ATCC 6633 and addition of hydroxypropyl methylcellulose influenced the physical characteristics of composite bread. Amylolytic hydrolysis enhanced the orange sweet potato flour functionality, such as gel hydration properties and pasting properties. The level of substitution was found to be a dominant factor affecting bread quality. Increasing hydrolyzed orange sweet potato flour levels beyond 30 g/100 g flour blend led to a reduced loaf volume and increased crumb firmness due to excessive gluten dilution and intensified competition for water, which limited dough expansion. The most favorable balance for physical properties was achieved in formulations A1H0 (15 g HOSPF/100 g flour blend), A1H2 (15 g HOSPF/100 g flour blend + 3 g HPMC/100 g flour blend), and A2H0 (30 g HOSPF/100 g flour blend), indicating its suitability for composite bread formulation. Although amylolytic hydrolysis improved flour functionality, it could not fully compensate for structural weakening at higher substitution levels. This study highlights the potential of HOSPF as a functional ingredient for partial wheat flour substitution. However, the absence of proximate nutritional analysis and sensory evaluation in this study is acknowledged as a limitation. Future studies are, thus, recommended to include these aspects to provide a more comprehensive evaluation of product quality.