INTRODUCTION
Honey, a complex biological product with great diversity, has been used in different cultures since antiquity for its nutritional and medicinal properties. Several scientific studies confirm its valuable biological activities, including antioxidant [Becerril-Sánchez et al., 2021; Kavanagh et al., 2019], anti-inflammatory [Zaidi et al., 2019], antibacterial [Abdellah et al., 2020; Chettoum et al., 2023], and antimicrobial [Bakchiche et al., 2020; Latifa et al., 2020] effects. These properties are linked to its constituents, such as phenolic compounds, carotenoids, vitamins, sugars, enzymes, and methylglyoxal [Cianciosi et al., 2018; da Silva et al., 2016]. The content of these compounds in honey depends on its botanical and entomological sources, as well as environmental conditions [Moniruzzaman et al., 2013]. Honey’s physicochemical properties and phenolic content serve as quality markers, helping to identify its floral source and geographical origin [Kavanagh et al., 2019; Majewska et al., 2019].
The physicochemical quality and authenticity of natural honey depend on specific parameters such as its acidity, water content, electrical conductivity, hydroxymethylfurfural content, and sugar content [da Silva et al., 2016; Nabti & Tichati, 2022]. In addition, phenolic compounds, which are secondary metabolites transferred from nectar to honey, are mainly classified into two families’ phenolic acids and flavonoids and may be used as botanical and quality markers [Kavanagh et al., 2019]. Previous studies have reported that honey samples with a high phenolic content often exhibit strong antioxidant activities, suggesting a causal relationship between them [Becerril-Sánchez et al., 2021; Otmani et al., 2021]. Phenolic compounds help mitigate damage caused by free radicals by acting as metal chelators, interfering with the chain reactions of free radicals, and possibly preventing their formation [Tichati et al., 2021].
Honey is a bacteriostatic food because of its high sugar content, low pH, and the presence of compounds with antibacterial activity [Abdellah et al., 2020; Latifa et al., 2020]. Under these conditions, the contamination of honey by pathogenic microbes can occur from several sources, primarily related to the bees’ digestive tract and the natural environment, such as the hive itself, air, dust, water, pollen grains, and beekeeping practices [Valdés-Silverio et al., 2018].
Algeria is known for its important floral resources, thanks to its geographical location and diverse landscapes, climates, and soils. Melliferous plants are mainly spontaneous species. This spontaneous flora is considered an important food source for bees [Belaid et al., 2020; Hamel & Boulemtafes, 2017]. Some of these plants, such as thyme, rosemary, eucalyptus, jujube, lavender, heather, and olive, are also known for their bioactivities. These plants, used in the traditional pharmacopeia, likely enhance the health-promoting properties of honey, making it a valuable product [Khalil et al., 2012; Otmani et al., 2021] and enabling the production of various monofloral [Mesbahi et al., 2019; Nakib et al., 2024] and polyfloral honeys [Homrani et al., 2020; Makhloufi et al., 2021].
In the Edough Peninsula (Northeast Algeria), honey production has seen significant growth due to the region’s vast floristic diversity and its wealth of honey species, with approximately 107 species pollinated by bees, distributed across 36 families, with Fabaceae and Asteraceae being predominant [Hamel & Boulemtafes, 2017]. The local bee species, known as the Tellian bee (Apis mellifica intermissa), is well-suited to this region. The Edough Peninsula produces various types of honey, including polyfloral, arbutus, eucalyptus, and heather honey. Arbutus honey, also known as bitter honey, is a monofloral honey with a distinct bitter taste, originating primarily from the Mediterranean basin. It is produced from the strawberry tree (Arbutus unedo L.) flower, which blooms in late autumn and early winter when other flowers are scarce [Hamel & Boulemtafes, 2017; Jurič et al., 2022]. This honey is well-known for its nutritional and health benefits, which are linked to its rich content of phenolic compounds and its high antioxidant potential [Jurič et al., 2022; Lovaković, et al., 2018]. Heather honey, produced from plants of the Ericaceae family, is valued for its attractive sensory properties, physicochemical quality, and biological activity [Cianciosi et al., 2018; Kasiotis et al., 2022]. In the Edough Peninsula, its derived from three species of Erica plants: Erica arborea L., Erica scoparia L. subsp. scoparia, and Erica multiflora L. [Hamel & Boulemtafes, 2017].
In 2023, the Edough Peninsula was declared Algeria’s first natural park to protect the integrity of its ecosystems and conserve its unique biodiversity. The availability of strawberry trees (Arbutus unedo L.) and Erica species in this region facilitates the production of various types of honey. Therefore, this study aimed to evaluate and compare the physicochemical characteristics, microbiological quality, total phenolic and total flavonoid contents, and the antioxidant, anti-inflammatory, and antimicrobial activities of two monofloral honey: arbutus honey (bitter honey) and heather honey, from this area.
MATERIALS AND METHODS
Collection of honey samples
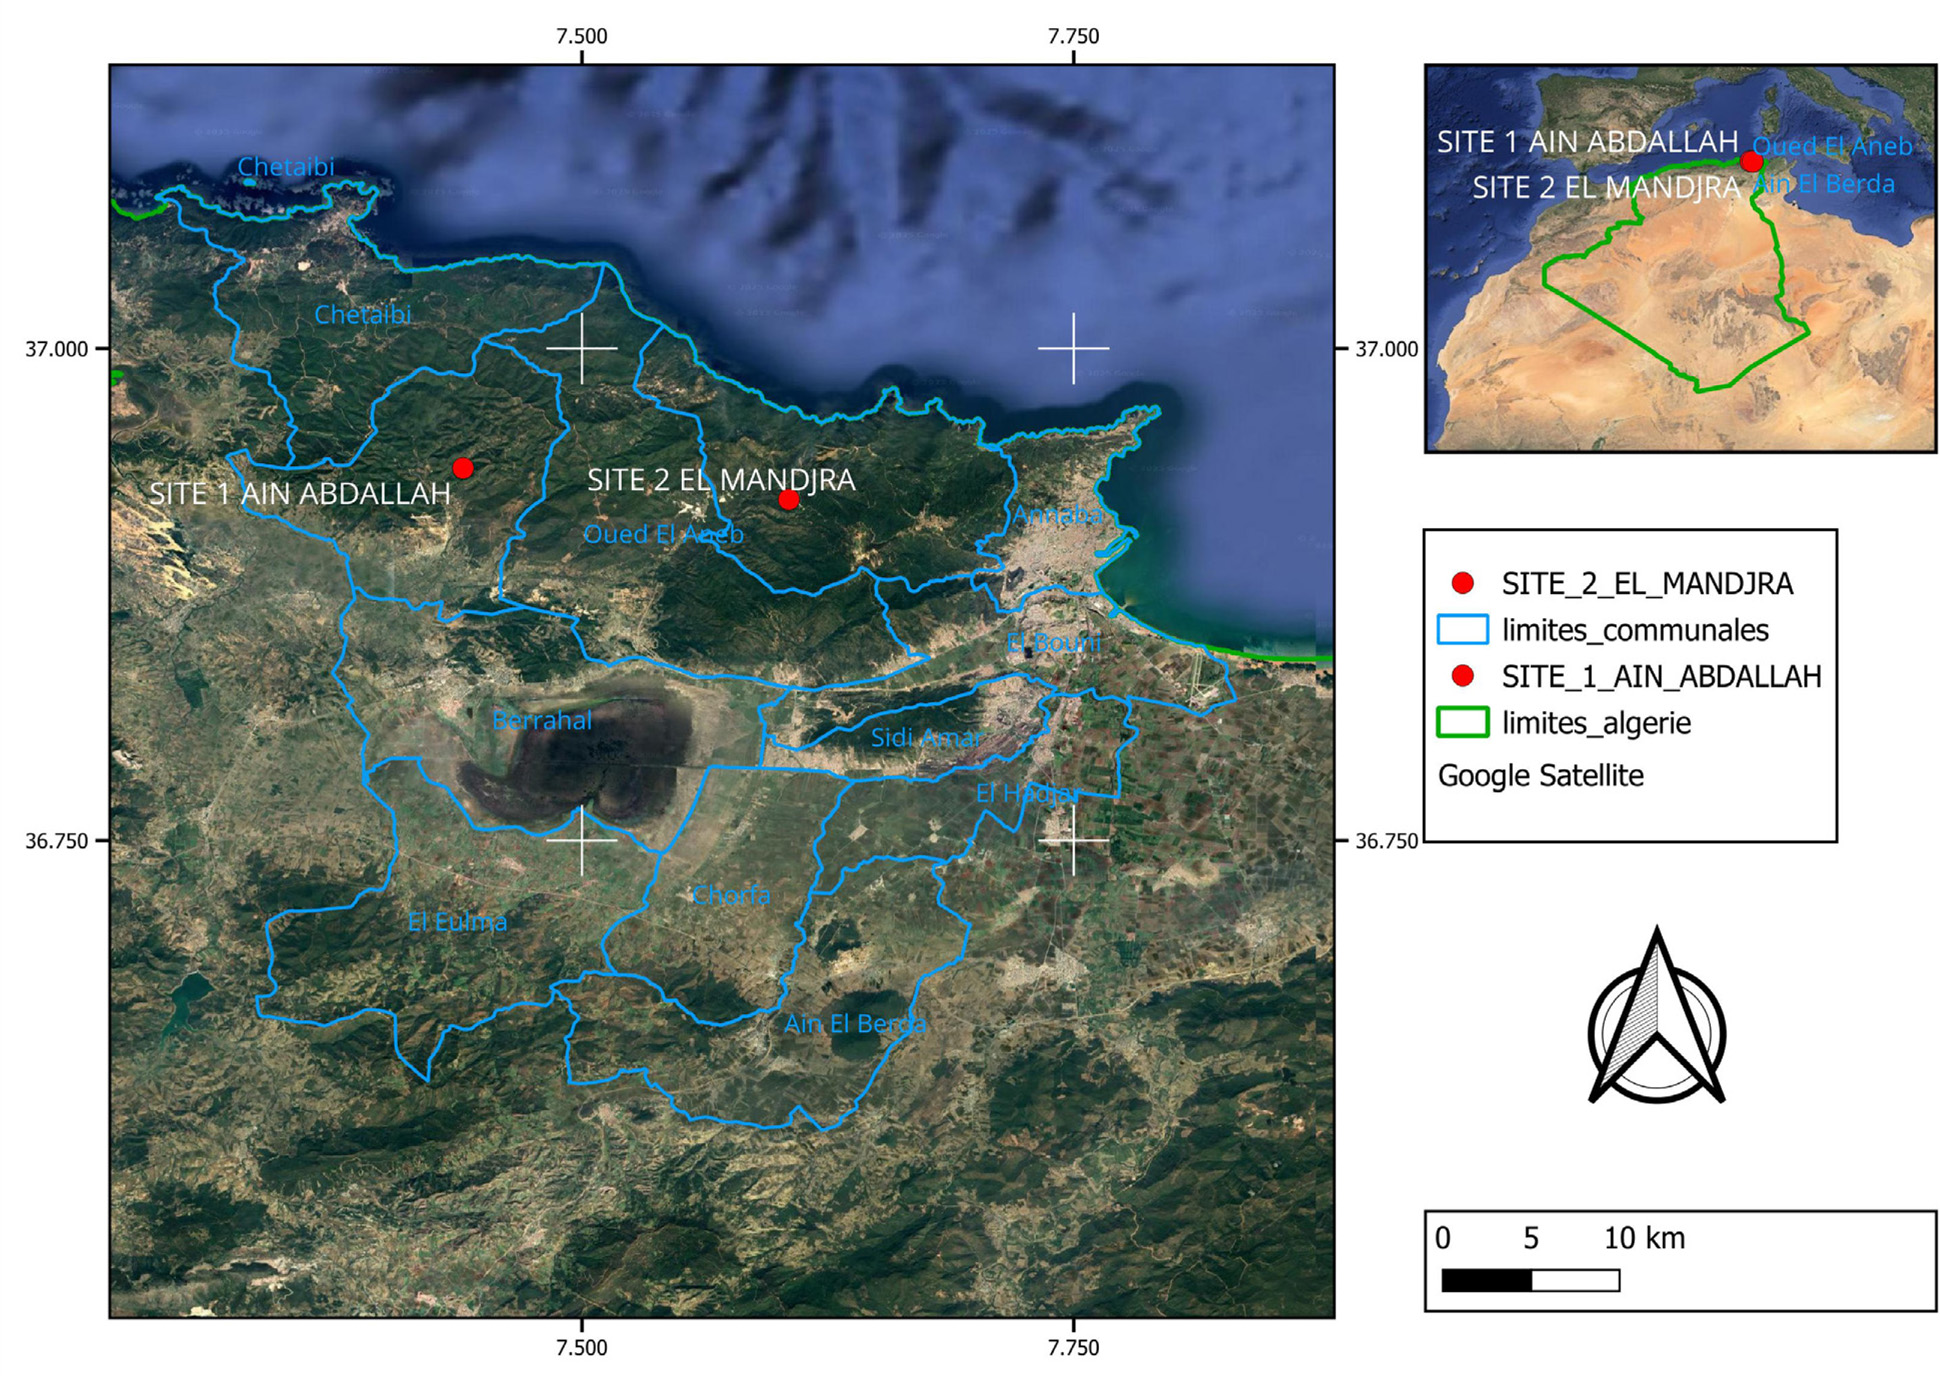
Each type of honey was taken from two experienced producers, each providing three authentic samples of one variety during the 2024 harvest (arbutus in January and heather in the spring) from two sites in the Edough Peninsula Annaba, northeast of Algeria (Figure 1), a region characterized by the presence of strawberry trees (Arbutus unedo L.) and Erica species, which support the production of these types of honey. The samples were identified as arbutus honey, locally known by the popular name “Lenj” or bitter honey, and heather honey, known as “Bouhadad” (as reported by the beekeepers). Arbutus honey was collected from Aïn Abdallah, Tréat, Annaba (latitude: 36°56’21.14” N and longitude: 7°26’22.54” E), while heather honey was sourced from El Manjra, Seraidi, Annaba (latitude: 36°55’23.74” N and longitude: 7°36’18.67” E) (Figure 1). The honey samples were placed in hermetically sealed bottles, stored at 4°C and analyzed within two months since collection.
Determination of physicochemical parameters
The water content of the honey samples was determined at 20°C using a PAL-2 ATAGO digital refractometer (ATAGO Co. Ltd., Tokyo, Japan), following the AOAC International method no. 969.38B [AOAC, 1992]. The refractive index obtained from the refractometer measurement was used to calculate the water content, which was expressed in g/100 g of honey.
The electrical conductivity (EC), pH, and density were assessed according to the harmonized methods of the European Honey Commission [Bogdanov et al., 1997]. A Sension+ EC71 conductivity meter (Hach, Berlin, Germany) was employed to measure the EC of a honey solution (20%, w/v) prepared with deionized water at 20°C. The results were expressed in mS/cm. The pH was measured using a 10% (w/v) solution of honey prepared in distilled water using a calibrated PHS-3BW Benchtop pH meter (Biobase Biodustry, Shandong, China). The density of each honey was ascertained using a pycnometer. It was calculated as the density of honey divided by the density of distilled water under the same conditions and expressed in g/mL.
A titrimetric standard method no. 962.19 was employed to estimate free, combined, and total acidities [AOAC, 1990]. First, 10 g of honey were dissolved in 75 mL of pure water, and the solution was titrated with 0.05 M NaOH to reach a pH of 8.5 (free acidity); then, a volume of 10 mL of 0.05 M NaOH was added to the solution, and the pH was adjusted to 8.30 using a 0.05 M HCl solution to assess combined acidity. Total acidity (sum of free and combined acidity) was calculated and expressed in meq of acid per kg.
Ash content determination
The ash content of the honey samples was estimated following AOAC International method no. 920.181 [AOAC, 1990]. To this end, 5 g of each honey sample and a few drops of olive oil were placed into a pre-weighed crucible and heated to evaporate the water, then placed in a muffle furnace (KEJIA 1,600°C, Zhengzhou, China) at 550°C for 4 h, during which the samples underwent calcination until reaching a constant mass. After cooling in a desiccator, the weight of the crucible with the ash was recorded. The ash content was then calculated. Results were expressed in g per 100 g of honey.
Determination of hydroxymethylfurfural content
The hydroxymethylfurfural (HMF) content of the honey samples was quantified by the spectrophotometric AOAC International method no. 980.23 [AOAC, 1990]. Honey (5 g) was mixed with 25 mL of distilled water. To this solution, 0.5 mL each of Carrez I and Carrez II solutions were added and stirred thoroughly. After filtration, the filtrate was diluted to a total volume of 50 mL with distilled water after discarding the first 10 mL of the filtrate. The remaining solution was divided into two tubes, each containing 5 mL. The first tube was supplemented with 5 mL of distilled water as the test sample. The other tube, which was designated as the reference, was supplemented with 5 mL of a 0.2% sodium bisulfate solution. Finally, the absorbance of the test sample was read at 284 nm (A284) and 336 nm (A336) against that of the reference solution using a Cary 60 UV-Vis spectrophotometer (Agilent, St. Clara, CA, USA), and the results were calculated and expressed in mg/kg using Equation (1):
where: m is mass of honey taken (5 g) and 149.7 is a constant.Determination of sugar content
The total and reducing sugar contents were estimated using the Bertrand method [Audigie et al., 1984]. To estimate the total sugar content, about 0.5 g of each honey was mixed with 20 mL of distilled water containing 2 mL of 2.2 M HCl. After being heated at 65°C for 45 min in a WB14 water bath (Memmert, Schwalbach, Germany), the solution was neutralized with a 3 M NaOH solution using phenolphthalein as an indicator. The mixture was then brought to a final volume of 100 mL with distilled water. Then, to 10 mL of the diluted sample, 10 mL each of Fehling A and Fehling B solutions were added. The mixture was heated to boiling for 3 min, forming a brick-red precipitate. The precipitate was recovered with 10 mL of a 2 M Fe2(SO4)3 solution. Finally, the resulting green color solution was titrated with a 0.004 M KMnO4 solution. Based on the volume of KMnO4 solution used, the mass of precipitate copper (mCu) was calculated. The total sugar content was estimated using the table of invert sugars, which correlates mCu with the equivalent mass of invertible sugar. Results were expressed as g/100 g of honey.
Concerning reducing sugars (RS), 10 mL of a 0.5% (w/v) honey solution in distilled water was placed into a beaker. Then, 10 mL each of Fehling A and Fehling B solutions were added. The resulting mixture was then processed using the same procedure for the total sugar analysis. Reducing sugar content was then calculated and expressed as g/100 g of honey.
Sucrose content was calculated using Equation (2):
Determination of microbiological quality
The evaluation of microbiological quality included the quantification of total aerobic mesophilic flora (TAMF), total and fecal coliforms, sulfite-reducing anaerobes, as well as the identification of Salmonella spp. and the quantification of yeasts and molds.
Total aerobic mesophilic flora
The TAMF was quantified via plate count agar (PCA) following International Organization for Standardization (ISO) 4833-1:2013 methodology [ISO, 2013]. Serial dilutions ranging from 10-1 to 10-6 were prepared employing a sterile physiological saline solution (0.85% NaCl). A 1 mL aliquot from each dilution was inoculated onto the surface of the PCA, followed by incubation at a controlled temperature of 37°C in an IN55 incubator (Memmert), for 24 h post-incubation, the visible colonies were enumerated, and the results were articulated in terms of colony-forming units (cfu) per g of honey.
Total coliforms
The quantification of total coliforms was executed on deoxycholate-lactose agar (DCL), which was organized in a dual-layer configuration, in accordance with the NF V08-050 standard methodology [AFNOR, 2009]. Following the inoculation of 1 mL from the serial dilutions (10-1 to 10-6), a second layer of molten and cooled agar (maintained at 45°C) was applied. The plates were incubated at 37°C for 24 h in an IN55 incubator (Memmert). Colonies exhibiting a dark red pigmentation, with a diameter measuring greater than or equal to 0.5 mm, were classified as total coliforms and subsequently enumerated.
Fecal coliforms
The quantification of fecal coliforms was carried out using the same methodology as that employed for total coliforms, with the exception of the incubation temperature, which was adjusted to 44°C for a period of 24 h. Colonies displaying analogous morphological characteristics were counted and recorded in terms of cfu/g honey.
Sulfite-reducing anaerobes
The analysis of sulfite-reducing anaerobes was conducted utilizing a sulfite-polymyxine-sulfadiazine (SPS) medium [Gomes et al, 2010]. Aliquots of 1 mL from the serial dilutions were inoculated into tubes containing the aforementioned medium. These tubes were subsequently placed within an anaerobic jar equipped with a reducing atmosphere generator and incubated at 46°C for 24 h in an IN55 Memmert incubator. The presence of black colonies, indicative of the reduction of sulfites to sulfides, was quantified.
Salmonella spp. detection
Salmonella spp. detection followed the ISO 6579-1:2017 method [ISO, 2017]. It commenced with a selective enrichment phase. A sample of 25 g was incubated in 225 mL of selenite-cystine broth at 37°C for 24 h. Following the enrichment phase, an inoculation was performed on Salmonella-Shigella agar (SS agar) in streak patterns, followed by incubation at 37°C for 24 h in an IN55 Memmert incubator. Suspicious colonies, characterized by either a colorless appearance or a black center, were isolated on Mueller-Hinton agar for the purpose of purification. The biochemical identification of these suspicious colonies was executed utilizing a biochemical gallery specifically designed for enterobacteria, incorporating standardized tests such as glucose fermentation and hydrogen sulfide (H2S) production.
Yeasts and molds
The yeasts and molds were cultivated on Sabouraud agar enriched with chloramphenicol and on potato dextrose agar (PDA) in accordance with the ISO 21527-2:2008 method [ISO, 2008]. A 1 mL aliquot from the serial dilutions was inoculated onto each distinct type of medium. The Petri dishes were incubated at 30°C in an IN55 Memmert incubator. The yeasts were examined after a duration of 24 to 48 h, whereas the molds were observed for a period extending up to seven days. The enumeration of colonies was performed based on the unique morphological characteristics exhibited by the colonies.
Colorimetric estimation of total phenolic content
Total phenolic content (TPC) was estimated using Folin-Ciocalteu reagent (FCR), following the method of Singleton et al. [1999]. An aliquot (0.1 mL) of the diluted honey (0.2 mg/mL) was mixed with 0.5 mL of FCR, diluted 10 times, and the mixture was shaken and left to rest for 5 min at room temperature. After 2 h of incubation in the dark, 0.4 mL of a 7.5% Na2CO3 solution was added. The absorbance was measured at 760 nm using a Cary 60 UV-Vis spectrophotometer (Agilent). Gallic acid solutions with concentrations between 20 and 100 mg/L were used to establish the calibration curve (y=0.0138x+0.0352; R2=0.993). Honey TPC was expressed as mg gallic acid equivalents per 100 g of honey (mg GAE/100 g honey).
Colorimetric estimation of total flavonoid content
The colorimetric method reported by Turkoglu et al. [2007] was used to estimate the total flavonoid content (TFC) in the honey, with slight modifications. An aliquot (1 mL) of the diluted honey (0.2 mg/mL) was added to a test tube with 4.3 mL of 80% (v/v) aqueous methanol solution, containing 0.1 mL of 10% aluminum nitrate, and 0.1 mL of 1 M potassium acetate. The resulting mixture was kept at room temperature for 40 min. The absorbance was measured at 415 nm using an Agilent Cary 60 UV-Vis spectrophotometer. Quercetin solutions with concentrations between 20 and 100 mg/L were used to establish the calibration curve (y=0.0111x+0.0122; R2=0.994). Honey TFC was expressed as mg quercetin equivalents per 100 g of honey (mg QE/100 g honey).
Antioxidant capacity analysis
DPPH assay
The antioxidant capacity of the honey samples was estimated as their ability to scavenge 2,2-diphenyl-1-picrylhydrazyl radicals (DPPH•) using the method developed by Brand-Williams et al. [1995], with thorough modifications. A volume of 0.1 mL from each honey sample at various concentrations (6.25– –100.00 mg mL) was added to 2.9 mL of a DPPH• methanolic solution (6×10⁻⁵ M). The mixtures were agitated and incubated for 1 h at 25°C in darkness. The absorbance was measured at 517 nm using an Agilent Cary 60 UV-Vis spectrophotometer. Ascorbic acid (0.01–1.00 mg/mL) was used as a reference standard. The percentage of DPPH• scavenged by the honey samples in each concentration was calculated and, additionally, the concentration of honey or ascorbic acid corresponding to half maximal DPPH• scavenging activity (IC50, mg/mL) was reported.
Reducing power assay
The method of Oyaizu [1986] was followed to evaluate the ability of the honey samples to reduce Fe3+. Butylated hydroxytoluene (BHT) was used as a reference standard. In summary, 1.5 mL of the honey sample solution at different concentrations (3.125 to 50.00 mg/mL) or BHT (0.01–1.00 mg/mL) was added to a test tube containing 2.5 mL of a phosphate buffer (0.2 M, pH 6.6) and 2.5 mL of a potassium ferricyanide solution (1%). The tubes were transferred to a water bath (50°C) for 20 min. Then, 1.25 mL of trichloroacetic acid was added, and the resulting mixture was thoroughly centrifuged (3,000×g, 10 min). Finally, 2.5 mL of the resulting upper layer was mixed with 20.5 mL of distilled water and 0.50 mL of a ferric chloride aqueous solution (0.1%), and the absorbance was measured at 700 nm using an Agilent Cary 60 UV-Vis spectrophotometer. The reducing power (RP) was expressed as the concentration of honey or a BHT solution giving an absorbance of 0.5 (A0.5, μg/mL).
Determination of anti-inflammatory activity
The anti-inflammatory activity of the honey samples was estimated as their ability to denaturate bovine serum albumin (BSA) according to the method reported by Williams et al. [2008]. In summary, 0.5 mL of different concentrations of solutions of the honey samples (31.25 to 500.00 µg/mL) or diclofenac sodium as a reference compound (31.25 to 125.00 µg/mL) was mixed with a BSA solution (0.5 mL of 0.2%, w/v) prepared in Tris-HCl buffer (pH 6.8). The resulting solution was allowed to stand at 37°C for 15 min and then heated at 72°C for 5 min. After cooling, the absorbance at 660 nm was measured using an Agilent Cary 60 UV-Vis spectrophotometer. The percentage inhibition (I) of protein denaturation by the honey samples or diclofenac in each concentration was calculated using Equation (3):
where: Abscontrol is the absorbance of the BSA solution without the honey sample or diclofenac and Abssample is the absorbance with the honey sample.The half maximal inhibitory concentration (IC50, mg/mL) was determined using curves of percentage inhibition vs. concentration of honey or diclofenac.
Determination of antimicrobial activity
The antimicrobial activity of both honey samples was determined by the agar-well diffusion technique against the strains of clinical origin and pathogenic to humans; they include four Gram-negative bacteria: Acinetobacter baumannii, Klebsiella pneumoniae, Pseudomonas aeruginosa and Escherichia coli; two Gram-positive bacteria: Enterococcus faecium and Staphylococcus aureus; and two yeasts of the Candida genus: Candida albicans and Candida tropicalis, provided by the University Hospital Center, Resuscitation Services, Annaba, Algeria. Amoxicillin (AK10), amoxicillin-clavulanic acid (AMC30) for bacterial strains, and amphotericin-B (AM-B) for fungal strains were used as positive controls. The microbial suspension was prepared from an 18–24-h pure culture adjusted between 0.08 and 0.10 at 600 nm using an Agilent Cary 60 UV-Vis spectrophotometer, corresponding to a concentration of 1×10⁸ cfu/mL following the McFarland scale [Benzaid et al., 2021].
The selective culture media used were: Mueller-Hinton agar for bacterial strains and Sabouraud agar for fungal strains in Petri dishes. The inoculation process involved flooding the Petri dishes with the culture and spreading it evenly over the surface. Plates were further incubated for 20 min at 37°C in an IN55 Memmert incubator to allow adequate uptake of the inoculum into the agar medium; wells 6 mm in diameter were aseptically prepared on the agar before being filled with 150 µL of each honey sample. After 24 h of incubation at 37°C, the antimicrobial effect was evaluated by measuring the diameter of the zone of inhibition (DZI) in mm, which was shown by a clear halo around the wells. The mean zone of inhibition was determined by repeating the test three times, with zones categorized as weak (less than 10 mm), moderate (10–13 mm), strong (10–13 mm), or major (greater than 13 mm) [Abdellah et al., 2020]. The minimum inhibitory concentration (MIC) was determined using the dilution technique for microbial organisms that showed susceptibility to honey samples with an inhibition zone of 10.0 mm and greater. The MIC represents the minimum concentration at which microorganisms do not multiply.
Statistical analysis
All tests were done in triplicate for three samples of each type of honey, and results are presented as mean and standard deviation (SD). Comparisons between means were analyzed using the Tukey test, and differences are deemed significant at a p<0.05. Statistical analyses were performed using GraphPad Prism version 9.0.0 (GraphPad, Software, San Diego, CA, USA).
RESULTS AND DISCUSSION
Composition and physicochemical properties of honey samples
Table 1 summarizes the results of analyses of the composition and physicochemical parameters studied in arbutus honey and heather honey. Honey’s water content varies depending on a variety of factors, including maturity, climate, botanical source, and the beekeeper’s manipulation during collection [Alvarez-Suarez et al., 2010]. It is one of the parameters that determine the quality and stability of honey during storage [da Silva et al., 2016]. Our study shows that heather honey had the highest water content (21.53 g/100 g), followed by arbutus honey, with 19.76 g/100 g, corresponding to a refractive index of 1.48 and 1.49, respectively (Table 1). The water content of the analyzed honey samples falls within the accepted norms: less than 20 g/100 g for arbutus honey and less than 23 g/100 g for heather honey [Codex Alimentarius, 2001]. These findings were similar to those previously found by other researchers for monofloral honey, including Algerian honey [Homrani et al., 2020], Moroccan honey [Bouhlali et al., 2019], and Tunisia honey [Boussaid et al., 2018]. Regarding heather honey, it is a unique variety known for its high water content, as reported by Waś et al. [2011] and Kavanagh et al. [2019].
Table 1
Composition and physicochemical properties of arbutus honey and heather honey.
[i] Results are expressed as mean ± standard deviation. Different letters indicate significant differences within rows (p<0.05). *Codex Alimentarius [2001]; **Water content of heather honey –not more than 23 g/100 g. EC, electrical conductivity; HMF, hydroxymethylfurfural.
The density of honey varies mainly according to the water content. Therefore, as expected, the density of arbutus honey was higher than that of heather honey – 1.41 and 1.38 g/mL, respectively (Table 1).
The pH and total acidity are important parameters for determining the quality of the honey and provide information about its geographic and botanical origins [Majewska et al., 2019]. They can be used to classify and differentiate unifloral honeys [Makhloufi et al., 2021]. The pH values of both studied honey samples, arbutus and heather, lean towards acidity, with values of 4.37 and 4.22, respectively (Table 1). These values are in line with the pH range of Algerian honey [Homrani et al., 2020; Makhloufi et al., 2021] and similar to those reported by previous studies on Algerian monofloral [Mesbahi et al., 2019; Otmani et al., 2019] and Moroccan [Bouhlali et al., 2019] honey samples, confirming the nectar honey status of the studied samples. The total acidity results (Table 1) fall within the international standard of less than 50 meq/kg. Heather honey exhibited a higher total acidity (22.37 meq/kg) than arbutus honey, which was 17.40 meq/kg.
Electrical conductivity of honey is an important physical parameter that helps identify honey’s floral source and purity [Makhloufi et al., 2021]. As shown in Table 1, the EC values of the honey samples were 0.73 and 0.78 mS/cm for arbutus and heather honey, respectively. The results meet the international standard for nectar honey, which is less than 0.8 mS/cm [Codex Alimentarius, 2001]. However, the established limiting values are ≤0.8 mS/cm for nectar honey and ≥0.8 mS/cm for honeydew honey. Similar EC values to those found in our study were also previously reported in Algerian honey samples [Khalil et al., 2012] and in some monofloral honey from Morocco [El-Haskoury et al., 2018] and Malaysia [Moniruzzaman et al., 2013].
The investigated honey samples (arbutus and heather) had ash content of 0.29 and 0.35 g/100 g, respectively (Table 1). These values are within reported ash content range in honey, which varies from 0.02 to 1.03 g per 100 g, according to da Silva et al. [2016] for nectar honey, and fall within the range of values reported for Algerian honey [Nabti & Tichati, 2022].
HMF is a critical parameter for assessing honey’s freshness and purity. It is found in trace concentrations in honey and is influenced by heat treatment and storage time [da Silva et al., 2016]. In our study, the HMF content of both honey samples met the Codex Alimentarius [2001] standards, stipulating that it should not exceed 40 mg/kg. Heather honey showed a higher HMF content (14.90 mg/kg) compared to arbutus honey, which was 11.56 mg/kg (Table 1). The HMF content determined in our study aligns with findings from previous studies on some monofloral Algerian honey samples [Mesbahi et al., 2019; Nakib et al., 2024].
The data obtained for the sugar content of both investigated honey samples showed that sugars were the predominant compounds. Arbutus honey exhibited slightly higher contents of total and reducing sugars at 78.18 and 74.05 g/100 g, compared to heather honey in which these values reached 76.56 and 70.25 g/100 g, respectively (Table 1). The results for reducing sugars align with international standards on sugar, which require ≥60 g/100 g for reducing sugars in floral honey [Codex Alimentarius, 2001]. The obtained values were closer to those reported by Achour & Khali [2014] and Mesbahi et al. [2019] for some monofloral honey samples from Algeria.
For sucrose, the results revealed that arbutus honey had a sucrose content of 3.90 g/100 g (Table 1), which falls within the acceptable range of ≤5 g/100 g for all types of honey. In contrast, heather honey’s sucrose content was 6.12 g/100 g, exceeding the above-mentioned limit set by the Codex Alimentarius [2001] standard. Indeed, the cause of this high content could be early honey harvesting, where the sucrose is not fully converted into glucose and fructose, as evidenced in our study by the water content (21.53 g/100 g), or due to overfeeding the bees with sucrose syrup [Achour & Khali, 2014; da Silva et al., 2016].
Microbiological quality
Honey is subject to various sources of microbial contamination, including plant-derived substances such as nectar and pollen, as well as endogenous microbial flora in the digestive tract of bees. In addition, it may be affected by environmental factors such as air, dust, soil, post-harvest handling, and processing practices [Valdés-Silverio et al., 2018]. The most commonly detected microbial contaminants include molds, yeasts, and bacterial spores, especially those of Bacillus spp. and Clostridium spp. In this study, the two honey samples were tested for total mesophilic aerobic flora, coliforms and fecal coliforms, Salmonella spp., sulfite-reducing anaerobes, molds and yeasts, and the results are illustrated in Table 2. Mesophilic aerobic bacteria were detected in both honey samples, with a concentration of less than 10 cfu/g. These levels comply with the current Algerian regulations [AOJ, 2017], which set a maximum permissible limit of 1,000 cfu/g. Detecting mesophilic aerobic bacteria may suggest inadequate hygiene practices during the production and storage [Fernández et al., 2017]. Furthermore, the analysis of all samples did not reveal any presence of fecal coliforms, sulfite-reducing anaerobes, or Salmonella spp. Concerning molds or yeasts, no contamination was observed in the samples analyzed in this study.
Total phenolic and flavonoid contents
Phenolics are essential compounds for honey’s appearance and functional properties due to their great structure diversity and their properties. Table 3 shows the contents of these compounds in the two monofloral honey samples. Arbutus honey had a higher total phenolic content (108.3 mg GAE/100 g) compared to heather honey (65.2 mg GAE/100 g). Regarding total flavonoid content, arbutus honey presented a slightly higher content (6.50 mg QE/100 g) than heather honey, which was 4.72 mg QE/100 g. These results are consistent with findings from other Algerian arbutus honey studies [Nakib et al., 2024; Otmani et al., 2019], especially for TPC. This phenolic richness determines antioxidant capacity and therapeutic values of honey [Jurič et al., 2022; Lovaković et al. 2018]. It can be mentioned that the TFC and TFC in heather honey were similar to those previously reported for Estonian heather honey [Kivima et al., 2021], but lower than those found by Homrani et al. [2020] in heather honey samples from the El Taref region, Algeria, and by Kavanagh et al. [2019] in Irish honey. The observed differences could be attributed to various factors, including botanical origin, honey ripeness, processing techniques, and collection site [Harbane et al., 2024; Kavanagh et al., 2019].
Antioxidant capacity
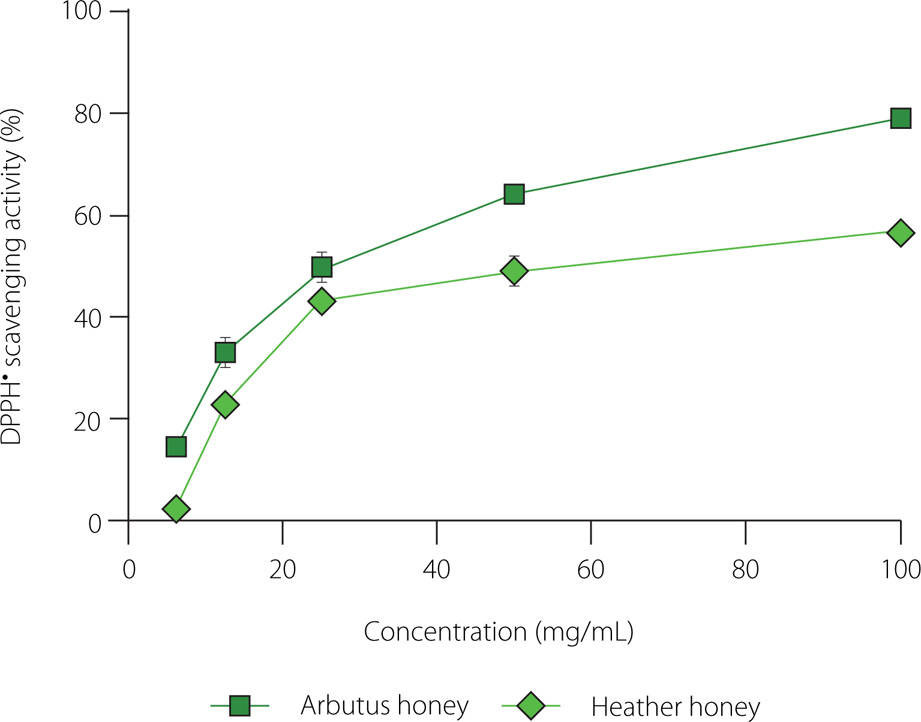
The antioxidant capacity of both honey samples was analyzed using two different in vitro methods: DPPH and RP assays. The antiradical capacity was assessed using the IC50 value, which is the concentration of the honey sample or a reference compound required to scavenge 50% of DPPH•. A lower IC50 value indicates higher antioxidant capacity. Arbutus honey exhibited lower IC50 value of 25.4 mg/mL compared to heather honey (IC50 of 60.28 mg/mL). Additionally, based on the results in Figure 2, the DPPH• scavenging activity of the honey samples (arbutus and heather) was dose-dependent, as it increased proportionally with honey concentration. It is worth noting that the reference compound, ascorbic acid, showed higher antioxidant activity than both honey samples, with an IC50 of 0.007 mg/mL. The DPPH• inhibition percentages observed in this study for both honey types were within the range reported in previous studies on Algerian honeys [Harbane et al., 2024; Zaidi et al., 2019]. The antioxidant capacity observed was mainly attributed to the phenolic content. Previous studies have indicated that honey samples with a high phenolic content tend to exhibit strong antioxidant activities, suggesting a causal relationship [Abdellah et al., 2020; Otmani et al., 2021], which may be linked to the redox properties of phenolic compounds. These compounds act as free radical scavengers through electron donation, and also chelate pro-oxidant metal ions [Becerril-Sánchez et al., 2021; Tichati et al., 2021].
In the reducing power assay, both honey samples (arbutus and heather) showed significant antioxidant capacity, with A0.5 values of 8.17 mg/mL and 13.86 mg/mL, respectively, as reported in Table 4. These findings align with previous studies on Algerian honey samples [Khalil et al., 2012; Otmani et al., 2021]. The observed reducing power can be attributed to the presence of agents, which act as antioxidants due to their electron-donating capabilities [Ruiz-Ruiz et al., 2017].
Table 4
Antioxidant capacity determined as DPPH• scavenging activity and reducing power as well as anti-inflammatory activity determined as BSA denaturation inhibition of arbutus honey and heather honey.
[i] Results are expressed as mean ± standard deviation. Means in a column with different letters are significantly different (p<0.05). A0.5, honey or standard concentration corresponding to 0.5 absorbance in reducing power assay; BHT, butylated hydroxytoluene; BSA, bovine serum albumin; DPPH•, 2,2-diphenyl-picrylhydrazyl radical, IC50, half maximal inhibitory/scavenging concentration; NT, no tested.
In vitro anti-inflammatory activity
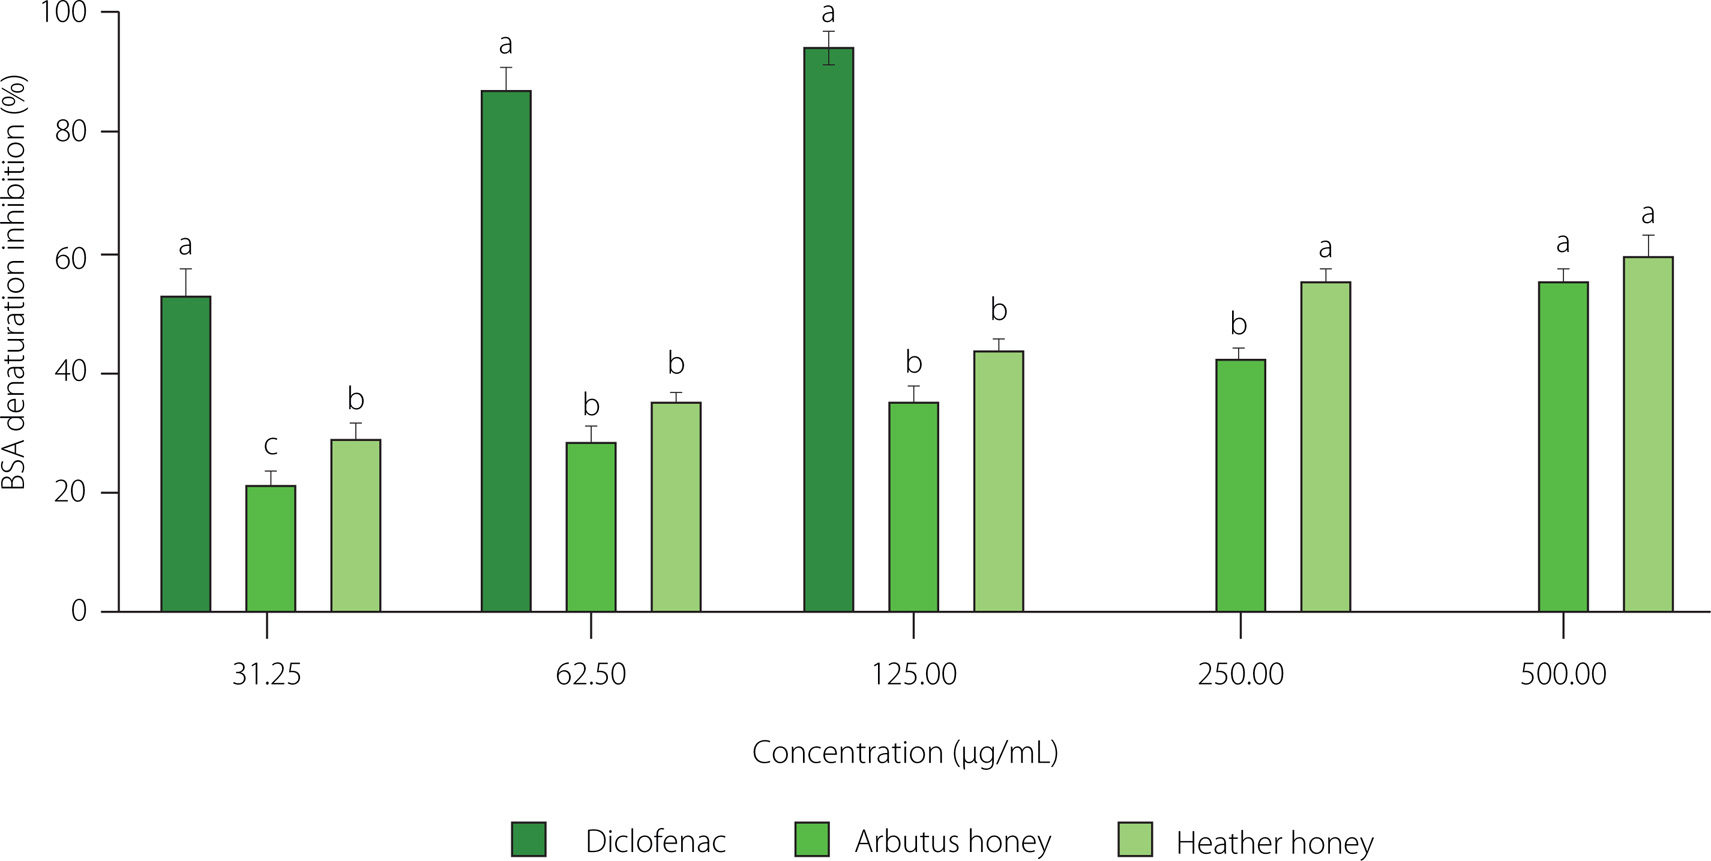
The denaturation of proteins, a significant contributor to inflammation in rheumatic diseases, results in the loss of their configuration due to the disruption of the bonds maintaining their three-dimensional conformation [Alamgeer et al., 2017]. This severe consequence includes the loss of biological activities and properties of the proteins, leading to the formation of autoantigens, which are critical in developing autoimmune disorders such as arthritis [Ruiz-Ruiz et al., 2017; Zaidi et al., 2019]. In our study, the BSA denaturation method was used to examine the in vitro anti-inflammatory activity of the honey samples. The results are demonstrated in Figure 3 and Table 4. Both honey samples exhibited concentration-dependent inhibition of protein denaturation induced by high temperature. At a concentration of 0.5 mg/mL, arbutus and heather honey inhibited BSA denaturation by 60.23% and 55.61%, respectively, with IC50 values of 0.29 and 0.38 mg/mL. These values were lower than those for the reference anti-inflammatory drug diclofenac, which inhibited BSA denaturation by 94.65% at a concentration of 0.125 mg/mL, and with an IC50 value of 0.031 mg/mL. These results demonstrate that both honey samples inhibit the thermal denaturation of BSA, confirming their anti-inflammatory effects. The bioactive compounds, including phenolic compounds, present in the honey samples may be responsible for this inhibitory activity [Ruiz-Ruiz et al., 2017; Zaidi et al., 2019].
Figure 3
In vitro anti-inflammatory activity of arbutus honey, heather honey, and standard (diclofenac). Data are expressed as mean and standard deviation. Values with different superscript letters (a, b, c) indicate significant differences (p<0.05) between tested samples at the same concentration. BSA, bovine serum albumin.
Antimicrobial potential
Antibiotic-resistant pathogens pose a significant challenge in the clinical environment, necessitating the development of new and more effective therapies. Honey offers a promising alternative due to its proven antimicrobial properties [Bakchiche et al., 2020]. In our study, eight clinical isolates, including Gram-positive and Gram-negative bacteria, as well as two fungi with high antibiotic resistance rates, were tested. The inhibition zone diameter and MIC for both honey samples are shown in Table 5. The results revealed a wide range of inhibitory effects on A. baumannii, K. pneumoniae, P. aeruginosa, E. coli, and E. faecium, with inhibition zones ranging from 12 to 36 mm for arbutus honey and from 10 to 38 mm for heather honey. The antibacterial activity of both honeys was similar, with moderate MICs ranging from 62.5 to 500 µg/mL, proving more effective than the antibiotics AK10 and AMC30 used as controls. Strains of A. baumannii, K. pneumoniae, E. coli, and E. faecium, which had shown antibiotic resistance, were sensitive to both honeys. Additionally, we observed that both honey samples had notable contents of total phenolics and total flavonoids, along with a low pH, low water content, and high reducing sugar content, which may contribute to their antibacterial activities [Chettoum et al., 2023; Otmani et al., 2021]. These findings are consistent with other results reported for Algerian honey [Bakchiche et al., 2020; Chettoum et al., 2023]. However, the S. aureus strain exhibited resistance to both honey samples, which contrasts with the findings of Bouacha et al. [2018] and Chettoum et al. [2023] who reported the antimicrobial activity of honey against this bacterium, emphasizing that Gram-positive bacteria are typically more sensitive. This resistance could be attributed to the strain’s inherent resistance, as it was also resistant to the tested antibiotics, or it could be related to the honey type and concentration used [Almasaudi, 2021].
Table 5
Antimicrobial activity of arbutus honey and heather honey.
Regarding antifungal activity, the results indicated that both honey samples lacked activity against C. albicans and C. tropicalis. These findings align with those of Latifa et al. [2020], who demonstrated that C. albicans was resistant to honey samples at all concentrations. This resistance is not directly linked to the floral origin of the honey but may be due to yeasts and fungal strains’ higher tolerance to concentrated media, which act primarily as bacteriostatic agents [Latifa et al., 2020]. In contrast, other studies on Algerian honeys have reported sensitivity in different Candida strains [Ahmed et al., 2020; Bakchiche et al., 2020].
CONCLUSIONS
This study demonstrates that the physicochemical qualities of arbutus and heather honey meet international quality standards with unique microbiological quality. Arbutus exhibited higher phenolic content, superior antioxidant activity, and anti-inflammatory potential than heather honey. Both honeys displayed moderate antibacterial effects against multi-resistant pathogens, with notable efficacy against E. faecium. However, no antifungal activity was detected. Further research is needed to characterize other honey samples from the Edough Peninsula, Algeria.