INTRODUCTION
Maca (Lepidium meyenii Walp.) is a cruciferous plant indigenous to the Andes, which is noted for its remarkable resilience, flourishing in adverse conditions, such as cold temperatures, strong winds, and drought. It produces diverse compounds to withstand these harsh environments, which also confer significant health benefits to humans [Wang & Zhu, 2019]. Morphologically, maca is a small herbaceous plant with a basal rosette growth form consisting of leaves ranging from oval to spatulate and an underground, swollen hypocotyl-root complex that functions as a storage organ [Gonzales et al., 2014]. Maca contains diverse secondary metabolites, including macaenes, macamides, glucosinolates, isothiocyanates, alkaloids, polyphenols, saponins, and sterols, which have been associated with metabolic regulation, gastrointestinal health, cardioprotection, antihypertensive effects, photoprotection, muscle growth, hepatoprotection, angiogenesis promotion, antithrombotic effects, and antiallergic activity [del Carpio et al., 2024]. Notably, maca leaves have been reported to contain higher levels of total phenolics and total flavonoids than the roots, along with various polyphenols, such as kuwanon G, laricitin, and ligustroflavone [Lee & Chang, 2019]. In addition, saponins in maca are both more abundant and diverse in the leaves than in the roots. Despite being rich in phytochemicals, maca leaves are often discarded as agricultural by-products, accounting for approximately 20%–40% of the total biomass and leading to resource wastage and environmental concerns [Caicai et al., 2018]. Thus, more studies are essential to explore the potential of maca leaves as a functional resource.
To efficiently source bioactive compounds from plant materials, extraction and separation processes are crucial for minimizing the loss, deformation, and degradation of the target substances. Among these, ultrasonic-assisted extraction (UAE) is a cost-effective and simple technique that offers high yields, reduces the loss of heat-sensitive components, and can be applied to various solvents [Kadam et al., 2013]. Recently, the application of deep eutectic solvents (DES) in UAE has gained increasing interest. DES is a eutectic mixture formed by strong interactions between a hydrogen-bond donor and a hydrogen-bond acceptor, serving as an efficient alternative solvent owing to its low cost, low toxicity, and biodegradability [Chandran et al., 2019]. After extraction, additional fractionation is often required to concentrate target bioactive compounds from complex mixtures, and macroporous resin chromatography is widely used. Macroporous resins exhibit high adsorption capacity, a stable structure, and recyclability [Lu et al., 2025], and chromatography applied to this type of resins is effective in separating and concentrating phenolic compounds and saponins through stepwise elution with aqueous ethanol solutions [Yang et al., 2016; Zhang et al., 2022].
It is documented in the literature that extracts of L. meyenii and related Brassicaceae plants exhibit antioxidant, antiinflammatory, and antidiabetic activities, which have been largely attributed to their phenolic compounds and saponins [del Carpio et al., 2024; Gonzales et al., 2014; Wang & Zhu, 2019]. In our previous study, DES-based UAE of maca leaves resulted in a higher content of bioactive compounds and stronger antioxidant activity compared with conventional hot-water extraction [Lee & Yoon, 2025]. Accordingly, as a follow-up study aimed at enhancing the utilization of maca leaves as functional ingredients, the present study applied DES-based UAE to obtain maca leaf extracts, followed by fractionation using macroporous resin chromatography. The fractions were evaluated for total saponin content (TSC), total phenolic content (TPC), and biological activities, including antioxidant, α-glucosidase inhibitory, and nitric oxide (NO) inhibitory activities, to assess their potential application as functional food materials.
MATERIALS AND METHODS
Materials and reagents
Maca (L. meyenii) used in this study was cultivated in Cheongdo-gun, Gyeongsangbuk-do, Republic of Korea (35.6473° N, 128.7341° E; approximately 200 m above sea level). The plants were sown in early spring (March–April), and the leaves were harvested in July and purchased from the Youth Research Institute located in the same region. The plant material was identified as L. meyenii based on morphological characteristics according to standard taxonomic descriptions provided by the supplier. For sample preparation, the roots were removed, and the leaves were thoroughly washed and lyophilized. The dried leaves were then pulverized using a food mixer (FM-681C, Hanil, Incheon, Korea), passed through a 45-mesh sieve, and stored at −40°C in a deep freezer until further analysis.
Diaion HP20 resin, 1,1-diphenyl-2-picrylhydrazyl (DPPH) radicals, 2,2’-azino-bis(3-ethylbenzothiazoline-6-sulfonic acid) (ABTS), phosphoric acid, p-nitrophenyl-α-d-glucopyranoside (p-NPG), Griess reagent, lipopolysaccharide (LPS), and acarbose were purchased from Sigma-Aldrich Chemical Co. (St. Louis, MO, USA). A Folin–Ciocâlteu phenol reagent and oleanolic acid were purchased from Tokyo Chemical Industry Co., Ltd. (Kita-ku, Tokyo, Japan), and 100% acetonitrile was purchased from Burdick & Jackson (Honeywell International Inc., Charlotte, NC, USA). Dulbecco’s modified Eagle’s medium (DMEM) was acquired from HyClone (Pittsburg, PA, USA), and fetal bovine serum (FBS) and penicillin/streptomycin were bought from Welgene Inc. (Gyeongsan, Korea). RAW 264.7 cells were purchased from the Korean Cell Line Bank (Seoul, Korea). Choline chloride and glycerin were purchased from Daejung Chemical & Metals (Siheung, Korea), and all other chemicals used were of analytical grade.
Preparation of deep eutectic solvent
The DES used for the extraction of phytochemicals from maca leaves was formulated following the procedure described by Lee & Yoon [2025]. Briefly, choline chloride and glycerol were mixed at a molar ratio of 1:2 and heated in a shaking water bath (BS-11, JeioTech, Seoul, Korea) at 80°C with agitation at 120 rpm until a clear, homogeneous solution was obtained. After cooling, the prepared DES was stored at ambient temperature overnight to confirm its stability prior to use.
Preparation of maca leaf extract by deep eutectic solvent-based ultrasound-assisted extraction
The extract was obtained from maca leaves using a DES–based UAE method adapted from Lee & Yoon [2025]. In brief, maca leaf powder (5 g) was mixed with 200 mL of DES containing 30% (v/v) water. UAE was performed using a probe-equipped ultrasonicator (KFS-600N, Korea Process Technology, Seoul, Korea) at an output power of 300 W for 30 min, while the extraction temperature was controlled to remain below 40°C. The extract was then centrifuged at 9,896×g for 20 min at 4°C, after which the supernatant was collected, filtered, and subsequently used for macroporous resin chromatography.
Fractionation of maca leaf extract via macroporous resin chromatography
The bioactive compound-rich extract was subjected to fractionation using a Diaion HP20 resin column. Initially, 9.5 mL of distilled water were introduced into a glass column (20×200 mm) fitted with a filter, then 25 mL of Diaion HP20 resin were added, and the mixture was allowed to settle until firm. Subsequently, 5 mL of the filtered extract were loaded onto the top of the resin column. To remove residual DES and non-target compounds from the extract, 80 mL of distilled water were first used as an eluent. The extract was then sequentially subjected to stepwise elution with 50 mL of 25%, 50%, 75%, and 100% (v/v) ethanol. Each ethanol-eluted fraction was concentrated using a rotary evaporator (N-1300, Eyela, Tokyo, Japan) and then lyophilized. The fractions eluted with 25%, 50%, 75%, and 100% ethanol were designated as Fr. 1, Fr. 2, Fr. 3, and Fr. 4, respectively.
Yield and distribution ratio of fractions
The yield (%) of each fraction was calculated as the percentage of its dry weight relative to the dry weight of the maca leaf extract obtained by DES-based UAE. The distribution ratio (%) of each fraction was calculated as the proportion of dry weight of each fraction to the total dry weight of all fractions obtained after fractionation.
Determination of total saponin content
The TSC of each fraction was quantified using the vanillin–sulfuric acid colorimetric assay based on the method of Le et al. [2018]. Briefly, 0.25 mL of each fraction dissolved in ethanol at a concentration of 1.0 mg/mL was mixed with 0.25 mL of an 8% (w/v) vanillin solution in ethanol and 2.5 mL of 72% sulfuric acid. The reaction mixture was incubated at 60°C for 10 min in a water bath and subsequently cooled in an ice-water bath for 5 min. Absorbance was determined at 544 nm using a microplate reader (Epoch, BioTek Instrument Inc., Winooski, VT, USA). TSC was calculated from a calibration curve constructed with oleanolic acid and expressed as mg oleanolic acid equivalents (OAE)/g dry weight (DW) of the dried fraction powder.
Determination of total phenolic content
The TPC was measured using the Folin–Ciocâlteu colorimetric assay following the method described by Singleton et al. [1999]. Briefly, 0.2 mL of the Folin-Ciocâlteu reagent was added to 0.2 mL of a solution of fraction in distilled water at a concentration of 1.0 mg/mL. After thorough mixing, the reaction mixture was allowed to stand at room temperature for 3 min, followed by the addition of 0.4 mL of 10% sodium carbonate (Na2CO3) and 4 mL of distilled water. The samples were then incubated in the dark at room temperature for 1 h. Absorbance was recorded at 720 nm using a microplate reader (Epoch, BioTek Instrument Inc.). TPC was calculated from a calibration curve prepared with gallic acid and expressed as mg gallic acid equivalents (GAE)/g DW of the dried fraction powder.
Determination of individual phenolic compound content
Phenolic compounds were analyzed by high-performance liquid chromatography (HPLC) following the procedure of Nour et al. [2013] with appropriate adjustments. Analyses were performed using an HPLC system (Waters 2695, Waters Co., Milford, MA, USA) equipped with a UV detector (Waters 2489, Waters Co.). Prior to analysis, each fraction was filtered through a 0.45-µm membrane filter (Millipore, Billerica, MA, USA). Separation was achieved on an Atlantis dC18 column (4.6×150 mm, 5 µm; Waters Co.) maintained at 34°C. The mobile phase consisted of 1% phosphoric acid in water (solvent A) and acetonitrile (solvent B). Elution was carried out using a gradient program as follows: 0 min, 90% A (v/v); 0–27 min, 60% A (v/v); 28–55 min, 56% A (v/v); and 56–60 min, 90% A (v/v). The flow rate was set at 1.0 mL/min, and the injection volume was 10 µL. Detection was conducted at 280 nm over a total run time of 60 min. External standard stock solutions of gallic acid, caffeic acid, catechin, cinnamic acid, epicatechin, ferulic acid, naringin, p-coumaric acid, and protocatechuic acid (Sigma-Aldrich Co., St. Louis, MO, USA) were prepared in HPLC-grade methanol. Working standard solutions at defined concentrations were obtained by serial dilution of the stock solutions and used to construct calibration curves based on the peak areas of the corresponding standards. Individual phenolic compounds were quantified and expressed as mg/g DW of the dried fraction powder.
Determination of DPPH radical scavenging activity
The DPPH• scavenging activity of the fractions was evaluated using the method of Brand-Williams et al. [1995]. Briefly, 100 µL of each fraction solution at various concentrations (0.3, 0.6, 0.9, 1.2, and 1.5 mg/mL) prepared in distilled water were mixed with 200 µL of a 0.2 mM DPPH• solution dissolved in ethanol in a microplate. The reaction mixture was incubated at 37°C for 30 min, after which absorbance was measured at 517 nm using a microplate reader (Epoch, BioTek Instruments Inc.). The radical scavenging activity (RSA) against DPPH• was calculated according to Equation (1), and the results were expressed as the IC50 value, defined as the concentration of fraction solution required to scavenge 50% of DPPH radicals:
where: A is the absorbance of the sample–radical mixture, B is the absorbance of the blank sample (radical replaced with distilled water), and C is the absorbance of the radical control (sample replaced with distilled water).
Determination of ABTS radical cation scavenging activity
The ABTS•+ scavenging activity of the fractions was evaluated according to method described by Re et al. [1999]. The ABTS•+ was generated by reacting a 7 mM ABTS solution with 2.45 mM potassium persulfate in distilled water and allowing the mixture to stand in the dark for 12 h. Prior to analysis, the ABTS•+ solution was diluted with 80% ethanol to obtain an absorbance of 0.700±0.002 at 734 nm. For the assay, 15 µL of each fraction solution in distilled water were mixed with 300 µL of the diluted ABTS•+ solution in a microplate and incubated for 6 min at room temperature. Fr. 1–3 were tested at 0.3–1.5 mg/mL, whereas Fr. 4 was tested at 0.5–3.0 mg/mL. Absorbance was measured at 734 nm using a microplate reader. ABTS•+ scavenging activity was calculated according to Equation (1) and expressed as the IC50 value, defined as the concentration of the fraction required to scavenge 50% of ABTS•+.
Determination of α-glucosidase inhibitory activity
The α-glucosidase inhibitory activity was measured using the method of Lee et al. [2021] with slight modifications. Acarbose, used as a positive control, and each fraction were dissolved in distilled water. Acarbose and Fr. 3 were tested at concentrations of 0.2–1.0 mg/mL, whereas the remaining fractions were prepared at concentrations of 0.5–3.0 mg/mL. Next, 50 µL of a 0.1 U/mL α-glucosidase solution and 50 µL of 200 mM potassium phosphate buffer (pH 6.8) were mixed with a fraction solution (50 µL), and the mixture was incubated at 37°C for 15 min. Subsequently, 100 µL of 3 mM p-NPG were added, and the reaction was performed at 37°C for 10 min. The reaction was terminated by the addition of 50 µL of 0.1 M NaOH, and the absorbance was measured at 405 nm. α-Glucosidase inhibitory (AGI) activity was calculated using Equation (2) and expressed as IC50 value, which is the concentration of a fraction solution required to inhibit activity by 50%:
where: Acontrol is the absorbance of the control (without sample), and Asample is the absorbance of the reaction mixture with the test sample.
Determination of nitric oxide inhibitory activity using RAW264.7 cells
The inhibitory effect of maca leaf extract fractions on nitric oxide (NO) production were evaluated in LPS-induced RAW 264.7 cells using a Griess reagent-based colorimetric assay [Giustarini et al., 2008]. The cells were cultured in DMEM supplemented with 10% FBS and 1% penicillin/streptomycin at 37°C in a 5% CO2 incubator (MCO-17AIC, Sanyo, Osaka, Japan). They were seeded in 96-well plates at a density of 1×10⁵ viable cells per well and cultured for 24 h in an incubator at 37°C and 5% CO2. Subsequently, RAW 264.7 cells were stimulated with lipopolysaccharide (LPS, 0.1 μg/mL) for 2 h in an incubator at 37°C with 5% CO2. The cells were then treated with 20 μL of each fraction solution, prepared in distilled water, at various concentrations (20, 40, and 60 μg/mL) and further incubated for 24 h. After incubation, 100 μL of the culture supernatant were mixed with an equal volume of the Griess reagent, allowed to react for 10 min, and then the absorbance was measured at 540 nm using a microplate reader. The NO inhibitory activity was expressed as the percentage inhibition of NO production relative to the LPS-treated control and calculated using Equation (3):
where: A represents the absorbance of the sample-treated group (LPS + reaction solution + sample), B represents the blank absorbance (reaction solution without LPS or sample), and C represents the absorbance of the control group (LPS + reaction solution).
Statistical analysis
The experimental results were expressed as the mean and standard deviation of three replicate measurements. Statistical analysis was performed using IBM SPSS Statistics ver. 23 (IBM Corp., Armonk, NY, USA), employing a one-way analysis of variance (ANOVA), with a significance level set at p<0.05. Significant differences between the mean values obtained from the experimental results were verified using Duncan’s multiple-range test. The correlation between the bioactive compound contents and biological activity was analyzed using Pearson’s correlation analysis.
RESULTS AND DISCUSSION
Yield and distribution ratio
After removal of the deep eutectic solvent, the dry weight of the extract was determined, yielding 32.7 g of dried extract obtained from 100 g of dried maca leaves. Based on this extract, the dry weights of the fractions were 3.84 g (Fr. 1), 1.73 g (Fr. 2), 0.76 g (Fr. 3), and 0.90 g (Fr. 4) (data not shown). The yields and distribution ratios calculated from these data are presented in Table 1. Total yield of fractions was 22.10%, with Fr. 1 showing the highest yield at 11.75%, followed by Fr.2 (5.28%), Fr. 4 (2.76%), and Fr. 3 (2.31%). The corresponding distribution ratios were 52.98% for Fr. 1, 24.02% for Fr. 2, 10.45% for Fr. 3, and 12.55% for Fr. 4. Since the yield and distribution patterns of fractions are strongly influenced by extraction and chromatography conditions, these values are provided to describe the fractionation profile rather than to imply a direct association with biological activity.
Table 1
Yields and distribution ratios of fractions obtained from the maca leaf extract by Diaion HP20 column chromatography.
| Fraction | Yield (%) | Distribution ratio (%) |
|---|---|---|
| Fr. 1 | 11.75±1.90a | 52.98±3.72a |
| Fr. 2 | 5.28±0.38b | 24.02±2.97b |
| Fr. 3 | 2.31±0.22b | 10.45±0.79c |
| Fr. 4 | 2.76±0.55b | 12.55±2.73bc |
| Total | 22.10±2.05 | 100 |
[i] Results are shown as mean ± standard deviation (n=3). Values with different letters in the same column are significantly different at p<0.05 by Duncan’s multiple range test. The fractions eluted using 25%, 50%, 75%, and 100% (v/v) ethanol were designated as Fr. 1, Fr. 2, Fr. 3, and Fr. 4, respectively.
Total saponin and total phenolic contents
The TSC and TPC of the maca leaf extract fractions are shown in Table 2. Saponins are known secondary metabolites found in various plants as molecules in which hydrophobic triterpenoid, steroid or alkaloid aglycones are linked with hydrophilic moieties of different sugars [El Aziz et al., 2019]. Their structures are diverse and complex, influenced by the aglycone structure and the attached side chains. They also exhibit a range of physiological activities, such as anti-inflammatory, antibacterial, antidiabetic, and antitumor effects, as well as blood lipid-reducing and blood cholesterol-reducing effects [Sharma et al., 2023]. In our study, the TSC in the fractions, expressed in oleanolic acid equivalents, increased with increasing ethanol concentration in the mobile phase used to elute the fractions. Specifically, Fr. 4 showed the highest saponin content (260.95 mg OAE/g DW), followed by Fr. 3 (219.37 mg OAE/g DW) and Fr. 2 (151.11 mg OAE/g DW), whereas Fr. 1 had the lowest saponin content (76.03 mg OAE/g DW). Ethanol, methanol, acetone, ethyl acetate, and n-butanol are used for saponin extraction, whereas ethanol and n-butanol are commonly used solvents [El Aziz et al., 2019]. Del Hierro et al. [2018] extracted saponins from various legumes using water, ethanol, methanol, and their aqueous mixtures as solvents, with ethanol extracts showing the highest saponin content. Deng et al. [2012] obtained fractions from the roots of Polygonatum odoratum (Mill.) Druce through ethanol extraction and n-butanol fractionation, followed by refractionation with H2O, and 20%, 40%, 60%, and 80% ethanol using a D101 macroporous resin column chromatography. They determined the saponin content of each fraction and reported that it increased with rising ethanol concentrations, which is consistent with the results of the present study.
Table 2
Total saponin and total phenolic contents of the fractions obtained from the maca leaf extract by Diaion HP20 column chromatography.
| Fraction | Total saponin content (mg OAE/g DW) | Total phenolic content (mg GAE/g DW) |
|---|---|---|
| Fr. 1 | 76.03±2.44d | 59.92±1.35b |
| Fr. 2 | 151.11±2.71c | 104.78±3.62a |
| Fr. 3 | 219.37±0.99b | 53.45±0.16c |
| Fr. 4 | 260.95±0.48a | 32.78±0.87d |
[i] Results are shown as mean ± standard deviation (n=3). Values with different letters in the same column are significantly different at p<0.05 by Duncan’s multiple range test. OAE, oleanolic acid equivalent; GAE, gallic acid equivalent; DW, dry weight of fraction. The fractions eluted using 25%, 50%, 75%, and 100% (v/v) ethanol were designated as Fr. 1, Fr. 2, Fr. 3, and Fr. 4, respectively.
Phenolic compounds are secondary metabolites containing one or more hydroxyl groups on the aromatic rings and are known to exert various physiological effects such as antioxidant, anti-inflammatory, antidiabetic, and anticancer activities [Tsao, 2010]. The TPC in the maca leaf fractions was expressed using GA as a standard (Table 2). Fr. 2 exhibited the highest TPC (104.78 mg GAE/g DW), followed by Fr. 1 (59.92 mg GAE/g DW) and Fr. 3 (53.45 mg GAE/g DW), whereas Fr. 4 had the lowest TPC (32.78 mg GAE/g DW). Phenolic compounds are relatively hydrophilic and are extracted using water or polar organic solvents, such as methanol, ethanol, and acetone, or their aqueous mixtures [Tsao, 2010]. A mixture of ethanol and water is commonly used to extract phenolic compounds from plant materials, as aqueous–ethanol solvent systems efficiently solubilize phenolic acids, flavonoids, and other polyphenols [Kobus-Cisowska et al., 2020; Palaiogiannis et al., 2023; Plaskova & Mlcek, 2023]. Consistent with this general extraction behavior, del Hierro et al. [2018] reported that the total phenolic content was highest in extracts obtained using a 50% aqueous solvent compared with pure organic solvents, such as ethanol and methanol. Similar trends have also been observed in Brassicaceae plants; for instance, Reungoat et al. [2020] and Chadni et al. [2023] demonstrated efficient extraction of sinapine and related phenolic compounds from mustard (Brassica juncea) using ethanol–water mixtures.
Although direct quantitative comparisons are limited by differences in plant organs, cultivation environments, and extraction methods, previous studies have shown that the phytochemical composition of L. meyenii varies according to organ type and growing conditions [Gonzales et al., 2014; Lee & Chang, 2019]. In general, maca leaves contain higher levels of phenolics and saponins than roots, and environmental factors such as altitude and soil conditions can further influence their accumulation [Lee & Chang, 2020; Szakiel et al., 2011]. The phenolic compounds and saponins examined in this study are not unique to maca but are widely distributed across the species (L. meyenii), the genus (Lepidium), and the Brassicaceae family [Gonzales et al., 2014; Yang et al., 2018]. Therefore, the significance of the present study lies not in the identification of novel compounds, but in the selective enrichment of known phenolic and saponin compounds from maca leaves using DES-based UAE combined with macroporous resin fractionation, and in linking these enriched fractions to specific biological activities.
Individual phenolic compound content
The contents of individual phenolic compounds in the four fractions of maca leaf extract are presented in Table 3. A total of nine compounds were detected: gallic acid, catechin, caffeic acid, cinnamic acid, epicatechin, ferulic acid, p-coumaric acid, protocatechuic acid, and naringin. Notably, various phenolic compounds were detected in Fr. 1, Fr. 2, and Fr. 3, with Fr. 2 having the highest phenolic compound content, except for gallic acid. Catechin was particularly abundant, with contents of 43.43, 51.02, and 8.14 mg/g DW in Fr. 1, Fr. 2, and Fr. 3, respectively. Additionally, all fractions contained gallic acid in the range of 1.83–6.06 mg/g DW. Campos et al. [2013] optimized the ethanol extraction conditions to extract phenolics from maca roots and analyzed the phenolic compound content of the extract obtained under the optimal conditions. They showed the abundance of catechin derivatives and the presence of p-coumaric acid and protocatechuic acid, which aligned with the phenolics identified in maca leaf fractions in our study. Catechin is a flavonoid widely present in foods such as tea, wine, and various fruits, and has been reported to exhibit strong antioxidant properties, including scavenging activities against hydroxyl, peroxyl, superoxide, and DPPH•, as well as metal-chelating ability [Yilmaz, 2006]. Gallic acid, a phenolic acid abundantly found in various fruits and vegetables, is recognized for its biological effects, such as antibacterial, antioxidant, anticancer, anti-inflammatory, and antiviral effects [Hadidi et al., 2024]. Its strong antioxidant capacity is particularly noted for neutralizing free radicals, reducing oxidative stress, and protecting cells from damage.
Table 3
Content of individual phenolic compounds of the fractions (mg/g dry weight) obtained from the maca leaf extract by Diaion HP20 column chromatography.
[i] Results are shown as mean ± standard deviation (n=3). Values with different letters in the same row are significantly different at p<0.05 by Duncan’s multiple range test. ND, not detected. The fractions eluted using 25%, 50%, 75%, and 100% (v/v) ethanol were designated as Fr. 1, Fr. 2, Fr. 3, and Fr. 4, respectively.
Antioxidant activity
The antioxidant activity of maca leaf extract fractions determined by DPPH and ABTS assays and expressed as IC50 values is shown in Table 4. The IC50 value for DPPH• scavenging activity was the lowest for Fr. 2 (0.52 mg/mL), followed by Fr. 1 (0.99 mg/mL), Fr. 4 (1.10 mg/mL), and Fr. 3 (1.20 mg/mL). Similarly, the IC50 value for the ABTS•+ scavenging activity was the lowest in Fr. 2 (0.38 mg/mL), followed by Fr. 3 (0.69 mg/mL), Fr. 1 (0.83 mg/mL), and Fr. 4 (2.63 mg/mL). Accordingly, Fr. 1 exhibited the highest antioxidant activity, and the inhibitory activity against ABTS•+ was higher than that against DPPH• in all fractions, except Fr. 4. DPPH• are scavenged by hydrogen atom donation, whereas ABTS•+ are scavenged by electron transfer [Li et al., 2012]. Therefore, all fractions, except Fr. 4, are considered to contain more bioactive compounds that can donate electrons. Carica papaya leaf extracts obtained under optimized saponin ethanol extraction conditions showed higher antioxidant activities with an increase in saponin and phenolic contents [Vuong et al., 2015]. Additionally, Naidu et al. [2011] determined the saponin and phenolic contents and antioxidant activities of extracts from buckwheat seeds, husks, and endosperm using ethanol and reported that the DPPH• scavenging activity was more influenced by the phenolic content than by the saponin content, similar to the results of the present study. Thus, the high antioxidant activity of Fr. 2 is attributed to its high phenolic content, supporting the hypothesis that this fraction could be a potential source of antioxidants.
Table 4
IC50 value (mg/mL) of the fractions obtained from the maca leaf extract by Diaion HP20 column chromatography in antioxidant assays.
| Fraction | DPPH assay | ABTS assay |
|---|---|---|
| Fr. 1 | 0.99±0.02c | 0.83±0.00b |
| Fr. 2 | 0.52±0.02d | 0.38±0.02d |
| Fr. 3 | 1.20±0.03a | 0.69±0.02c |
| Fr. 4 | 1.10±0.03b | 2.63±0.08a |
[i] Results are shown as mean ± standard deviation (n=3). Values with different letters in the same column are significantly different at p<0.05 by Duncan’s multiple range test. The fractions eluted using 25%, 50%, 75%, and 100% (v/v) ethanol were designated as Fr. 1, Fr. 2, Fr. 3, and Fr. 4, respectively.
α-Glucosidase inhibitory activity
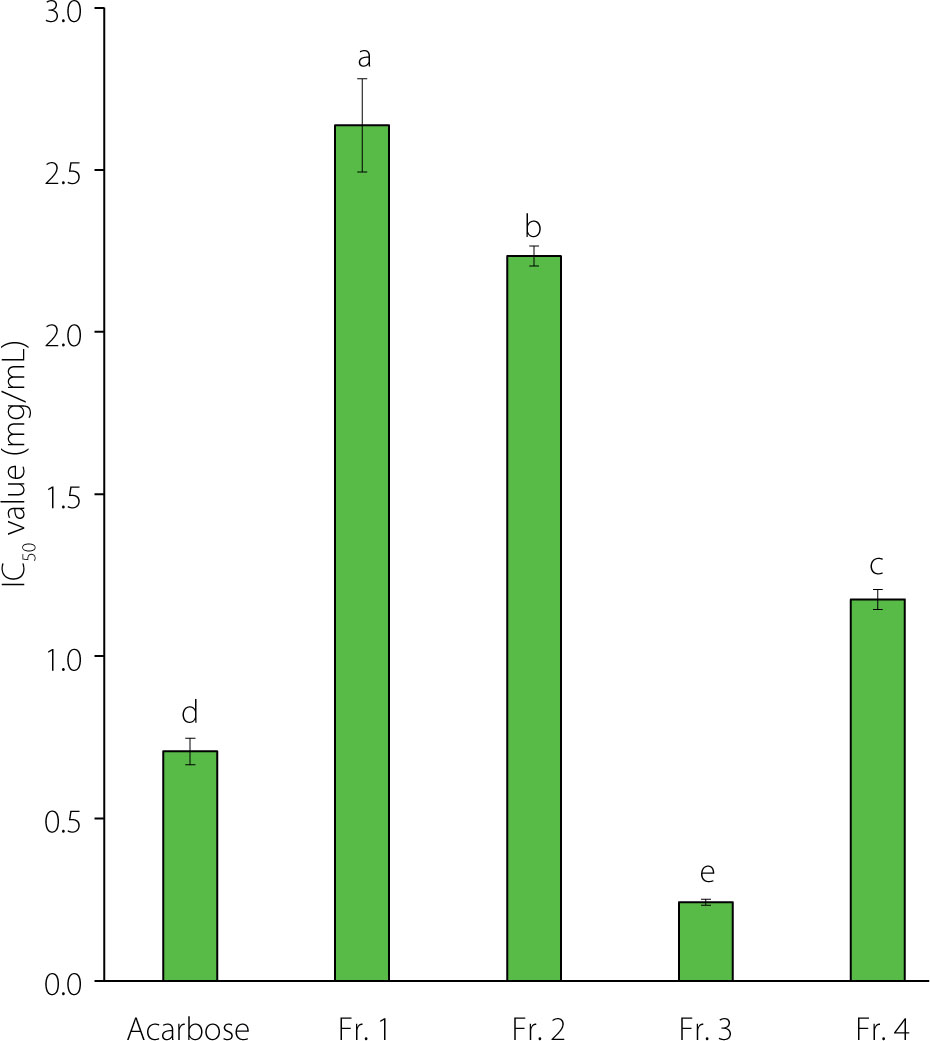
α-Glucosidase is a digestive enzyme in the small intestine that converts polysaccharides into monosaccharides, which rapidly increases blood sugar levels. Thus, the use of α-glucosidase inhibitors can delay carbohydrate digestion and suppress postprandial hyperglycemia. Consequently, α-glucosidase inhibitory activity is employed as an indicator for evaluating substances that can control blood sugar [Hossain et al., 2020]. The IC50 values for the α-glucosidase inhibitory activity of each fraction obtained by varying ethanol concentrations are shown in Figure 1. Fr. 3 exhibited the lowest IC50 value (0.24 mg/mL), followed by Fr. 4 (1.18 mg/mL), Fr. 2 (2.23 mg/mL), and Fr. 1 (2.64 mg/mL), in order of an increasing IC50 value. Notably, the IC50 of Fr. 3 was significantly lower than that of acarbose (0.71 mg/mL), an antidiabetic agent (p<0.05), and Fr. 4 exhibited inhibitory activity corresponding to approximately 75% of acarbose activity. Maca leaves contain a wider variety of saponins than roots, such as triterpenes, esculin hydrate, tanshinone I, panaxytriol, lanatoside, marsdecoiside B, colubrinoside, and rotundifolioside, with the leaves having higher saponin contents than the roots [Lee & Chang, 2019]. Studies have reported that these saponins have higher α-glucosidase inhibitory activity than acarbose [Deng et al., 2012; Luo et al., 2008]. Thus, the high α-glucosidase inhibitory activities of Fr. 3 and Fr. 4 are attributed to their high TSC. However, despite the high TSC of Fr. 4, its inhibitory activity was lower than that of Fr. 3, which is thought to be due to the type of saponin and phenolics that each fraction contained.
Figure 1
α-Glucosidase inhibitory activity of fractions obtained from the maca leaf extract using a Diaion HP20 resin column. The bar represents the mean and standard deviation (n=3). Values with different letters are significantly different at p<0.05 by Duncan’s multiple-range test. The fractions eluted using 25%, 50%, 75%, and 100% (v/v) ethanol were designated as Fr. 1, Fr. 2, Fr. 3, and Fr. 4, respectively.
Nitric oxide inhibitory activity
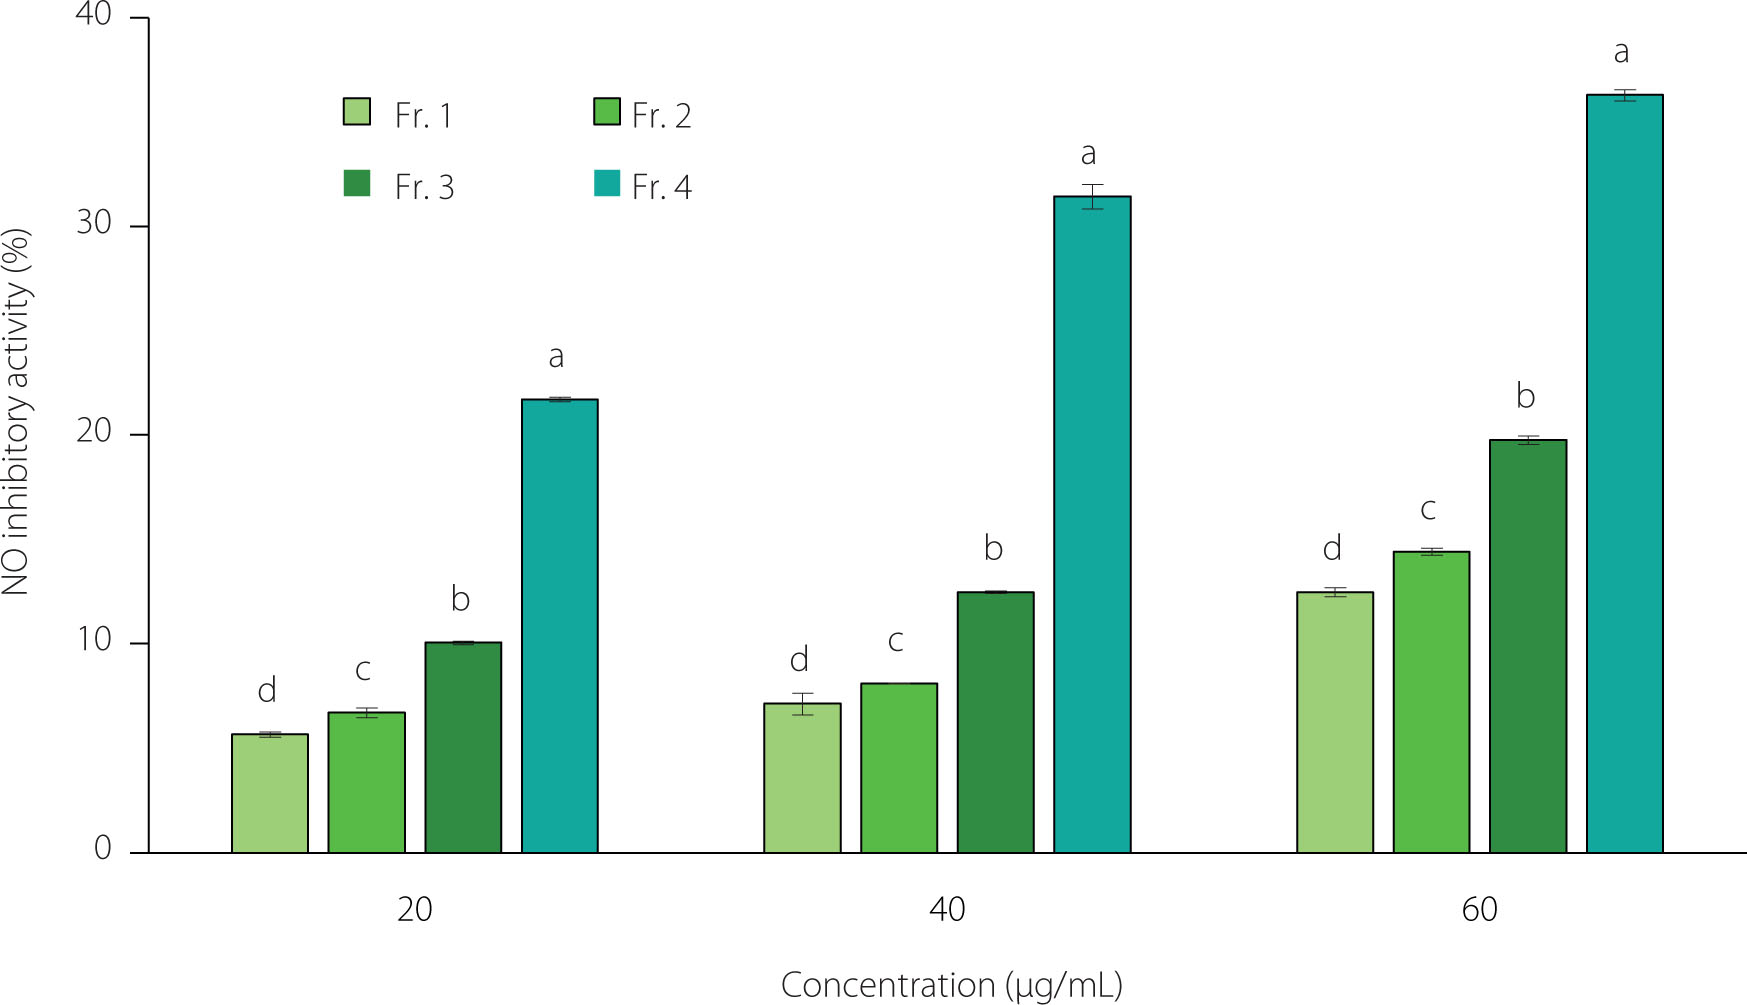
LPS, a structural constituent of Gram-negative bacterial outer membranes, induces inflammatory activation of macrophages. Macrophages induced with inflammation by LPS produce proinflammatory mediators, such as NO and prostaglandin E2 [Yang et al., 2012]. The NO inhibitory effect of each fraction on LPS-induced NO release from RAW 264.7 cells is shown in Figure 2. In all fractions, NO production decreased in a concentration-dependent manner. In particular, Fr. 4 exhibited the highest inhibition of NO production (p<0.05), with 21.72% inhibition at 20 μg/mL, 31.44% at 40 μg/mL, and 36.30% at 60 μg/mL. Additionally, the NO inhibitory activities of Fr. 1, Fr. 2, and Fr. 3 were 12.48%, 14.42%, and 19.77% at 60 μg/mL, respectively, indicating that the inhibitory activity increased proportionally with the saponin content in the fraction. According to Jang et al. [2015], the saponin fraction extracted from ginseng inhibited NO production by suppressing the production of inflammatory cytokines, such as tumor necrosis factor-α and interleukin-1β. Yan et al. [2016] found that steroid saponin extracted from Trillium tschonoskii Maxim also inhibited NO production. Therefore, the highest NO production inhibition effect observed in Fr. 4 is attributed to its high saponin content.
Figure 2
NO inhibitory activity of fractions of different concentrations obtained from the maca leaf extract using a Diaion HP20 resin column. The bar represents the mean and standard deviation (n=3). Values with different letters are significantly different at p<0.05 by Duncan’s multiple-range test. The fractions eluted using 25%, 50%, 75%, and 100% (v/v) ethanol were designated as Fr. 1, Fr. 2, Fr. 3, and Fr. 4, respectively.
Correlations between the bioactive compound contents and bioactivities
Pearson correlation analysis was conducted to determine the relationships among TSC, TPC, and antioxidant (IC50 values in DPPH and ABTS assays), α-glucosidase inhibitory (IC50 values), and NO inhibitory activities of maca leaf extract fractions (Table 5). The DPPH• scavenging activity significantly correlated with the TPC (r=−0.911, p<0.01) and all individual phenolic compound contents but not with TSC. The ABTS•+ scavenging activity significantly correlated with the TPC (r=−0.772, p<0.01) and with the TSC (r=−0.633, p<0.05). The ABTS assay values also significantly correlated with the contents of all phenolic compounds, except caffeic acid. The α-glucosidase inhibitory activity was strongly correlated with TSC (r=−0.801), TPC (r=−0.735), catechin (r=−0.807), GA (r=−0.843), cinnamic acid (r=−0.997), and caffeic acid (r=−0.948) (p<0.01), and significantly correlated with epicatechin (r=−0.761, p<0.05). The NO inhibitory activity was strongly correlated with the TPC (r=0.965, p<0.01), cinnamic acid (r=0.998, p<0.01), and caffeic acid (r=0.899, p<0.01), and significantly correlated with ferulic acid (r=0.602, p<0.05). Although cinnamic acid showed a high correlation with NO inhibitory activity, its low content in the fractions suggests a limited direct contribution. This correlation likely reflects its co-enrichment with other phenolic compounds and saponins, whereas caffeic acid, present at higher levels, may play a more direct role in NO inhibition.
Table 5
Coefficients of Pearson’s correlations among bioactive compound content, DPPH• scavenging activity, ABTS•+ scavenging activity, α-glucosidase inhibitory activity and NO inhibitory activity.
TSC showed a significant correlation with both α-glucosidase and NO inhibitory activities (p<0.01) (Table 5). Additionally, TSC significantly correlated with the ABTS•+ scavenging activity (p<0.05) but its correlation with the DPPH• scavenging activity was insignificant (p>0.05), which suggests that the hydrophilic saponins of the maca leaf fractions contributed more effectively to ABTS•+ scavenging. Although individual saponin species were not identified in this study, the significant correlation between TSC and NO inhibitory activity suggests that saponins of the maca leaf fractions may collectively contribute to antiinflammatory effects, as saponins have been widely reported to suppress nitric oxide production in activated macrophages [Francis et al., 2002; Wang et al., 2008].
The TPC exhibited a significant correlation with the DPPH• scavenging, ABTS•+ scavenging, and α-glucosidase inhibitory activities (p<0.01) (Table 5). These results aligned with the findings of Lee & Chang [2019], who reported a strong correlation between the TPC of the methanol extract from maca leaves and the DPPH• scavenging activity. A previous study also reported that the TPC demonstrated a strong correlation with antioxidant activity measured by the DPPH assay (r=0.95, p<0.001) and a significant correlation with α-glucosidase inhibitory activity (r=0.73, p<0.05) [Tian et al., 2025]. The strong association between TPC and radical scavenging activity can be explained by the redox properties of phenolic compounds, particularly the electron-donating ability of their hydroxyl groups and reducing ketone moieties, which enable effective neutralization of reactive species and disruption of oxidative chain reactions [Millán-Laleona et al. 2023; Vyas et al., 2012]. The α-glucosidase inhibition of phenolic compounds is associated with polyphenol-induced conformational changes in the enzyme, including reductions in α-helix and β-sheet structures, which ultimately suppress enzymatic activity [Gong et al., 2020]. In addition, the magnitude of this inhibitory effect may depend on the presence and number of phenolic hydroxyl groups within the molecular structure of the compounds [Lee et al., 2019].
Contents of catechin, epicatechin, and gallic acid demonstrated significant correlations with both DPPH• and ABTS•+ scavenging activities and α-glucosidase inhibitory activity. Moreover, caffeic acid showed a significant correlation with the DPPH• scavenging, α-glucosidase inhibitory, and NO inhibitory activities. Consequently, these four compounds, in conjunction with saponins, were identified as the primary phenolic compounds that influence the biological activity of maca leaf extracts. In contrast, although cinnamic acid was strongly correlated with all bioactivities, it was present in only small quantities in Fr. 2 and Fr. 3. Therefore, concluding that cinnamic acid was the main component that affects the biological activity of maca leaf extracts is unjustified.
CONCLUSIONS
In this study, maca leaf extracts obtained by DES-based ultrasoundassisted extraction were fractionated using macroporous resin chromatography and analyzed for the distribution of bioactive compounds and related biological activities. Distinct functional characteristics were observed among the fractions. The fraction eluted with pure ethanol showed pronounced inhibition of nitric oxide production, which corresponded to its relatively high phenolic content. The fraction eluted with 75% (v/v) ethanol exhibited strong α-glucosidase inhibitory activity, likely associated with the combined presence of saponins and phenolic compounds, including appreciable amounts of caffeic acid and gallic acid. Meanwhile, the fraction eluted with 50% (v/v) demonstrated the highest antioxidant capacity, consistent with its elevated total phenolic content and chemically-diverse phenolic profile. Taken together, these results indicate that maca leaf fractions differ markedly in their functional properties depending on their phytochemical composition, and highlight the potential of phenolic- and saponin-enriched fractions as value-added ingredients for functional food applications. Further studies focusing on the underlying mechanisms of action would support more targeted utilization of these fractions in the food industry.